

Key Insights
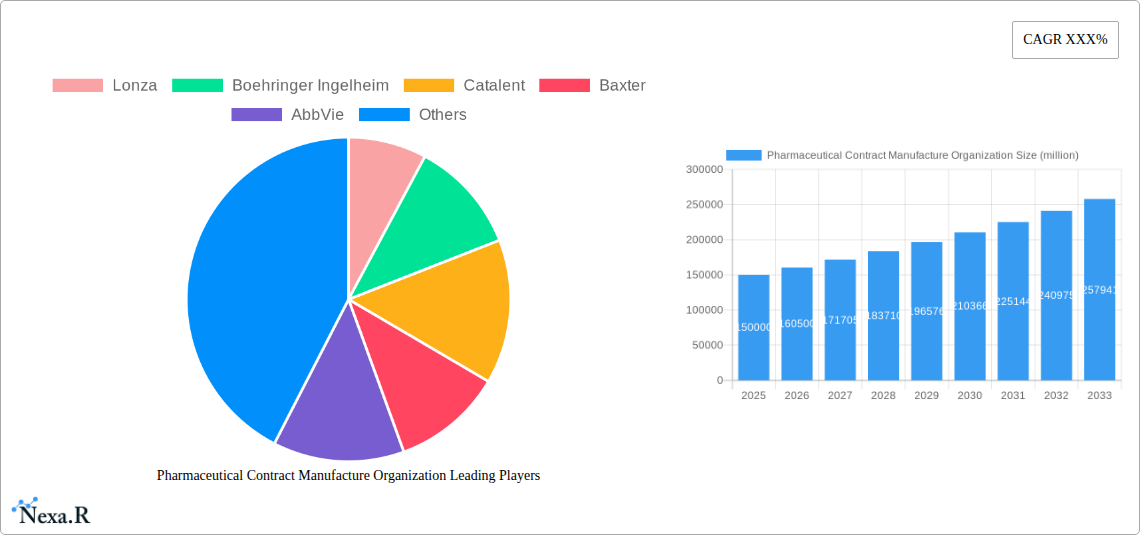
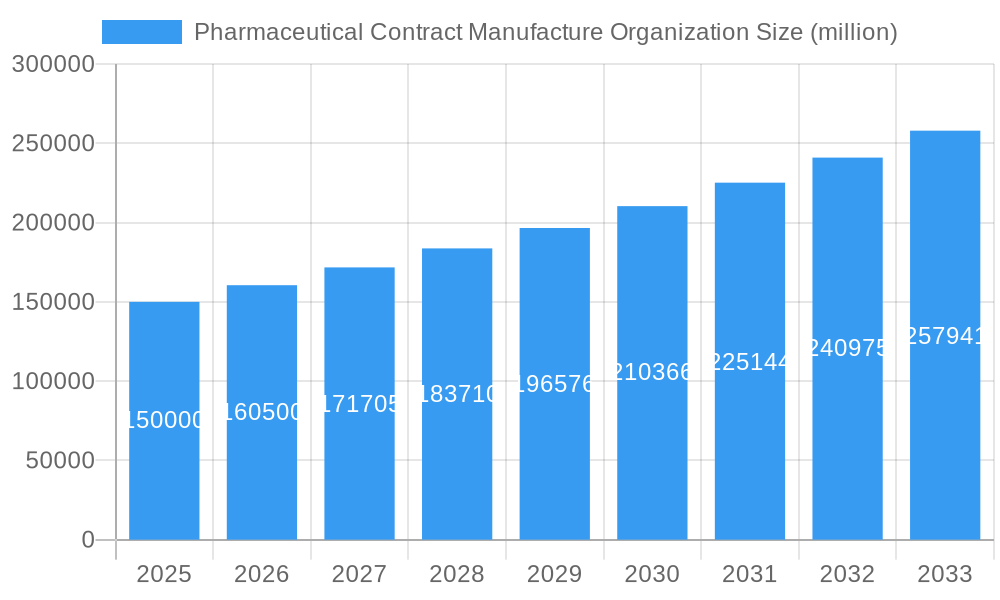
The Pharmaceutical Contract Manufacturing Organization (PCMO) market is experiencing robust growth, driven by the increasing outsourcing trend among pharmaceutical and biotechnology companies. This shift is fueled by several factors, including the rising complexity of drug development, the need for specialized manufacturing capabilities (e.g., sterile injectables, biologics), and the desire to reduce capital expenditure on internal infrastructure. The market's expansion is further bolstered by the burgeoning demand for generic drugs and biosimilars, which rely heavily on contract manufacturers. We estimate the 2025 market size to be approximately $150 billion, considering the substantial investments in capacity expansion by major players like Lonza, Catalent, and Boehringer Ingelheim, and a consistent CAGR of around 7% for the past few years, a trend likely to persist in the coming decade. This estimate is substantiated by reports indicating significant growth across various segments, including drug substance manufacturing, drug product manufacturing, and analytical testing services. The strong pipeline of new drug approvals and the growing prevalence of complex drug formulations further contribute to this optimistic outlook.
Pharmaceutical Contract Manufacture Organization Market Size (In Billion)
However, despite the positive market dynamics, the PCMO industry faces certain challenges. Regulatory hurdles and stringent quality control standards necessitate substantial investment in compliance and technology. The increasing demand for personalized medicine and advanced therapies also places a premium on the development of specialized manufacturing processes, requiring substantial R&D investments and potential pricing pressures. Furthermore, geopolitical factors and supply chain disruptions continue to present risks to the industry’s stability. Nevertheless, strategic partnerships, technological advancements (e.g., continuous manufacturing, automation), and a focus on innovation are key to navigating these hurdles and sustaining long-term growth. The competitive landscape is characterized by both large multinational corporations and smaller specialized firms, each offering unique strengths in terms of scale, expertise, and service offerings.
Pharmaceutical Contract Manufacture Organization Company Market Share
Pharmaceutical Contract Manufacturing Organization (CDMO) Market Report: 2019-2033
This comprehensive report provides a detailed analysis of the global Pharmaceutical Contract Manufacturing Organization (CDMO) market, offering invaluable insights for industry professionals, investors, and strategic decision-makers. Covering the period 2019-2033, with a focus on 2025, this report dissects market dynamics, growth trends, regional dominance, and key players, equipping you with the knowledge to navigate this rapidly evolving landscape. The report delves into both the parent market (Pharmaceutical Manufacturing) and the child market (Contract Manufacturing Services) to provide a holistic view.
Pharmaceutical Contract Manufacture Organization Market Dynamics & Structure
The global Pharmaceutical CDMO market is characterized by a moderately concentrated structure, with a few large players holding significant market share. However, the landscape is dynamic, with ongoing mergers and acquisitions (M&A) activity reshaping the competitive landscape. Technological innovation, particularly in advanced drug delivery systems and biologics manufacturing, is a key driver. Stringent regulatory frameworks and evolving global healthcare policies significantly influence market growth. Generic drug manufacturing and outsourcing trends fuel demand for CDMO services, while capacity constraints and pricing pressures pose challenges.
- Market Concentration: Top 5 players hold approximately xx% market share in 2025 (estimated).
- M&A Activity: An average of xx M&A deals per year were recorded between 2019-2024, valued at approximately $xx billion.
- Technological Innovation: Focus on advanced therapies (e.g., cell and gene therapies) and continuous manufacturing processes.
- Regulatory Landscape: Stringent GMP (Good Manufacturing Practices) compliance and regulatory approvals impact market entry.
Pharmaceutical Contract Manufacture Organization Growth Trends & Insights
The Pharmaceutical CDMO market experienced robust growth between 2019 and 2024, driven by increasing outsourcing trends within the pharmaceutical industry. The market size is estimated to be $xx billion in 2025, exhibiting a CAGR of xx% during the historical period (2019-2024). The adoption rate of CDMO services is projected to increase further, reaching xx% market penetration by 2033. Technological disruptions, such as automation and digitalization in manufacturing processes, are accelerating efficiency and impacting cost structures. The growing demand for personalized medicine and specialized drug formulations is also boosting market expansion. Consumer behavior shifts toward greater transparency and demand for high-quality, affordable medications influences CDMO selection criteria. The forecast period (2025-2033) projects a CAGR of xx%, driven by sustained outsourcing, innovation, and emerging therapeutic areas.
Dominant Regions, Countries, or Segments in Pharmaceutical Contract Manufacture Organization
North America currently holds the largest market share in the Pharmaceutical CDMO sector, driven by a robust pharmaceutical industry, advanced infrastructure, and strong regulatory support. However, the Asia-Pacific region is demonstrating the fastest growth, fueled by increasing investment in pharmaceutical manufacturing, a large patient population, and favorable government policies. Europe holds a substantial market share and remains a key player due to established pharmaceutical clusters and technological advancements.
- North America: High market share due to established infrastructure and strong pharmaceutical industry.
- Asia-Pacific: Fastest-growing region due to rising investment and large patient population.
- Europe: Significant market share driven by established pharmaceutical clusters and technological expertise.
- Key Drivers: Government incentives, technological advancements, and increasing outsourcing by pharmaceutical companies.
Pharmaceutical Contract Manufacture Organization Product Landscape
The CDMO market offers a diverse range of services, encompassing the development and manufacturing of small molecule drugs, biologics, and advanced therapies. Product innovation focuses on enhancing drug delivery systems, improving efficacy, and optimizing manufacturing processes. Key performance metrics include yield, purity, and cost-effectiveness. Unique selling propositions for CDMOs include specialized expertise, advanced technologies, and flexible service offerings tailored to client needs. Technological advancements in areas such as continuous manufacturing and process analytical technology (PAT) are driving efficiency and quality improvements.
Key Drivers, Barriers & Challenges in Pharmaceutical Contract Manufacture Organization
Key Drivers:
- Increasing outsourcing by pharmaceutical companies to reduce costs and focus on core competencies.
- Growing demand for advanced therapies, requiring specialized CDMO expertise.
- Technological advancements leading to greater efficiency and scalability.
Key Challenges:
- Regulatory complexities and compliance requirements create significant hurdles.
- Supply chain disruptions and raw material shortages can impact production timelines.
- Intense competition among CDMOs necessitates strategic differentiation and innovation. (Quantifiable impact: xx% reduction in profitability due to price wars in some segments).
Emerging Opportunities in Pharmaceutical Contract Manufacture Organization
- Expansion into emerging markets with growing healthcare needs.
- Development of CDMO services for personalized medicines and advanced therapies.
- Leveraging digital technologies to enhance efficiency and transparency across the supply chain.
Growth Accelerators in the Pharmaceutical Contract Manufacture Organization Industry
Strategic partnerships between CDMOs and pharmaceutical companies are accelerating growth by providing access to technology, expertise, and market access. Technological breakthroughs in areas like AI-driven process optimization and continuous manufacturing are enabling increased efficiency and cost reduction. Market expansion strategies focused on underserved therapeutic areas and geographic regions offer significant growth potential.
Key Players Shaping the Pharmaceutical Contract Manufacture Organization Market
- Lonza
- Boehringer Ingelheim
- Catalent
- Baxter
- AbbVie
- Pfizer
- Evonik
- Fareva group
- Aenova
- Almac
- Delpharm
- Recipharm
- Aesica
- NIPRO CORPORATION
- Daito Pharmaceutical
- Teva API
- Esteve Quimica
- Euticals
- Zhejiang Hisun Pharmaceuticals
Notable Milestones in Pharmaceutical Contract Manufacture Organization Sector
- 2020: Increased investment in digitalization and automation by major CDMOs.
- 2021: Several significant M&A deals reshaped the competitive landscape.
- 2022: Focus on sustainability and environmentally friendly manufacturing processes.
- 2023: Launch of several novel drug products manufactured by CDMOs.
In-Depth Pharmaceutical Contract Manufacture Organization Market Outlook
The future of the Pharmaceutical CDMO market is bright, driven by continuous technological advancements, expanding outsourcing trends, and the growing demand for innovative therapies. Strategic partnerships, targeted investments in capacity expansion, and a focus on sustainable manufacturing practices will be critical for success. The market is poised for strong growth, offering substantial opportunities for both established players and emerging entrants. The long-term outlook anticipates sustained market expansion, fueled by continuous innovation and increasing demand for CDMO services across various therapeutic areas and geographies.
Pharmaceutical Contract Manufacture Organization Segmentation
-
1. Application
- 1.1. Specialty/Midsize
- 1.2. Generics
- 1.3. Big Pharma
- 1.4. Others
-
2. Type
- 2.1. Active Pharmaceutical Ingredients (APIs)
- 2.2. Finished Dose Formulations (FDFs)
Pharmaceutical Contract Manufacture Organization Segmentation By Geography
-
1. North America
- 1.1. United States
- 1.2. Canada
- 1.3. Mexico
-
2. South America
- 2.1. Brazil
- 2.2. Argentina
- 2.3. Rest of South America
-
3. Europe
- 3.1. United Kingdom
- 3.2. Germany
- 3.3. France
- 3.4. Italy
- 3.5. Spain
- 3.6. Russia
- 3.7. Benelux
- 3.8. Nordics
- 3.9. Rest of Europe
-
4. Middle East & Africa
- 4.1. Turkey
- 4.2. Israel
- 4.3. GCC
- 4.4. North Africa
- 4.5. South Africa
- 4.6. Rest of Middle East & Africa
-
5. Asia Pacific
- 5.1. China
- 5.2. India
- 5.3. Japan
- 5.4. South Korea
- 5.5. ASEAN
- 5.6. Oceania
- 5.7. Rest of Asia Pacific

Pharmaceutical Contract Manufacture Organization Regional Market Share
Geographic Coverage of Pharmaceutical Contract Manufacture Organization
Pharmaceutical Contract Manufacture Organization REPORT HIGHLIGHTS
| Aspects | Details |
|---|---|
| Study Period | 2020-2034 |
| Base Year | 2025 |
| Estimated Year | 2026 |
| Forecast Period | 2026-2034 |
| Historical Period | 2020-2025 |
| Growth Rate | CAGR of XXX% from 2020-2034 |
| Segmentation |
|
Table of Contents
- 1. Introduction
- 1.1. Research Scope
- 1.2. Market Segmentation
- 1.3. Research Methodology
- 1.4. Definitions and Assumptions
- 2. Executive Summary
- 2.1. Introduction
- 3. Market Dynamics
- 3.1. Introduction
- 3.2. Market Drivers
- 3.3. Market Restrains
- 3.4. Market Trends
- 4. Market Factor Analysis
- 4.1. Porters Five Forces
- 4.2. Supply/Value Chain
- 4.3. PESTEL analysis
- 4.4. Market Entropy
- 4.5. Patent/Trademark Analysis
- 5. Global Pharmaceutical Contract Manufacture Organization Analysis, Insights and Forecast, 2020-2032
- 5.1. Market Analysis, Insights and Forecast - by Application
- 5.1.1. Specialty/Midsize
- 5.1.2. Generics
- 5.1.3. Big Pharma
- 5.1.4. Others
- 5.2. Market Analysis, Insights and Forecast - by Type
- 5.2.1. Active Pharmaceutical Ingredients (APIs)
- 5.2.2. Finished Dose Formulations (FDFs)
- 5.3. Market Analysis, Insights and Forecast - by Region
- 5.3.1. North America
- 5.3.2. South America
- 5.3.3. Europe
- 5.3.4. Middle East & Africa
- 5.3.5. Asia Pacific
- 5.1. Market Analysis, Insights and Forecast - by Application
- 6. North America Pharmaceutical Contract Manufacture Organization Analysis, Insights and Forecast, 2020-2032
- 6.1. Market Analysis, Insights and Forecast - by Application
- 6.1.1. Specialty/Midsize
- 6.1.2. Generics
- 6.1.3. Big Pharma
- 6.1.4. Others
- 6.2. Market Analysis, Insights and Forecast - by Type
- 6.2.1. Active Pharmaceutical Ingredients (APIs)
- 6.2.2. Finished Dose Formulations (FDFs)
- 6.1. Market Analysis, Insights and Forecast - by Application
- 7. South America Pharmaceutical Contract Manufacture Organization Analysis, Insights and Forecast, 2020-2032
- 7.1. Market Analysis, Insights and Forecast - by Application
- 7.1.1. Specialty/Midsize
- 7.1.2. Generics
- 7.1.3. Big Pharma
- 7.1.4. Others
- 7.2. Market Analysis, Insights and Forecast - by Type
- 7.2.1. Active Pharmaceutical Ingredients (APIs)
- 7.2.2. Finished Dose Formulations (FDFs)
- 7.1. Market Analysis, Insights and Forecast - by Application
- 8. Europe Pharmaceutical Contract Manufacture Organization Analysis, Insights and Forecast, 2020-2032
- 8.1. Market Analysis, Insights and Forecast - by Application
- 8.1.1. Specialty/Midsize
- 8.1.2. Generics
- 8.1.3. Big Pharma
- 8.1.4. Others
- 8.2. Market Analysis, Insights and Forecast - by Type
- 8.2.1. Active Pharmaceutical Ingredients (APIs)
- 8.2.2. Finished Dose Formulations (FDFs)
- 8.1. Market Analysis, Insights and Forecast - by Application
- 9. Middle East & Africa Pharmaceutical Contract Manufacture Organization Analysis, Insights and Forecast, 2020-2032
- 9.1. Market Analysis, Insights and Forecast - by Application
- 9.1.1. Specialty/Midsize
- 9.1.2. Generics
- 9.1.3. Big Pharma
- 9.1.4. Others
- 9.2. Market Analysis, Insights and Forecast - by Type
- 9.2.1. Active Pharmaceutical Ingredients (APIs)
- 9.2.2. Finished Dose Formulations (FDFs)
- 9.1. Market Analysis, Insights and Forecast - by Application
- 10. Asia Pacific Pharmaceutical Contract Manufacture Organization Analysis, Insights and Forecast, 2020-2032
- 10.1. Market Analysis, Insights and Forecast - by Application
- 10.1.1. Specialty/Midsize
- 10.1.2. Generics
- 10.1.3. Big Pharma
- 10.1.4. Others
- 10.2. Market Analysis, Insights and Forecast - by Type
- 10.2.1. Active Pharmaceutical Ingredients (APIs)
- 10.2.2. Finished Dose Formulations (FDFs)
- 10.1. Market Analysis, Insights and Forecast - by Application
- 11. Competitive Analysis
- 11.1. Global Market Share Analysis 2025
- 11.2. Company Profiles
- 11.2.1 Lonza
- 11.2.1.1. Overview
- 11.2.1.2. Products
- 11.2.1.3. SWOT Analysis
- 11.2.1.4. Recent Developments
- 11.2.1.5. Financials (Based on Availability)
- 11.2.2 Boehringer Ingelheim
- 11.2.2.1. Overview
- 11.2.2.2. Products
- 11.2.2.3. SWOT Analysis
- 11.2.2.4. Recent Developments
- 11.2.2.5. Financials (Based on Availability)
- 11.2.3 Catalent
- 11.2.3.1. Overview
- 11.2.3.2. Products
- 11.2.3.3. SWOT Analysis
- 11.2.3.4. Recent Developments
- 11.2.3.5. Financials (Based on Availability)
- 11.2.4 Baxter
- 11.2.4.1. Overview
- 11.2.4.2. Products
- 11.2.4.3. SWOT Analysis
- 11.2.4.4. Recent Developments
- 11.2.4.5. Financials (Based on Availability)
- 11.2.5 AbbVie
- 11.2.5.1. Overview
- 11.2.5.2. Products
- 11.2.5.3. SWOT Analysis
- 11.2.5.4. Recent Developments
- 11.2.5.5. Financials (Based on Availability)
- 11.2.6 Pfizer
- 11.2.6.1. Overview
- 11.2.6.2. Products
- 11.2.6.3. SWOT Analysis
- 11.2.6.4. Recent Developments
- 11.2.6.5. Financials (Based on Availability)
- 11.2.7 Evonik
- 11.2.7.1. Overview
- 11.2.7.2. Products
- 11.2.7.3. SWOT Analysis
- 11.2.7.4. Recent Developments
- 11.2.7.5. Financials (Based on Availability)
- 11.2.8 Fareva group
- 11.2.8.1. Overview
- 11.2.8.2. Products
- 11.2.8.3. SWOT Analysis
- 11.2.8.4. Recent Developments
- 11.2.8.5. Financials (Based on Availability)
- 11.2.9 Aenova
- 11.2.9.1. Overview
- 11.2.9.2. Products
- 11.2.9.3. SWOT Analysis
- 11.2.9.4. Recent Developments
- 11.2.9.5. Financials (Based on Availability)
- 11.2.10 Almac
- 11.2.10.1. Overview
- 11.2.10.2. Products
- 11.2.10.3. SWOT Analysis
- 11.2.10.4. Recent Developments
- 11.2.10.5. Financials (Based on Availability)
- 11.2.11 Delpharm
- 11.2.11.1. Overview
- 11.2.11.2. Products
- 11.2.11.3. SWOT Analysis
- 11.2.11.4. Recent Developments
- 11.2.11.5. Financials (Based on Availability)
- 11.2.12 Recipharm
- 11.2.12.1. Overview
- 11.2.12.2. Products
- 11.2.12.3. SWOT Analysis
- 11.2.12.4. Recent Developments
- 11.2.12.5. Financials (Based on Availability)
- 11.2.13 Aesica
- 11.2.13.1. Overview
- 11.2.13.2. Products
- 11.2.13.3. SWOT Analysis
- 11.2.13.4. Recent Developments
- 11.2.13.5. Financials (Based on Availability)
- 11.2.14 NIPRO CORPORATION
- 11.2.14.1. Overview
- 11.2.14.2. Products
- 11.2.14.3. SWOT Analysis
- 11.2.14.4. Recent Developments
- 11.2.14.5. Financials (Based on Availability)
- 11.2.15 Daito Pharmaceutical
- 11.2.15.1. Overview
- 11.2.15.2. Products
- 11.2.15.3. SWOT Analysis
- 11.2.15.4. Recent Developments
- 11.2.15.5. Financials (Based on Availability)
- 11.2.16 Teva API
- 11.2.16.1. Overview
- 11.2.16.2. Products
- 11.2.16.3. SWOT Analysis
- 11.2.16.4. Recent Developments
- 11.2.16.5. Financials (Based on Availability)
- 11.2.17 Esteve Quimica
- 11.2.17.1. Overview
- 11.2.17.2. Products
- 11.2.17.3. SWOT Analysis
- 11.2.17.4. Recent Developments
- 11.2.17.5. Financials (Based on Availability)
- 11.2.18 Euticals
- 11.2.18.1. Overview
- 11.2.18.2. Products
- 11.2.18.3. SWOT Analysis
- 11.2.18.4. Recent Developments
- 11.2.18.5. Financials (Based on Availability)
- 11.2.19 Zhejiang Hisun Pharmaceuticals
- 11.2.19.1. Overview
- 11.2.19.2. Products
- 11.2.19.3. SWOT Analysis
- 11.2.19.4. Recent Developments
- 11.2.19.5. Financials (Based on Availability)
- 11.2.1 Lonza
List of Figures
- Figure 1: Global Pharmaceutical Contract Manufacture Organization Revenue Breakdown (million, %) by Region 2025 & 2033
- Figure 2: North America Pharmaceutical Contract Manufacture Organization Revenue (million), by Application 2025 & 2033
- Figure 3: North America Pharmaceutical Contract Manufacture Organization Revenue Share (%), by Application 2025 & 2033
- Figure 4: North America Pharmaceutical Contract Manufacture Organization Revenue (million), by Type 2025 & 2033
- Figure 5: North America Pharmaceutical Contract Manufacture Organization Revenue Share (%), by Type 2025 & 2033
- Figure 6: North America Pharmaceutical Contract Manufacture Organization Revenue (million), by Country 2025 & 2033
- Figure 7: North America Pharmaceutical Contract Manufacture Organization Revenue Share (%), by Country 2025 & 2033
- Figure 8: South America Pharmaceutical Contract Manufacture Organization Revenue (million), by Application 2025 & 2033
- Figure 9: South America Pharmaceutical Contract Manufacture Organization Revenue Share (%), by Application 2025 & 2033
- Figure 10: South America Pharmaceutical Contract Manufacture Organization Revenue (million), by Type 2025 & 2033
- Figure 11: South America Pharmaceutical Contract Manufacture Organization Revenue Share (%), by Type 2025 & 2033
- Figure 12: South America Pharmaceutical Contract Manufacture Organization Revenue (million), by Country 2025 & 2033
- Figure 13: South America Pharmaceutical Contract Manufacture Organization Revenue Share (%), by Country 2025 & 2033
- Figure 14: Europe Pharmaceutical Contract Manufacture Organization Revenue (million), by Application 2025 & 2033
- Figure 15: Europe Pharmaceutical Contract Manufacture Organization Revenue Share (%), by Application 2025 & 2033
- Figure 16: Europe Pharmaceutical Contract Manufacture Organization Revenue (million), by Type 2025 & 2033
- Figure 17: Europe Pharmaceutical Contract Manufacture Organization Revenue Share (%), by Type 2025 & 2033
- Figure 18: Europe Pharmaceutical Contract Manufacture Organization Revenue (million), by Country 2025 & 2033
- Figure 19: Europe Pharmaceutical Contract Manufacture Organization Revenue Share (%), by Country 2025 & 2033
- Figure 20: Middle East & Africa Pharmaceutical Contract Manufacture Organization Revenue (million), by Application 2025 & 2033
- Figure 21: Middle East & Africa Pharmaceutical Contract Manufacture Organization Revenue Share (%), by Application 2025 & 2033
- Figure 22: Middle East & Africa Pharmaceutical Contract Manufacture Organization Revenue (million), by Type 2025 & 2033
- Figure 23: Middle East & Africa Pharmaceutical Contract Manufacture Organization Revenue Share (%), by Type 2025 & 2033
- Figure 24: Middle East & Africa Pharmaceutical Contract Manufacture Organization Revenue (million), by Country 2025 & 2033
- Figure 25: Middle East & Africa Pharmaceutical Contract Manufacture Organization Revenue Share (%), by Country 2025 & 2033
- Figure 26: Asia Pacific Pharmaceutical Contract Manufacture Organization Revenue (million), by Application 2025 & 2033
- Figure 27: Asia Pacific Pharmaceutical Contract Manufacture Organization Revenue Share (%), by Application 2025 & 2033
- Figure 28: Asia Pacific Pharmaceutical Contract Manufacture Organization Revenue (million), by Type 2025 & 2033
- Figure 29: Asia Pacific Pharmaceutical Contract Manufacture Organization Revenue Share (%), by Type 2025 & 2033
- Figure 30: Asia Pacific Pharmaceutical Contract Manufacture Organization Revenue (million), by Country 2025 & 2033
- Figure 31: Asia Pacific Pharmaceutical Contract Manufacture Organization Revenue Share (%), by Country 2025 & 2033
List of Tables
- Table 1: Global Pharmaceutical Contract Manufacture Organization Revenue million Forecast, by Application 2020 & 2033
- Table 2: Global Pharmaceutical Contract Manufacture Organization Revenue million Forecast, by Type 2020 & 2033
- Table 3: Global Pharmaceutical Contract Manufacture Organization Revenue million Forecast, by Region 2020 & 2033
- Table 4: Global Pharmaceutical Contract Manufacture Organization Revenue million Forecast, by Application 2020 & 2033
- Table 5: Global Pharmaceutical Contract Manufacture Organization Revenue million Forecast, by Type 2020 & 2033
- Table 6: Global Pharmaceutical Contract Manufacture Organization Revenue million Forecast, by Country 2020 & 2033
- Table 7: United States Pharmaceutical Contract Manufacture Organization Revenue (million) Forecast, by Application 2020 & 2033
- Table 8: Canada Pharmaceutical Contract Manufacture Organization Revenue (million) Forecast, by Application 2020 & 2033
- Table 9: Mexico Pharmaceutical Contract Manufacture Organization Revenue (million) Forecast, by Application 2020 & 2033
- Table 10: Global Pharmaceutical Contract Manufacture Organization Revenue million Forecast, by Application 2020 & 2033
- Table 11: Global Pharmaceutical Contract Manufacture Organization Revenue million Forecast, by Type 2020 & 2033
- Table 12: Global Pharmaceutical Contract Manufacture Organization Revenue million Forecast, by Country 2020 & 2033
- Table 13: Brazil Pharmaceutical Contract Manufacture Organization Revenue (million) Forecast, by Application 2020 & 2033
- Table 14: Argentina Pharmaceutical Contract Manufacture Organization Revenue (million) Forecast, by Application 2020 & 2033
- Table 15: Rest of South America Pharmaceutical Contract Manufacture Organization Revenue (million) Forecast, by Application 2020 & 2033
- Table 16: Global Pharmaceutical Contract Manufacture Organization Revenue million Forecast, by Application 2020 & 2033
- Table 17: Global Pharmaceutical Contract Manufacture Organization Revenue million Forecast, by Type 2020 & 2033
- Table 18: Global Pharmaceutical Contract Manufacture Organization Revenue million Forecast, by Country 2020 & 2033
- Table 19: United Kingdom Pharmaceutical Contract Manufacture Organization Revenue (million) Forecast, by Application 2020 & 2033
- Table 20: Germany Pharmaceutical Contract Manufacture Organization Revenue (million) Forecast, by Application 2020 & 2033
- Table 21: France Pharmaceutical Contract Manufacture Organization Revenue (million) Forecast, by Application 2020 & 2033
- Table 22: Italy Pharmaceutical Contract Manufacture Organization Revenue (million) Forecast, by Application 2020 & 2033
- Table 23: Spain Pharmaceutical Contract Manufacture Organization Revenue (million) Forecast, by Application 2020 & 2033
- Table 24: Russia Pharmaceutical Contract Manufacture Organization Revenue (million) Forecast, by Application 2020 & 2033
- Table 25: Benelux Pharmaceutical Contract Manufacture Organization Revenue (million) Forecast, by Application 2020 & 2033
- Table 26: Nordics Pharmaceutical Contract Manufacture Organization Revenue (million) Forecast, by Application 2020 & 2033
- Table 27: Rest of Europe Pharmaceutical Contract Manufacture Organization Revenue (million) Forecast, by Application 2020 & 2033
- Table 28: Global Pharmaceutical Contract Manufacture Organization Revenue million Forecast, by Application 2020 & 2033
- Table 29: Global Pharmaceutical Contract Manufacture Organization Revenue million Forecast, by Type 2020 & 2033
- Table 30: Global Pharmaceutical Contract Manufacture Organization Revenue million Forecast, by Country 2020 & 2033
- Table 31: Turkey Pharmaceutical Contract Manufacture Organization Revenue (million) Forecast, by Application 2020 & 2033
- Table 32: Israel Pharmaceutical Contract Manufacture Organization Revenue (million) Forecast, by Application 2020 & 2033
- Table 33: GCC Pharmaceutical Contract Manufacture Organization Revenue (million) Forecast, by Application 2020 & 2033
- Table 34: North Africa Pharmaceutical Contract Manufacture Organization Revenue (million) Forecast, by Application 2020 & 2033
- Table 35: South Africa Pharmaceutical Contract Manufacture Organization Revenue (million) Forecast, by Application 2020 & 2033
- Table 36: Rest of Middle East & Africa Pharmaceutical Contract Manufacture Organization Revenue (million) Forecast, by Application 2020 & 2033
- Table 37: Global Pharmaceutical Contract Manufacture Organization Revenue million Forecast, by Application 2020 & 2033
- Table 38: Global Pharmaceutical Contract Manufacture Organization Revenue million Forecast, by Type 2020 & 2033
- Table 39: Global Pharmaceutical Contract Manufacture Organization Revenue million Forecast, by Country 2020 & 2033
- Table 40: China Pharmaceutical Contract Manufacture Organization Revenue (million) Forecast, by Application 2020 & 2033
- Table 41: India Pharmaceutical Contract Manufacture Organization Revenue (million) Forecast, by Application 2020 & 2033
- Table 42: Japan Pharmaceutical Contract Manufacture Organization Revenue (million) Forecast, by Application 2020 & 2033
- Table 43: South Korea Pharmaceutical Contract Manufacture Organization Revenue (million) Forecast, by Application 2020 & 2033
- Table 44: ASEAN Pharmaceutical Contract Manufacture Organization Revenue (million) Forecast, by Application 2020 & 2033
- Table 45: Oceania Pharmaceutical Contract Manufacture Organization Revenue (million) Forecast, by Application 2020 & 2033
- Table 46: Rest of Asia Pacific Pharmaceutical Contract Manufacture Organization Revenue (million) Forecast, by Application 2020 & 2033
Frequently Asked Questions
1. What is the projected Compound Annual Growth Rate (CAGR) of the Pharmaceutical Contract Manufacture Organization?
The projected CAGR is approximately XXX%.
2. Which companies are prominent players in the Pharmaceutical Contract Manufacture Organization?
Key companies in the market include Lonza, Boehringer Ingelheim, Catalent, Baxter, AbbVie, Pfizer, Evonik, Fareva group, Aenova, Almac, Delpharm, Recipharm, Aesica, NIPRO CORPORATION, Daito Pharmaceutical, Teva API, Esteve Quimica, Euticals, Zhejiang Hisun Pharmaceuticals.
3. What are the main segments of the Pharmaceutical Contract Manufacture Organization?
The market segments include Application, Type.
4. Can you provide details about the market size?
The market size is estimated to be USD XXX million as of 2022.
5. What are some drivers contributing to market growth?
N/A
6. What are the notable trends driving market growth?
N/A
7. Are there any restraints impacting market growth?
N/A
8. Can you provide examples of recent developments in the market?
N/A
9. What pricing options are available for accessing the report?
Pricing options include single-user, multi-user, and enterprise licenses priced at USD 3950.00, USD 5925.00, and USD 7900.00 respectively.
10. Is the market size provided in terms of value or volume?
The market size is provided in terms of value, measured in million.
11. Are there any specific market keywords associated with the report?
Yes, the market keyword associated with the report is "Pharmaceutical Contract Manufacture Organization," which aids in identifying and referencing the specific market segment covered.
12. How do I determine which pricing option suits my needs best?
The pricing options vary based on user requirements and access needs. Individual users may opt for single-user licenses, while businesses requiring broader access may choose multi-user or enterprise licenses for cost-effective access to the report.
13. Are there any additional resources or data provided in the Pharmaceutical Contract Manufacture Organization report?
While the report offers comprehensive insights, it's advisable to review the specific contents or supplementary materials provided to ascertain if additional resources or data are available.
14. How can I stay updated on further developments or reports in the Pharmaceutical Contract Manufacture Organization?
To stay informed about further developments, trends, and reports in the Pharmaceutical Contract Manufacture Organization, consider subscribing to industry newsletters, following relevant companies and organizations, or regularly checking reputable industry news sources and publications.
Methodology
Step 1 - Identification of Relevant Samples Size from Population Database


Step 2 - Approaches for Defining Global Market Size (Value, Volume* & Price*)

Note*: In applicable scenarios
Step 3 - Data Sources
Primary Research
- Web Analytics
- Survey Reports
- Research Institute
- Latest Research Reports
- Opinion Leaders
Secondary Research
- Annual Reports
- White Paper
- Latest Press Release
- Industry Association
- Paid Database
- Investor Presentations

Step 4 - Data Triangulation
Involves using different sources of information in order to increase the validity of a study
These sources are likely to be stakeholders in a program - participants, other researchers, program staff, other community members, and so on.
Then we put all data in single framework & apply various statistical tools to find out the dynamic on the market.
During the analysis stage, feedback from the stakeholder groups would be compared to determine areas of agreement as well as areas of divergence