

Key Insights
The portable filtration system market is experiencing robust growth, driven by increasing demand across diverse sectors like oil and gas, pulp and paper, and power generation. The market's expansion is fueled by stringent environmental regulations demanding cleaner processes, the rising need for efficient fluid management in remote locations, and the increasing adoption of portable filtration units for enhanced safety and operational efficiency. The market is segmented by end-user, with the oil and gas sector currently dominating due to the critical role of filtration in preventing equipment damage and ensuring operational continuity in challenging environments. However, growth is expected across all segments, driven by the increasing adoption of these systems in power generation for efficient water treatment and in the pulp and paper industry for improved process efficiency and reduced environmental impact. Technological advancements, such as the development of more efficient filter media and improved system designs, are further driving market growth. While initial investment costs can be a restraint, the long-term benefits of reduced maintenance, improved uptime, and environmental compliance outweigh the initial expenses, contributing to the overall market expansion. This growth is projected to continue steadily over the next decade, albeit at a moderate pace, given the relatively mature nature of the technology and the cyclical nature of some key end-user industries. Geographical expansion is also a key driver, with emerging economies in Asia-Pacific and South America showing significant growth potential due to increasing industrialization and infrastructure development.
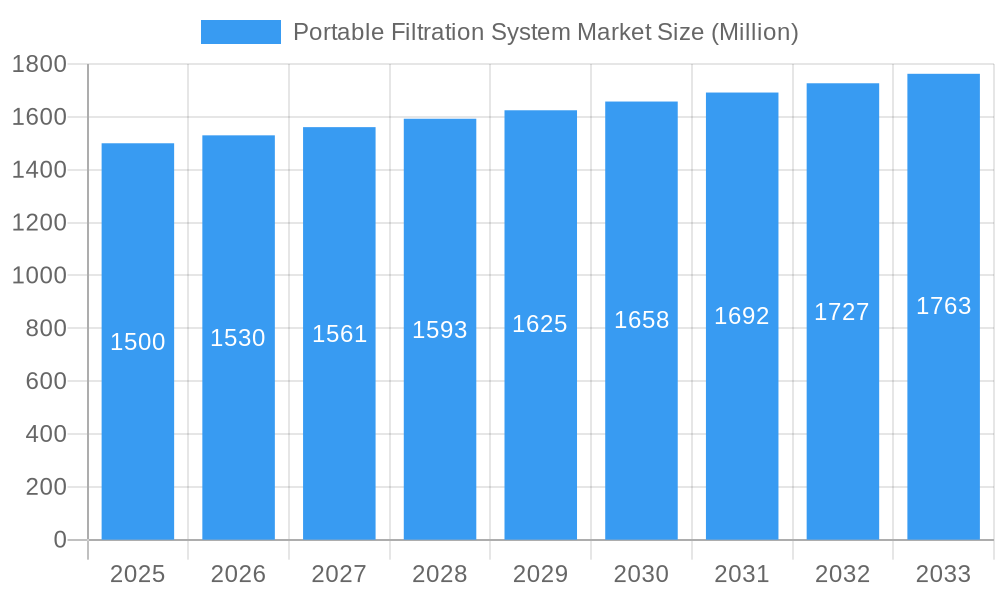
Portable Filtration System Market Market Size (In Billion)
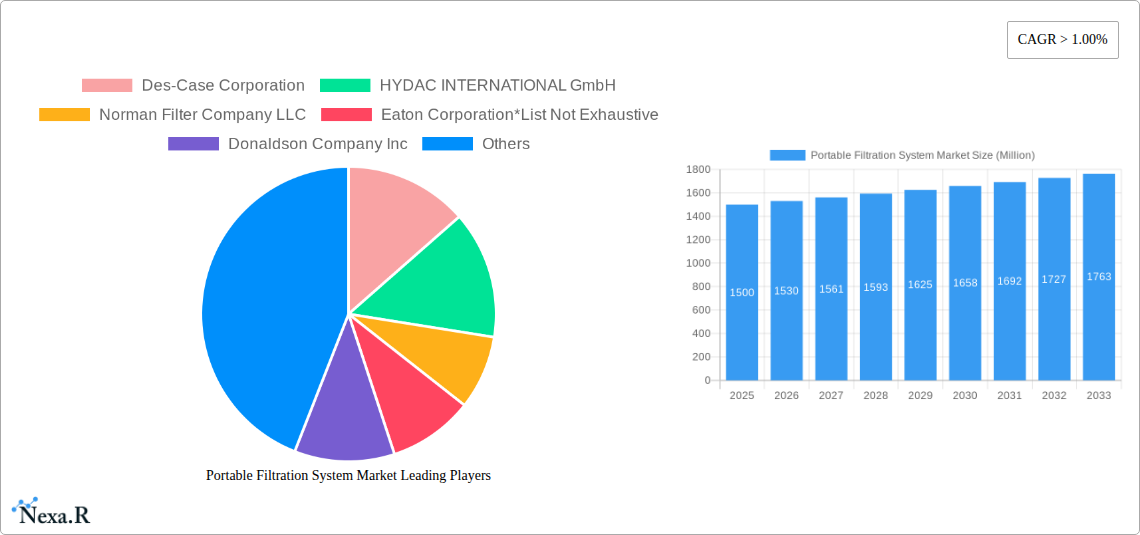
Competition in the portable filtration system market is intense, with numerous established players and emerging companies vying for market share. Key players, including Des-Case Corporation, HYDAC INTERNATIONAL GmbH, and Donaldson Company Inc., are focusing on product innovation, strategic partnerships, and geographical expansion to maintain their competitive edge. The market is characterized by a mix of large multinational corporations and specialized smaller companies catering to niche applications. The focus is shifting towards providing customized solutions tailored to specific customer needs and operational environments, resulting in a competitive landscape based on both technological differentiation and comprehensive service offerings. This competitive environment is expected to further stimulate innovation and drive down prices, ultimately benefiting end-users. The forecast period of 2025-2033 anticipates continued growth, albeit at a more moderate CAGR than previously observed, reflecting the market's maturation and the cyclical nature of certain end-user industries.
Portable Filtration System Market Company Market Share
Portable Filtration System Market: A Comprehensive Market Report (2019-2033)
This comprehensive report provides an in-depth analysis of the Portable Filtration System market, encompassing market dynamics, growth trends, regional dominance, product landscape, key players, and future outlook. The report covers the period from 2019 to 2033, with 2025 serving as the base and estimated year. The study segments the market by end-user (Pulp and Paper, Oil and Gas, Power Generation, Others) and provides valuable insights for industry professionals, investors, and strategic decision-makers. The total market size is projected to reach xx Million units by 2033.
Portable Filtration System Market Dynamics & Structure
The portable filtration system market is characterized by moderate concentration, with several key players holding significant market share. Technological innovation, driven by increasing demand for efficient and reliable filtration solutions across various industries, is a major growth driver. Stringent regulatory frameworks concerning environmental protection and workplace safety further influence market dynamics. Competitive pressures from substitute technologies, such as membrane filtration, are also present. The market is witnessing increased mergers and acquisitions (M&A) activity, as companies consolidate their market positions and expand their product portfolios.
- Market Concentration: Moderately concentrated, with top 5 players holding approximately xx% market share in 2025.
- Technological Innovation: Focus on developing smaller, lighter, and more efficient filtration systems, incorporating advanced materials and automation.
- Regulatory Landscape: Stringent environmental regulations driving demand for advanced filtration technologies.
- Competitive Substitutes: Membrane filtration and other advanced technologies posing competitive challenges.
- M&A Activity: xx M&A deals recorded in the past 5 years, with an average deal value of xx Million units.
- End-User Demographics: Significant growth driven by the Oil and Gas and Pulp & Paper sectors.
Portable Filtration System Market Growth Trends & Insights
The portable filtration system market has experienced steady growth over the historical period (2019-2024), with a CAGR of xx%. This growth is primarily attributed to increasing industrialization, rising environmental concerns, and the growing adoption of portable filtration systems across diverse industries. The market is expected to continue its growth trajectory during the forecast period (2025-2033), driven by technological advancements, expanding applications, and rising demand from emerging economies. The adoption rate is increasing at a CAGR of xx%, fueled by the advantages of portability, ease of use, and cost-effectiveness. Technological disruptions, such as the integration of IoT sensors for real-time monitoring, are further driving market growth. Shifting consumer behavior towards sustainable and environmentally friendly solutions is another significant factor. Market penetration is expected to reach xx% by 2033.
Dominant Regions, Countries, or Segments in Portable Filtration System Market
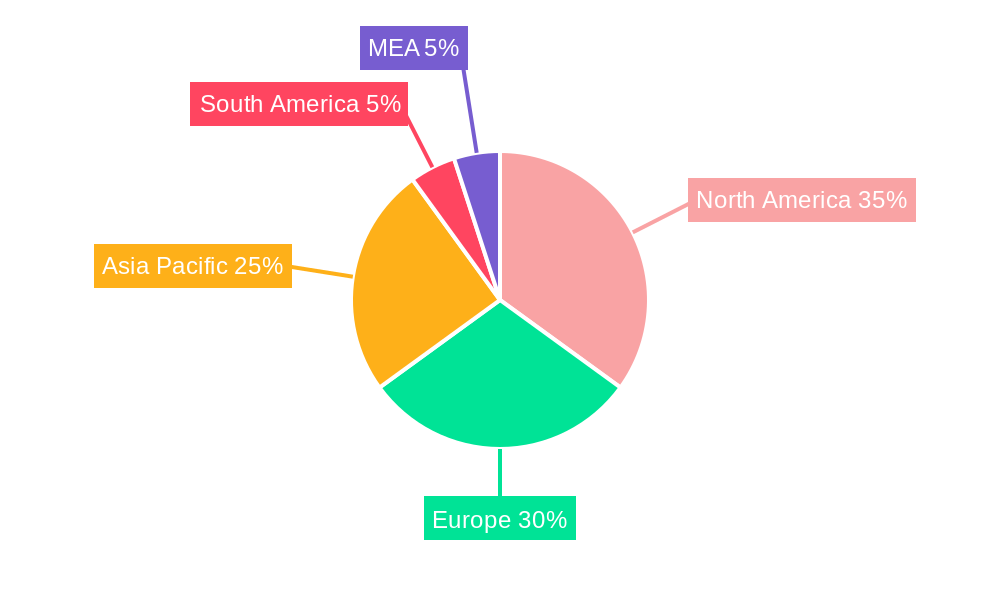
The Oil and Gas sector currently represents the largest segment of the portable filtration system market, holding approximately xx% market share in 2025. This dominance is primarily driven by the increasing need for efficient oil and gas extraction and processing, along with stringent environmental regulations. North America and Europe are the leading regions, with North America holding the largest market share due to extensive oil and gas activities and robust industrial infrastructure. The Asia-Pacific region is expected to exhibit significant growth in the forecast period, fueled by rapid industrialization and rising investments in infrastructure development.
- Key Drivers in Oil & Gas: Stringent environmental regulations, increasing demand for efficient oil & gas extraction, and advancements in exploration and production technologies.
- Key Drivers in North America: High industrial activity, robust infrastructure, and stringent environmental regulations.
- Key Drivers in Asia-Pacific: Rapid industrialization, increasing investments in infrastructure, and rising demand from emerging economies.
- Market Share: North America (xx%), Europe (xx%), Asia-Pacific (xx%), Rest of World (xx%) in 2025.
- Growth Potential: Asia-Pacific region is expected to show the highest growth rate during the forecast period.
Portable Filtration System Market Product Landscape
Portable filtration systems are available in a wide range of designs and capacities, catering to diverse applications and industries. Recent product innovations focus on improved filtration efficiency, reduced maintenance requirements, and enhanced portability. Key features include advanced filtration media, integrated monitoring systems, and compact designs. These advancements enhance the performance metrics, such as particle removal efficiency, flow rate, and operating life. Unique selling propositions (USPs) include ease of use, reduced downtime, and cost-effectiveness. Technological advancements are focusing on automated cleaning systems and smart connectivity features.
Key Drivers, Barriers & Challenges in Portable Filtration System Market
Key Drivers:
- Increasing demand for clean and safe industrial processes across multiple industries.
- Stringent environmental regulations and emission control standards.
- Growing awareness of the health risks associated with industrial pollutants.
- Technological advancements leading to enhanced filtration efficiency and portability.
Key Challenges and Restraints:
- High initial investment costs associated with purchasing and maintaining advanced systems.
- Fluctuations in raw material prices impacting manufacturing costs.
- Supply chain disruptions affecting the timely availability of components.
- Intense competition from established players and new entrants. This competition is leading to price pressure and reducing profit margins by an estimated xx% in 2025 compared to 2019.
Emerging Opportunities in Portable Filtration System Market
- Untapped Markets: Expansion into emerging economies with growing industrial sectors.
- Innovative Applications: Development of specialized systems for specific industrial applications, such as wastewater treatment and pharmaceutical manufacturing.
- Evolving Consumer Preferences: Demand for eco-friendly and sustainable filtration solutions.
Growth Accelerators in the Portable Filtration System Market Industry
Technological breakthroughs in filtration media and system design are key catalysts for long-term growth. Strategic partnerships and collaborations between manufacturers and end-users are fostering innovation and market expansion. Government incentives and subsidies promoting the adoption of advanced filtration technologies are driving further market growth. Expansion into new geographical markets and diversification of product offerings are also accelerating market growth.
Key Players Shaping the Portable Filtration System Market Market
- Des-Case Corporation
- HYDAC INTERNATIONAL GmbH
- Norman Filter Company LLC
- Eaton Corporation
- Donaldson Company Inc
- MP Filtri S p A
- Bosch Rexroth AG
- Pall Corporation
- Trico Corporation
- Parker Hannifin Corp
Notable Milestones in Portable Filtration System Market Sector
- 2020: Introduction of a new line of portable filtration systems with integrated IoT sensors by Pall Corporation.
- 2022: Merger between two leading manufacturers, resulting in increased market share and product diversification.
- 2023: Launch of a new generation of high-efficiency filtration media by Donaldson Company Inc.
In-Depth Portable Filtration System Market Market Outlook
The portable filtration system market is poised for continued growth, driven by technological advancements, expanding applications, and increasing demand from various industries. Strategic opportunities exist for companies to expand into new geographical markets, develop innovative products, and establish strategic partnerships. The long-term outlook remains positive, with substantial growth potential in both established and emerging markets.
Portable Filtration System Market Segmentation
-
1. End-User
- 1.1. Pulp and Paper
- 1.2. Oil and Gas
- 1.3. Power Generation
- 1.4. Others
Portable Filtration System Market Segmentation By Geography
- 1. North America
- 2. South America
- 3. Europe
- 4. Asia Pacific
- 5. Middle East and Africa
Portable Filtration System Market Regional Market Share
Geographic Coverage of Portable Filtration System Market
Portable Filtration System Market REPORT HIGHLIGHTS
| Aspects | Details |
|---|---|
| Study Period | 2020-2034 |
| Base Year | 2025 |
| Estimated Year | 2026 |
| Forecast Period | 2026-2034 |
| Historical Period | 2020-2025 |
| Growth Rate | CAGR of > 1.00% from 2020-2034 |
| Segmentation |
|
Table of Contents
- 1. Introduction
- 1.1. Research Scope
- 1.2. Market Segmentation
- 1.3. Research Objective
- 1.4. Definitions and Assumptions
- 2. Executive Summary
- 2.1. Market Snapshot
- 3. Market Dynamics
- 3.1. Market Drivers
- 3.2. Market Restrains
- 3.3. Market Trends
- 3.4. Market Opportunities
- 4. Market Factor Analysis
- 4.1. Porters Five Forces
- 4.1.1. Bargaining Power of Suppliers
- 4.1.2. Bargaining Power of Buyers
- 4.1.3. Threat of New Entrants
- 4.1.4. Threat of Substitutes
- 4.1.5. Competitive Rivalry
- 4.2. PESTEL analysis
- 4.3. BCG Analysis
- 4.3.1. Stars (High Growth, High Market Share)
- 4.3.2. Cash Cows (Low Growth, High Market Share)
- 4.3.3. Question Mark (High Growth, Low Market Share)
- 4.3.4. Dogs (Low Growth, Low Market Share)
- 4.4. Ansoff Matrix Analysis
- 4.5. Supply Chain Analysis
- 4.6. Regulatory Landscape
- 4.7. Current Market Potential and Opportunity Assessment (TAM–SAM–SOM Framework)
- 4.8. NRP Analyst Note
- 4.1. Porters Five Forces
- 5. Market Analysis, Insights and Forecast 2021-2033
- 5.1. Market Analysis, Insights and Forecast - by End-User
- 5.1.1. Pulp and Paper
- 5.1.2. Oil and Gas
- 5.1.3. Power Generation
- 5.1.4. Others
- 5.2. Market Analysis, Insights and Forecast - by Region
- 5.2.1. North America
- 5.2.2. South America
- 5.2.3. Europe
- 5.2.4. Asia Pacific
- 5.2.5. Middle East and Africa
- 5.1. Market Analysis, Insights and Forecast - by End-User
- 6. Global Portable Filtration System Market Analysis, Insights and Forecast, 2021-2033
- 6.1. Market Analysis, Insights and Forecast - by End-User
- 6.1.1. Pulp and Paper
- 6.1.2. Oil and Gas
- 6.1.3. Power Generation
- 6.1.4. Others
- 6.1. Market Analysis, Insights and Forecast - by End-User
- 7. North America Portable Filtration System Market Analysis, Insights and Forecast, 2020-2032
- 7.1. Market Analysis, Insights and Forecast - by End-User
- 7.1.1. Pulp and Paper
- 7.1.2. Oil and Gas
- 7.1.3. Power Generation
- 7.1.4. Others
- 7.1. Market Analysis, Insights and Forecast - by End-User
- 8. South America Portable Filtration System Market Analysis, Insights and Forecast, 2020-2032
- 8.1. Market Analysis, Insights and Forecast - by End-User
- 8.1.1. Pulp and Paper
- 8.1.2. Oil and Gas
- 8.1.3. Power Generation
- 8.1.4. Others
- 8.1. Market Analysis, Insights and Forecast - by End-User
- 9. Europe Portable Filtration System Market Analysis, Insights and Forecast, 2020-2032
- 9.1. Market Analysis, Insights and Forecast - by End-User
- 9.1.1. Pulp and Paper
- 9.1.2. Oil and Gas
- 9.1.3. Power Generation
- 9.1.4. Others
- 9.1. Market Analysis, Insights and Forecast - by End-User
- 10. Asia Pacific Portable Filtration System Market Analysis, Insights and Forecast, 2020-2032
- 10.1. Market Analysis, Insights and Forecast - by End-User
- 10.1.1. Pulp and Paper
- 10.1.2. Oil and Gas
- 10.1.3. Power Generation
- 10.1.4. Others
- 10.1. Market Analysis, Insights and Forecast - by End-User
- 11. Middle East and Africa Portable Filtration System Market Analysis, Insights and Forecast, 2020-2032
- 11.1. Market Analysis, Insights and Forecast - by End-User
- 11.1.1. Pulp and Paper
- 11.1.2. Oil and Gas
- 11.1.3. Power Generation
- 11.1.4. Others
- 11.1. Market Analysis, Insights and Forecast - by End-User
- 12. Competitive Analysis
- 12.1. Company Profiles
- 12.1.1 Des-Case Corporation
- 12.1.1.1. Company Overview
- 12.1.1.2. Products
- 12.1.1.3. Company Financials
- 12.1.1.4. SWOT Analysis
- 12.1.2 HYDAC INTERNATIONAL GmbH
- 12.1.2.1. Company Overview
- 12.1.2.2. Products
- 12.1.2.3. Company Financials
- 12.1.2.4. SWOT Analysis
- 12.1.3 Norman Filter Company LLC
- 12.1.3.1. Company Overview
- 12.1.3.2. Products
- 12.1.3.3. Company Financials
- 12.1.3.4. SWOT Analysis
- 12.1.4 Eaton Corporation*List Not Exhaustive
- 12.1.4.1. Company Overview
- 12.1.4.2. Products
- 12.1.4.3. Company Financials
- 12.1.4.4. SWOT Analysis
- 12.1.5 Donaldson Company Inc
- 12.1.5.1. Company Overview
- 12.1.5.2. Products
- 12.1.5.3. Company Financials
- 12.1.5.4. SWOT Analysis
- 12.1.6 MP Filtri S p A
- 12.1.6.1. Company Overview
- 12.1.6.2. Products
- 12.1.6.3. Company Financials
- 12.1.6.4. SWOT Analysis
- 12.1.7 Bosch Rexroth AG
- 12.1.7.1. Company Overview
- 12.1.7.2. Products
- 12.1.7.3. Company Financials
- 12.1.7.4. SWOT Analysis
- 12.1.8 Pall Corporation
- 12.1.8.1. Company Overview
- 12.1.8.2. Products
- 12.1.8.3. Company Financials
- 12.1.8.4. SWOT Analysis
- 12.1.9 Trico Corporation
- 12.1.9.1. Company Overview
- 12.1.9.2. Products
- 12.1.9.3. Company Financials
- 12.1.9.4. SWOT Analysis
- 12.1.10 Parker Hannifin Corp
- 12.1.10.1. Company Overview
- 12.1.10.2. Products
- 12.1.10.3. Company Financials
- 12.1.10.4. SWOT Analysis
- 12.1.1 Des-Case Corporation
- 12.2. Market Entropy
- 12.2.1 Company's Key Areas Served
- 12.2.2 Recent Developments
- 12.3. Company Market Share Analysis 2025
- 12.3.1 Top 5 Companies Market Share Analysis
- 12.3.2 Top 3 Companies Market Share Analysis
- 12.4. List of Potential Customers
- 13. Research Methodology
List of Figures
- Figure 1: Global Portable Filtration System Market Revenue Breakdown (Million, %) by Region 2025 & 2033
- Figure 2: North America Portable Filtration System Market Revenue (Million), by End-User 2025 & 2033
- Figure 3: North America Portable Filtration System Market Revenue Share (%), by End-User 2025 & 2033
- Figure 4: North America Portable Filtration System Market Revenue (Million), by Country 2025 & 2033
- Figure 5: North America Portable Filtration System Market Revenue Share (%), by Country 2025 & 2033
- Figure 6: South America Portable Filtration System Market Revenue (Million), by End-User 2025 & 2033
- Figure 7: South America Portable Filtration System Market Revenue Share (%), by End-User 2025 & 2033
- Figure 8: South America Portable Filtration System Market Revenue (Million), by Country 2025 & 2033
- Figure 9: South America Portable Filtration System Market Revenue Share (%), by Country 2025 & 2033
- Figure 10: Europe Portable Filtration System Market Revenue (Million), by End-User 2025 & 2033
- Figure 11: Europe Portable Filtration System Market Revenue Share (%), by End-User 2025 & 2033
- Figure 12: Europe Portable Filtration System Market Revenue (Million), by Country 2025 & 2033
- Figure 13: Europe Portable Filtration System Market Revenue Share (%), by Country 2025 & 2033
- Figure 14: Asia Pacific Portable Filtration System Market Revenue (Million), by End-User 2025 & 2033
- Figure 15: Asia Pacific Portable Filtration System Market Revenue Share (%), by End-User 2025 & 2033
- Figure 16: Asia Pacific Portable Filtration System Market Revenue (Million), by Country 2025 & 2033
- Figure 17: Asia Pacific Portable Filtration System Market Revenue Share (%), by Country 2025 & 2033
- Figure 18: Middle East and Africa Portable Filtration System Market Revenue (Million), by End-User 2025 & 2033
- Figure 19: Middle East and Africa Portable Filtration System Market Revenue Share (%), by End-User 2025 & 2033
- Figure 20: Middle East and Africa Portable Filtration System Market Revenue (Million), by Country 2025 & 2033
- Figure 21: Middle East and Africa Portable Filtration System Market Revenue Share (%), by Country 2025 & 2033
List of Tables
- Table 1: Global Portable Filtration System Market Revenue Million Forecast, by End-User 2020 & 2033
- Table 2: Global Portable Filtration System Market Revenue Million Forecast, by Region 2020 & 2033
- Table 3: Global Portable Filtration System Market Revenue Million Forecast, by End-User 2020 & 2033
- Table 4: Global Portable Filtration System Market Revenue Million Forecast, by Country 2020 & 2033
- Table 5: Global Portable Filtration System Market Revenue Million Forecast, by End-User 2020 & 2033
- Table 6: Global Portable Filtration System Market Revenue Million Forecast, by Country 2020 & 2033
- Table 7: Global Portable Filtration System Market Revenue Million Forecast, by End-User 2020 & 2033
- Table 8: Global Portable Filtration System Market Revenue Million Forecast, by Country 2020 & 2033
- Table 9: Global Portable Filtration System Market Revenue Million Forecast, by End-User 2020 & 2033
- Table 10: Global Portable Filtration System Market Revenue Million Forecast, by Country 2020 & 2033
- Table 11: Global Portable Filtration System Market Revenue Million Forecast, by End-User 2020 & 2033
- Table 12: Global Portable Filtration System Market Revenue Million Forecast, by Country 2020 & 2033
Frequently Asked Questions
1. What is the projected Compound Annual Growth Rate (CAGR) of the Portable Filtration System Market?
The projected CAGR is approximately > 1.00%.
2. Which companies are prominent players in the Portable Filtration System Market?
Key companies in the market include Des-Case Corporation, HYDAC INTERNATIONAL GmbH, Norman Filter Company LLC, Eaton Corporation*List Not Exhaustive, Donaldson Company Inc, MP Filtri S p A, Bosch Rexroth AG, Pall Corporation, Trico Corporation, Parker Hannifin Corp.
3. What are the main segments of the Portable Filtration System Market?
The market segments include End-User.
4. Can you provide details about the market size?
The market size is estimated to be USD XX Million as of 2022.
5. What are some drivers contributing to market growth?
4.; Increasing Adoption Of Battery-Powered Power Tools4.; Rapidly Growing Automotive Industry.
6. What are the notable trends driving market growth?
Oil and Gas Industry to be a Significant Segment.
7. Are there any restraints impacting market growth?
4.; High Cost Associated With Cordless Power Tool Equipment.
8. Can you provide examples of recent developments in the market?
N/A
9. What pricing options are available for accessing the report?
Pricing options include single-user, multi-user, and enterprise licenses priced at USD 4750, USD 5250, and USD 8750 respectively.
10. Is the market size provided in terms of value or volume?
The market size is provided in terms of value, measured in Million.
11. Are there any specific market keywords associated with the report?
Yes, the market keyword associated with the report is "Portable Filtration System Market," which aids in identifying and referencing the specific market segment covered.
12. How do I determine which pricing option suits my needs best?
The pricing options vary based on user requirements and access needs. Individual users may opt for single-user licenses, while businesses requiring broader access may choose multi-user or enterprise licenses for cost-effective access to the report.
13. Are there any additional resources or data provided in the Portable Filtration System Market report?
While the report offers comprehensive insights, it's advisable to review the specific contents or supplementary materials provided to ascertain if additional resources or data are available.
14. How can I stay updated on further developments or reports in the Portable Filtration System Market?
To stay informed about further developments, trends, and reports in the Portable Filtration System Market, consider subscribing to industry newsletters, following relevant companies and organizations, or regularly checking reputable industry news sources and publications.
Methodology
Step 1 - Identification of Relevant Samples Size from Population Database


Step 2 - Approaches for Defining Global Market Size (Value, Volume* & Price*)

Note*: In applicable scenarios
Step 3 - Data Sources
Primary Research
- Web Analytics
- Survey Reports
- Research Institute
- Latest Research Reports
- Opinion Leaders
Secondary Research
- Annual Reports
- White Paper
- Latest Press Release
- Industry Association
- Paid Database
- Investor Presentations

Step 4 - Data Triangulation
Involves using different sources of information in order to increase the validity of a study
These sources are likely to be stakeholders in a program - participants, other researchers, program staff, other community members, and so on.
Then we put all data in single framework & apply various statistical tools to find out the dynamic on the market.
During the analysis stage, feedback from the stakeholder groups would be compared to determine areas of agreement as well as areas of divergence