

Key Insights
The global Positive Displacement Pumps market is poised for significant expansion, projecting a Compound Annual Growth Rate (CAGR) of 4.42% from 2025 to 2033. This robust growth is propelled by escalating demand for efficient fluid handling across key sectors such as oil & gas, power generation, and water & wastewater treatment. Technological innovations enhancing pump durability, efficiency, and precision are further accelerating market penetration. The widespread integration of automation and smart technologies within industrial processes also contributes to market dynamism by enabling superior monitoring and control of pumping systems. Furthermore, evolving environmental regulations mandating reduced emissions and optimized resource utilization are driving the adoption of energy-efficient positive displacement pump solutions.
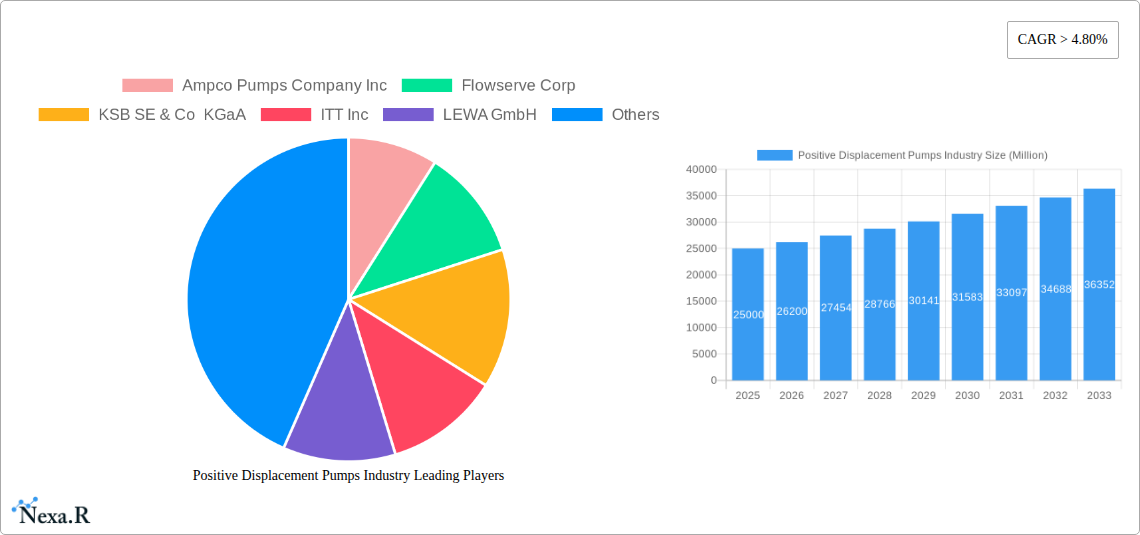
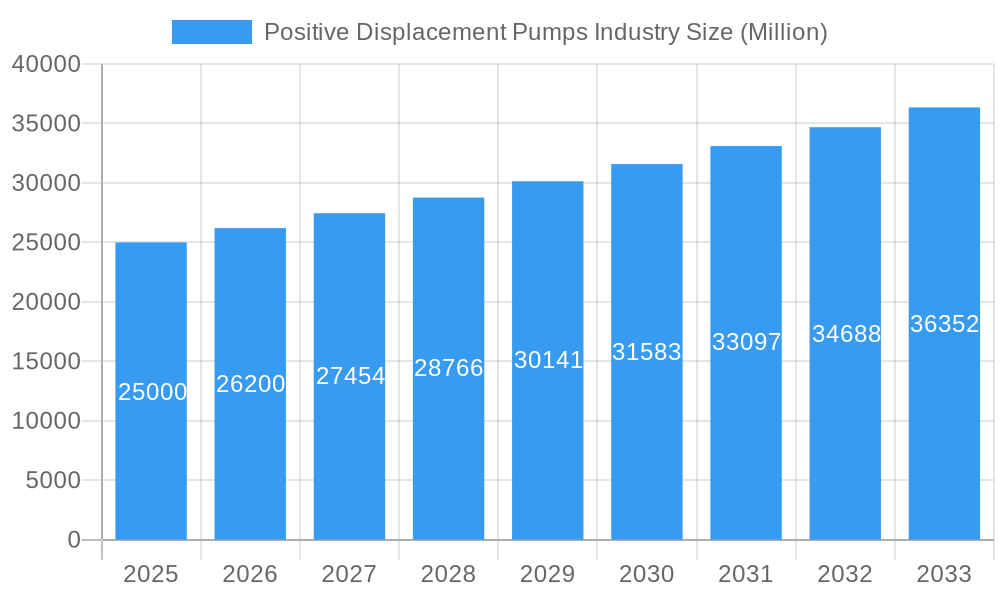
Positive Displacement Pumps Industry Market Size (In Billion)
Market segmentation highlights substantial growth avenues. Reciprocating and rotary pump segments command significant market presence, supported by continuous innovation. Geographically, North America and Europe currently lead market share, with the Asia-Pacific region anticipated to experience the most rapid growth due to accelerated industrialization and infrastructure development. Leading companies, including Ampco Pumps Company Inc, Flowserve Corp, and KSB SE & Co KGaA, are actively engaged in product innovation, strategic alliances, and mergers & acquisitions to solidify their market standing and seize emerging opportunities. Despite potential challenges like raw material price volatility and supply chain uncertainties, the outlook for the Positive Displacement Pumps market remains exceptionally strong throughout the forecast period. This upward trajectory is sustained by ongoing global infrastructure investments and the increasing recognition of efficient fluid handling's critical role across diverse industries.
Positive Displacement Pumps Industry Company Market Share
Positive Displacement Pumps Industry Market Report: 2019-2033
This comprehensive report provides a detailed analysis of the Positive Displacement Pumps market, encompassing historical data (2019-2024), current estimates (2025), and future projections (2025-2033). The study covers key market segments, including reciprocating and rotary pumps, across diverse end-user industries such as oil and gas, power generation, water and wastewater treatment, chemicals, and others. The report features in-depth analysis of market dynamics, growth trends, regional performance, competitive landscape, and emerging opportunities, offering invaluable insights for industry professionals, investors, and strategic decision-makers. Market values are presented in million units.
Positive Displacement Pumps Industry Market Dynamics & Structure
The Positive Displacement Pumps market is characterized by a moderately concentrated landscape, with several major players holding significant market share. Technological innovation, driven by the need for enhanced efficiency, durability, and precision, is a key market driver. Stringent environmental regulations and evolving safety standards also shape market dynamics. Competitive pressures from substitute technologies exist, albeit limited, particularly in niche applications. Mergers and acquisitions (M&A) activity, as seen in the recent acquisition of LEWA GmbH by Atlas Copco, indicates market consolidation and strategic expansion by key players. End-user demographics are significantly influenced by the growth of the oil and gas, chemical, and water treatment sectors.
- Market Concentration: Moderately concentrated, with top 10 players holding approximately xx% market share in 2025.
- Technological Innovation: Focus on energy efficiency, improved materials, and smart functionalities.
- Regulatory Framework: Stringent environmental regulations driving demand for eco-friendly pumps.
- Competitive Substitutes: Limited, but centrifugal pumps pose competition in certain applications.
- M&A Activity: Significant M&A activity observed in recent years, with xx deals recorded between 2019-2024. (e.g., Atlas Copco’s acquisition of LEWA).
- Innovation Barriers: High R&D investment, stringent testing and certification requirements.
Positive Displacement Pumps Industry Growth Trends & Insights
The global positive displacement pumps market exhibited steady growth during the historical period (2019-2024), driven by increasing demand from various end-user industries. The market is projected to maintain a robust CAGR of xx% during the forecast period (2025-2033), reaching a market size of xx million units by 2033. This growth is attributed to factors such as expanding infrastructure development, particularly in emerging economies, growing demand for efficient fluid handling solutions in diverse industries, and technological advancements leading to the development of more efficient and durable pumps. The adoption rate of technologically advanced pumps, particularly those with smart features and improved energy efficiency, is also on the rise. Consumer behavior is shifting towards eco-friendly and cost-effective solutions.
Dominant Regions, Countries, or Segments in Positive Displacement Pumps Industry
The North American and European regions currently dominate the positive displacement pumps market, owing to well-established industries and robust infrastructure. However, the Asia-Pacific region is projected to witness the fastest growth during the forecast period, driven by rapid industrialization, infrastructure development, and increasing demand from various sectors. Within product types, rotary pumps currently hold a larger market share than reciprocating pumps, though both segments are experiencing significant growth. The oil and gas sector remains the largest end-user industry for positive displacement pumps, followed by the chemical and water & wastewater sectors.
- Key Drivers for Growth in Asia-Pacific: Rapid industrialization, rising disposable incomes, government investment in infrastructure projects.
- Dominant Segment: Rotary pumps hold the largest market share due to their versatility and adaptability to various applications.
- Dominant End-User Industry: Oil and Gas, due to high volume requirements and specific fluid handling needs.
- Regional Dominance: North America and Europe currently lead in terms of market size, while Asia-Pacific exhibits the highest growth potential.
Positive Displacement Pumps Industry Product Landscape
Positive displacement pumps are experiencing significant innovation, with advancements in materials science, design, and control systems leading to the development of more efficient, durable, and precise pumps. New materials like thermoplastic polymer composites offer improved corrosion resistance and longevity. Smart pumps with integrated sensors and data analytics capabilities are gaining popularity, enabling predictive maintenance and optimized performance. These innovations are driven by the demand for increased efficiency, reduced downtime, and lower operating costs. Unique selling propositions include improved energy efficiency, reduced maintenance needs, and enhanced precision in fluid handling.
Key Drivers, Barriers & Challenges in Positive Displacement Pumps Industry
Key Drivers: Growing demand from end-user industries (oil & gas, water treatment), increasing investments in infrastructure projects globally, technological advancements leading to higher efficiency and reliability, stringent environmental regulations promoting the adoption of energy-efficient pumps.
Key Barriers & Challenges: High initial investment costs associated with advanced pumps, complex supply chains susceptible to disruptions, intense competition, stringent regulatory compliance requirements leading to increased costs. Fluctuations in raw material prices also impact profitability. For example, a 10% increase in raw material costs could lead to a xx% reduction in profit margins.
Emerging Opportunities in Positive Displacement Pumps Industry
Emerging opportunities exist in the development of specialized pumps for niche applications, such as those used in biomedical engineering or microfluidics. The rising demand for sustainable and eco-friendly pumps, utilizing renewable energy sources, presents a significant opportunity. Furthermore, growth in developing economies presents untapped markets with potential for substantial expansion. The integration of digital technologies, like IoT and AI, into pump systems for predictive maintenance and optimized operation will further drive growth.
Growth Accelerators in the Positive Displacement Pumps Industry Industry
Strategic partnerships and collaborations between pump manufacturers and technology providers are accelerating innovation and market expansion. The development of advanced materials and manufacturing techniques is leading to more robust and efficient pumps. Investment in R&D is driving the development of next-generation pumps with improved performance metrics. The adoption of Industry 4.0 principles, integrating automation and data analytics into production processes and supply chains, boosts efficiency and competitiveness.
Key Players Shaping the Positive Displacement Pumps Industry Market
- Ampco Pumps Company Inc
- Flowserve Corp
- KSB SE & Co KGaA
- ITT Inc
- LEWA GmbH
- SPX Flow Inc
- NETZSCH Holding
- Xylem Inc
- Sulzer AG
- Pentair PLC
Notable Milestones in Positive Displacement Pumps Industry Sector
- March 2022: Atlas Copco acquires LEWA GmbH, strengthening its position in the positive displacement pump market.
- May 2021: CDI Energy Products launches a new thermoplastic polymer composite material for pump applications, enhancing durability and performance.
In-Depth Positive Displacement Pumps Industry Market Outlook
The future of the positive displacement pumps market looks promising, driven by continued technological innovation, expanding end-user industries, and increasing infrastructure development globally. Strategic partnerships, investments in R&D, and the adoption of sustainable practices will further propel market growth. Companies focusing on developing energy-efficient, smart, and specialized pumps will capture significant market share. The market's long-term potential is substantial, with opportunities for growth across all major segments and regions.
Positive Displacement Pumps Industry Segmentation
-
1. Type
- 1.1. Reciprocating
- 1.2. Rotary
-
2. End-user Industry
- 2.1. Oil and Gas
- 2.2. Power Generation
- 2.3. Water and Wastewater
- 2.4. Chemical
- 2.5. Other End-user Industries
Positive Displacement Pumps Industry Segmentation By Geography
- 1. North America
- 2. Europe
- 3. Asia Pacific
- 4. South America
- 5. Middle East
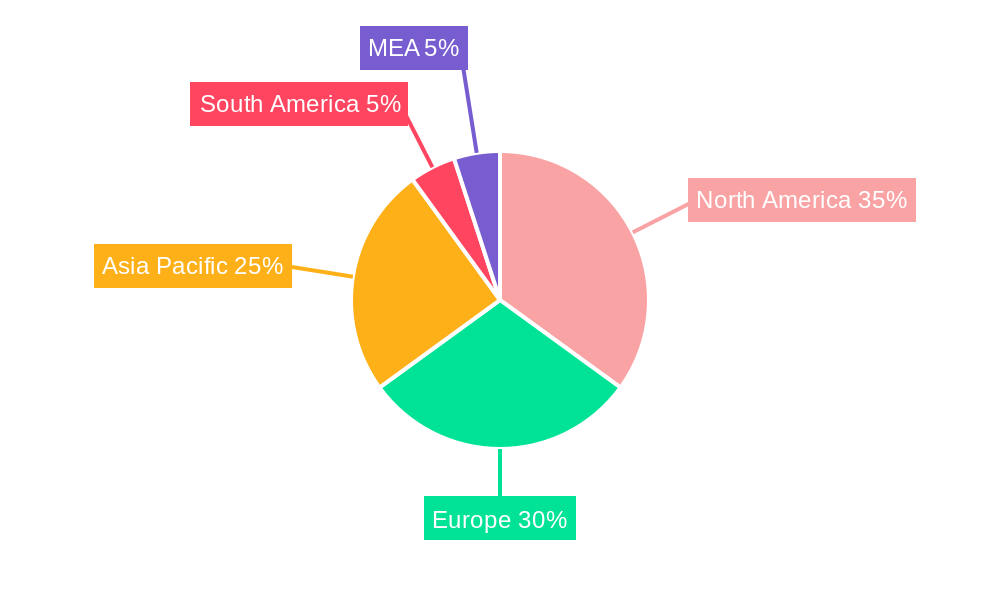
Positive Displacement Pumps Industry Regional Market Share
Geographic Coverage of Positive Displacement Pumps Industry
Positive Displacement Pumps Industry REPORT HIGHLIGHTS
| Aspects | Details |
|---|---|
| Study Period | 2020-2034 |
| Base Year | 2025 |
| Estimated Year | 2026 |
| Forecast Period | 2026-2034 |
| Historical Period | 2020-2025 |
| Growth Rate | CAGR of 4.42% from 2020-2034 |
| Segmentation |
|
Table of Contents
- 1. Introduction
- 1.1. Research Scope
- 1.2. Market Segmentation
- 1.3. Research Objective
- 1.4. Definitions and Assumptions
- 2. Executive Summary
- 2.1. Market Snapshot
- 3. Market Dynamics
- 3.1. Market Drivers
- 3.2. Market Restrains
- 3.3. Market Trends
- 3.4. Market Opportunities
- 4. Market Factor Analysis
- 4.1. Porters Five Forces
- 4.1.1. Bargaining Power of Suppliers
- 4.1.2. Bargaining Power of Buyers
- 4.1.3. Threat of New Entrants
- 4.1.4. Threat of Substitutes
- 4.1.5. Competitive Rivalry
- 4.2. PESTEL analysis
- 4.3. BCG Analysis
- 4.3.1. Stars (High Growth, High Market Share)
- 4.3.2. Cash Cows (Low Growth, High Market Share)
- 4.3.3. Question Mark (High Growth, Low Market Share)
- 4.3.4. Dogs (Low Growth, Low Market Share)
- 4.4. Ansoff Matrix Analysis
- 4.5. Supply Chain Analysis
- 4.6. Regulatory Landscape
- 4.7. Current Market Potential and Opportunity Assessment (TAM–SAM–SOM Framework)
- 4.8. NRP Analyst Note
- 4.1. Porters Five Forces
- 5. Market Analysis, Insights and Forecast 2021-2033
- 5.1. Market Analysis, Insights and Forecast - by Type
- 5.1.1. Reciprocating
- 5.1.2. Rotary
- 5.2. Market Analysis, Insights and Forecast - by End-user Industry
- 5.2.1. Oil and Gas
- 5.2.2. Power Generation
- 5.2.3. Water and Wastewater
- 5.2.4. Chemical
- 5.2.5. Other End-user Industries
- 5.3. Market Analysis, Insights and Forecast - by Region
- 5.3.1. North America
- 5.3.2. Europe
- 5.3.3. Asia Pacific
- 5.3.4. South America
- 5.3.5. Middle East
- 5.1. Market Analysis, Insights and Forecast - by Type
- 6. Global Positive Displacement Pumps Industry Analysis, Insights and Forecast, 2021-2033
- 6.1. Market Analysis, Insights and Forecast - by Type
- 6.1.1. Reciprocating
- 6.1.2. Rotary
- 6.2. Market Analysis, Insights and Forecast - by End-user Industry
- 6.2.1. Oil and Gas
- 6.2.2. Power Generation
- 6.2.3. Water and Wastewater
- 6.2.4. Chemical
- 6.2.5. Other End-user Industries
- 6.1. Market Analysis, Insights and Forecast - by Type
- 7. North America Positive Displacement Pumps Industry Analysis, Insights and Forecast, 2020-2032
- 7.1. Market Analysis, Insights and Forecast - by Type
- 7.1.1. Reciprocating
- 7.1.2. Rotary
- 7.2. Market Analysis, Insights and Forecast - by End-user Industry
- 7.2.1. Oil and Gas
- 7.2.2. Power Generation
- 7.2.3. Water and Wastewater
- 7.2.4. Chemical
- 7.2.5. Other End-user Industries
- 7.1. Market Analysis, Insights and Forecast - by Type
- 8. Europe Positive Displacement Pumps Industry Analysis, Insights and Forecast, 2020-2032
- 8.1. Market Analysis, Insights and Forecast - by Type
- 8.1.1. Reciprocating
- 8.1.2. Rotary
- 8.2. Market Analysis, Insights and Forecast - by End-user Industry
- 8.2.1. Oil and Gas
- 8.2.2. Power Generation
- 8.2.3. Water and Wastewater
- 8.2.4. Chemical
- 8.2.5. Other End-user Industries
- 8.1. Market Analysis, Insights and Forecast - by Type
- 9. Asia Pacific Positive Displacement Pumps Industry Analysis, Insights and Forecast, 2020-2032
- 9.1. Market Analysis, Insights and Forecast - by Type
- 9.1.1. Reciprocating
- 9.1.2. Rotary
- 9.2. Market Analysis, Insights and Forecast - by End-user Industry
- 9.2.1. Oil and Gas
- 9.2.2. Power Generation
- 9.2.3. Water and Wastewater
- 9.2.4. Chemical
- 9.2.5. Other End-user Industries
- 9.1. Market Analysis, Insights and Forecast - by Type
- 10. South America Positive Displacement Pumps Industry Analysis, Insights and Forecast, 2020-2032
- 10.1. Market Analysis, Insights and Forecast - by Type
- 10.1.1. Reciprocating
- 10.1.2. Rotary
- 10.2. Market Analysis, Insights and Forecast - by End-user Industry
- 10.2.1. Oil and Gas
- 10.2.2. Power Generation
- 10.2.3. Water and Wastewater
- 10.2.4. Chemical
- 10.2.5. Other End-user Industries
- 10.1. Market Analysis, Insights and Forecast - by Type
- 11. Middle East Positive Displacement Pumps Industry Analysis, Insights and Forecast, 2020-2032
- 11.1. Market Analysis, Insights and Forecast - by Type
- 11.1.1. Reciprocating
- 11.1.2. Rotary
- 11.2. Market Analysis, Insights and Forecast - by End-user Industry
- 11.2.1. Oil and Gas
- 11.2.2. Power Generation
- 11.2.3. Water and Wastewater
- 11.2.4. Chemical
- 11.2.5. Other End-user Industries
- 11.1. Market Analysis, Insights and Forecast - by Type
- 12. Competitive Analysis
- 12.1. Company Profiles
- 12.1.1 Ampco Pumps Company Inc
- 12.1.1.1. Company Overview
- 12.1.1.2. Products
- 12.1.1.3. Company Financials
- 12.1.1.4. SWOT Analysis
- 12.1.2 Flowserve Corp
- 12.1.2.1. Company Overview
- 12.1.2.2. Products
- 12.1.2.3. Company Financials
- 12.1.2.4. SWOT Analysis
- 12.1.3 KSB SE & Co KGaA
- 12.1.3.1. Company Overview
- 12.1.3.2. Products
- 12.1.3.3. Company Financials
- 12.1.3.4. SWOT Analysis
- 12.1.4 ITT Inc
- 12.1.4.1. Company Overview
- 12.1.4.2. Products
- 12.1.4.3. Company Financials
- 12.1.4.4. SWOT Analysis
- 12.1.5 LEWA GmbH
- 12.1.5.1. Company Overview
- 12.1.5.2. Products
- 12.1.5.3. Company Financials
- 12.1.5.4. SWOT Analysis
- 12.1.6 SPX Flow Inc
- 12.1.6.1. Company Overview
- 12.1.6.2. Products
- 12.1.6.3. Company Financials
- 12.1.6.4. SWOT Analysis
- 12.1.7 NETZSCH Holding
- 12.1.7.1. Company Overview
- 12.1.7.2. Products
- 12.1.7.3. Company Financials
- 12.1.7.4. SWOT Analysis
- 12.1.8 Xylem Inc *List Not Exhaustive
- 12.1.8.1. Company Overview
- 12.1.8.2. Products
- 12.1.8.3. Company Financials
- 12.1.8.4. SWOT Analysis
- 12.1.9 Sulzer AG
- 12.1.9.1. Company Overview
- 12.1.9.2. Products
- 12.1.9.3. Company Financials
- 12.1.9.4. SWOT Analysis
- 12.1.10 Pentair PLC
- 12.1.10.1. Company Overview
- 12.1.10.2. Products
- 12.1.10.3. Company Financials
- 12.1.10.4. SWOT Analysis
- 12.1.1 Ampco Pumps Company Inc
- 12.2. Market Entropy
- 12.2.1 Company's Key Areas Served
- 12.2.2 Recent Developments
- 12.3. Company Market Share Analysis 2025
- 12.3.1 Top 5 Companies Market Share Analysis
- 12.3.2 Top 3 Companies Market Share Analysis
- 12.4. List of Potential Customers
- 13. Research Methodology
List of Figures
- Figure 1: Global Positive Displacement Pumps Industry Revenue Breakdown (billion, %) by Region 2025 & 2033
- Figure 2: North America Positive Displacement Pumps Industry Revenue (billion), by Type 2025 & 2033
- Figure 3: North America Positive Displacement Pumps Industry Revenue Share (%), by Type 2025 & 2033
- Figure 4: North America Positive Displacement Pumps Industry Revenue (billion), by End-user Industry 2025 & 2033
- Figure 5: North America Positive Displacement Pumps Industry Revenue Share (%), by End-user Industry 2025 & 2033
- Figure 6: North America Positive Displacement Pumps Industry Revenue (billion), by Country 2025 & 2033
- Figure 7: North America Positive Displacement Pumps Industry Revenue Share (%), by Country 2025 & 2033
- Figure 8: Europe Positive Displacement Pumps Industry Revenue (billion), by Type 2025 & 2033
- Figure 9: Europe Positive Displacement Pumps Industry Revenue Share (%), by Type 2025 & 2033
- Figure 10: Europe Positive Displacement Pumps Industry Revenue (billion), by End-user Industry 2025 & 2033
- Figure 11: Europe Positive Displacement Pumps Industry Revenue Share (%), by End-user Industry 2025 & 2033
- Figure 12: Europe Positive Displacement Pumps Industry Revenue (billion), by Country 2025 & 2033
- Figure 13: Europe Positive Displacement Pumps Industry Revenue Share (%), by Country 2025 & 2033
- Figure 14: Asia Pacific Positive Displacement Pumps Industry Revenue (billion), by Type 2025 & 2033
- Figure 15: Asia Pacific Positive Displacement Pumps Industry Revenue Share (%), by Type 2025 & 2033
- Figure 16: Asia Pacific Positive Displacement Pumps Industry Revenue (billion), by End-user Industry 2025 & 2033
- Figure 17: Asia Pacific Positive Displacement Pumps Industry Revenue Share (%), by End-user Industry 2025 & 2033
- Figure 18: Asia Pacific Positive Displacement Pumps Industry Revenue (billion), by Country 2025 & 2033
- Figure 19: Asia Pacific Positive Displacement Pumps Industry Revenue Share (%), by Country 2025 & 2033
- Figure 20: South America Positive Displacement Pumps Industry Revenue (billion), by Type 2025 & 2033
- Figure 21: South America Positive Displacement Pumps Industry Revenue Share (%), by Type 2025 & 2033
- Figure 22: South America Positive Displacement Pumps Industry Revenue (billion), by End-user Industry 2025 & 2033
- Figure 23: South America Positive Displacement Pumps Industry Revenue Share (%), by End-user Industry 2025 & 2033
- Figure 24: South America Positive Displacement Pumps Industry Revenue (billion), by Country 2025 & 2033
- Figure 25: South America Positive Displacement Pumps Industry Revenue Share (%), by Country 2025 & 2033
- Figure 26: Middle East Positive Displacement Pumps Industry Revenue (billion), by Type 2025 & 2033
- Figure 27: Middle East Positive Displacement Pumps Industry Revenue Share (%), by Type 2025 & 2033
- Figure 28: Middle East Positive Displacement Pumps Industry Revenue (billion), by End-user Industry 2025 & 2033
- Figure 29: Middle East Positive Displacement Pumps Industry Revenue Share (%), by End-user Industry 2025 & 2033
- Figure 30: Middle East Positive Displacement Pumps Industry Revenue (billion), by Country 2025 & 2033
- Figure 31: Middle East Positive Displacement Pumps Industry Revenue Share (%), by Country 2025 & 2033
List of Tables
- Table 1: Global Positive Displacement Pumps Industry Revenue billion Forecast, by Type 2020 & 2033
- Table 2: Global Positive Displacement Pumps Industry Revenue billion Forecast, by End-user Industry 2020 & 2033
- Table 3: Global Positive Displacement Pumps Industry Revenue billion Forecast, by Region 2020 & 2033
- Table 4: Global Positive Displacement Pumps Industry Revenue billion Forecast, by Type 2020 & 2033
- Table 5: Global Positive Displacement Pumps Industry Revenue billion Forecast, by End-user Industry 2020 & 2033
- Table 6: Global Positive Displacement Pumps Industry Revenue billion Forecast, by Country 2020 & 2033
- Table 7: Global Positive Displacement Pumps Industry Revenue billion Forecast, by Type 2020 & 2033
- Table 8: Global Positive Displacement Pumps Industry Revenue billion Forecast, by End-user Industry 2020 & 2033
- Table 9: Global Positive Displacement Pumps Industry Revenue billion Forecast, by Country 2020 & 2033
- Table 10: Global Positive Displacement Pumps Industry Revenue billion Forecast, by Type 2020 & 2033
- Table 11: Global Positive Displacement Pumps Industry Revenue billion Forecast, by End-user Industry 2020 & 2033
- Table 12: Global Positive Displacement Pumps Industry Revenue billion Forecast, by Country 2020 & 2033
- Table 13: Global Positive Displacement Pumps Industry Revenue billion Forecast, by Type 2020 & 2033
- Table 14: Global Positive Displacement Pumps Industry Revenue billion Forecast, by End-user Industry 2020 & 2033
- Table 15: Global Positive Displacement Pumps Industry Revenue billion Forecast, by Country 2020 & 2033
- Table 16: Global Positive Displacement Pumps Industry Revenue billion Forecast, by Type 2020 & 2033
- Table 17: Global Positive Displacement Pumps Industry Revenue billion Forecast, by End-user Industry 2020 & 2033
- Table 18: Global Positive Displacement Pumps Industry Revenue billion Forecast, by Country 2020 & 2033
Frequently Asked Questions
1. What is the projected Compound Annual Growth Rate (CAGR) of the Positive Displacement Pumps Industry?
The projected CAGR is approximately 4.42%.
2. Which companies are prominent players in the Positive Displacement Pumps Industry?
Key companies in the market include Ampco Pumps Company Inc, Flowserve Corp, KSB SE & Co KGaA, ITT Inc, LEWA GmbH, SPX Flow Inc, NETZSCH Holding, Xylem Inc *List Not Exhaustive, Sulzer AG, Pentair PLC.
3. What are the main segments of the Positive Displacement Pumps Industry?
The market segments include Type, End-user Industry.
4. Can you provide details about the market size?
The market size is estimated to be USD 29.38 billion as of 2022.
5. What are some drivers contributing to market growth?
4.; The Increasing Demand from the EV4.; Growing Renewable Energy Market.
6. What are the notable trends driving market growth?
Water and Wastewater Sector to Witness Significant Market Growth.
7. Are there any restraints impacting market growth?
4.; Demand-Supply Mismatch for Raw Materials.
8. Can you provide examples of recent developments in the market?
In March 2022, Atlas Copco agreed to acquire LEWA GmbH and subsidiaries and Geveke BV and subsidiaries. LEWA is a leading manufacturer of diaphragm metering pumps, process pumps, and positive displacement pumps.
9. What pricing options are available for accessing the report?
Pricing options include single-user, multi-user, and enterprise licenses priced at USD 4750, USD 5250, and USD 8750 respectively.
10. Is the market size provided in terms of value or volume?
The market size is provided in terms of value, measured in billion.
11. Are there any specific market keywords associated with the report?
Yes, the market keyword associated with the report is "Positive Displacement Pumps Industry," which aids in identifying and referencing the specific market segment covered.
12. How do I determine which pricing option suits my needs best?
The pricing options vary based on user requirements and access needs. Individual users may opt for single-user licenses, while businesses requiring broader access may choose multi-user or enterprise licenses for cost-effective access to the report.
13. Are there any additional resources or data provided in the Positive Displacement Pumps Industry report?
While the report offers comprehensive insights, it's advisable to review the specific contents or supplementary materials provided to ascertain if additional resources or data are available.
14. How can I stay updated on further developments or reports in the Positive Displacement Pumps Industry?
To stay informed about further developments, trends, and reports in the Positive Displacement Pumps Industry, consider subscribing to industry newsletters, following relevant companies and organizations, or regularly checking reputable industry news sources and publications.
Methodology
Step 1 - Identification of Relevant Samples Size from Population Database


Step 2 - Approaches for Defining Global Market Size (Value, Volume* & Price*)

Note*: In applicable scenarios
Step 3 - Data Sources
Primary Research
- Web Analytics
- Survey Reports
- Research Institute
- Latest Research Reports
- Opinion Leaders
Secondary Research
- Annual Reports
- White Paper
- Latest Press Release
- Industry Association
- Paid Database
- Investor Presentations

Step 4 - Data Triangulation
Involves using different sources of information in order to increase the validity of a study
These sources are likely to be stakeholders in a program - participants, other researchers, program staff, other community members, and so on.
Then we put all data in single framework & apply various statistical tools to find out the dynamic on the market.
During the analysis stage, feedback from the stakeholder groups would be compared to determine areas of agreement as well as areas of divergence