

Key Insights
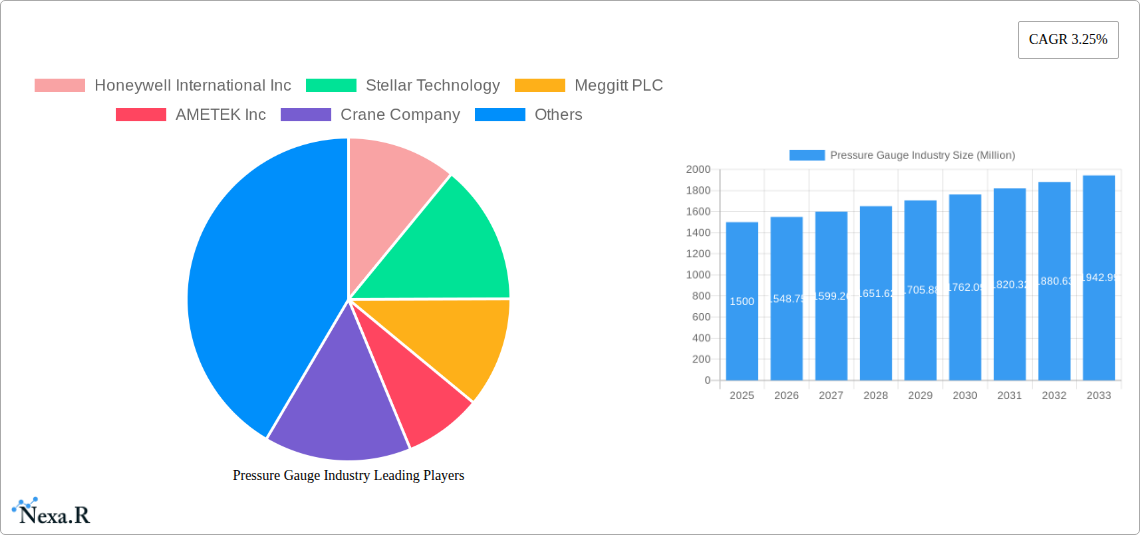
The pressure gauge market, valued at approximately 1005.69 million in 2025, is projected to expand at a Compound Annual Growth Rate (CAGR) of 3.1% from 2025 to 2033. This growth trajectory is propelled by escalating demand for precise measurement solutions across pivotal sectors including aerospace, defense, automotive, and healthcare. Technological innovations, yielding enhanced accuracy, durability, and digital integration in pressure gauges, are further stimulating market expansion. The widespread adoption of smart manufacturing and Industry 4.0 paradigms also drives the demand for advanced pressure monitoring systems.
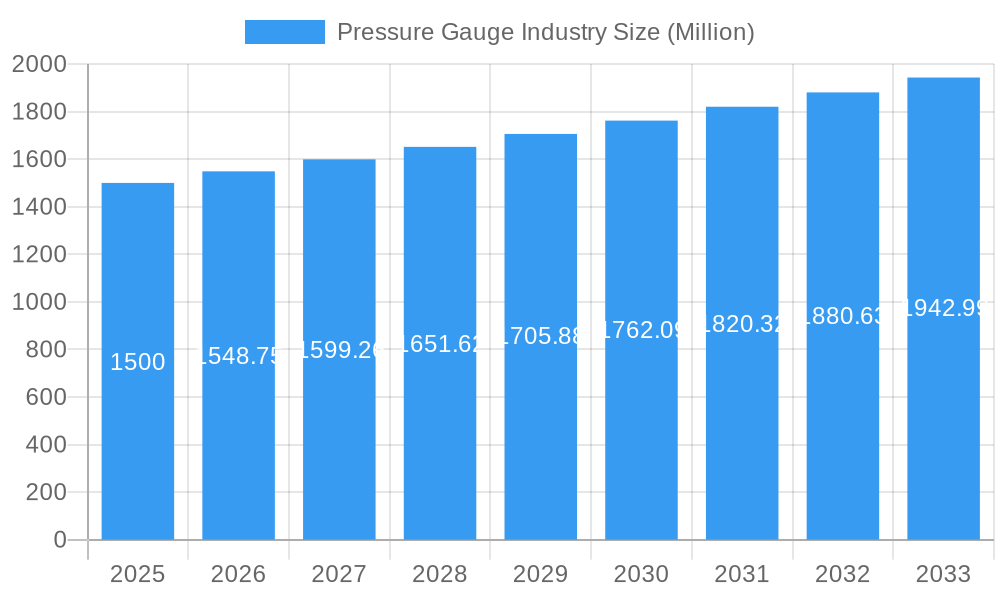
Pressure Gauge Industry Market Size (In Billion)
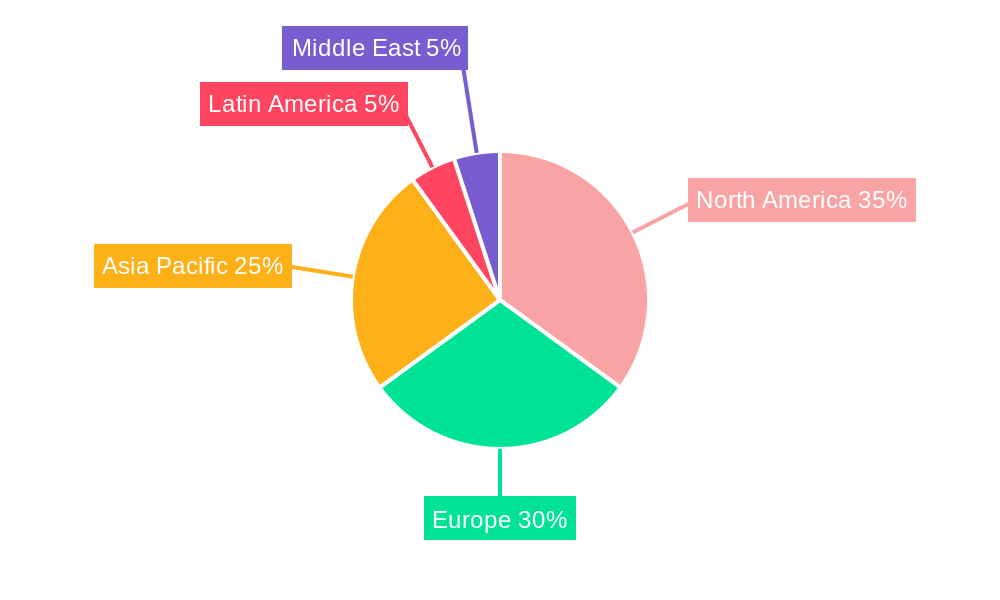
While challenges such as volatile raw material costs and potential supply chain disruptions exist, the long-term market outlook remains robust, underscored by the persistent need for reliable pressure measurement in diverse applications. Market segmentation highlights a notable shift towards digital pressure gauges, outperforming analog counterparts due to superior data acquisition, remote monitoring capabilities, and heightened precision. Geographically, North America and Europe currently dominate market share, with the Asia-Pacific region poised for substantial growth fueled by rapid industrialization and infrastructure development.
Pressure Gauge Industry Company Market Share
The competitive arena features established industry leaders and specialized manufacturers. Key entities such as Honeywell International Inc., AMETEK Inc., and Meggitt PLC are capitalizing on their technological expertise to meet the increasing demand for sophisticated pressure gauge solutions. Emerging companies are also contributing through niche applications and innovative technologies, fostering an environment of continuous innovation, improved accuracy, and enhanced reliability. Future growth opportunities lie in ongoing technological advancements, the utilization of advanced materials for superior durability, and the exploration of emerging sectors like renewable energy and environmental monitoring. The pressure gauge market offers significant potential for both established players and new entrants that can effectively address market challenges and capitalize on technological evolution.
Pressure Gauge Industry Market Report: 2019-2033
This comprehensive report provides a detailed analysis of the Pressure Gauge industry, encompassing market dynamics, growth trends, regional segmentation, product landscape, key players, and future outlook. The study period covers 2019-2033, with 2025 as the base and estimated year. The report is invaluable for industry professionals, investors, and anyone seeking to understand this dynamic market. The global pressure gauge market size was valued at xx Million units in 2024 and is projected to reach xx Million units by 2033.
Pressure Gauge Market Size & Forecast:
- Historical Period: 2019-2024
- Base Year: 2025
- Estimated Year: 2025
- Forecast Period: 2025-2033
Pressure Gauge Industry Market Dynamics & Structure
The pressure gauge market is characterized by moderate concentration, with a few major players holding significant market share. Technological innovation, driven by the demand for higher accuracy, increased durability, and smart functionalities, plays a crucial role. Stringent safety regulations across various industries influence product design and manufacturing processes. The market witnesses continuous development of competitive product substitutes, including smart sensors and advanced monitoring systems. End-user demographics are diverse, spanning across various sectors such as aerospace & defense, automotive, healthcare, energy, and other industrial applications. M&A activity is moderate, with strategic acquisitions aimed at expanding product portfolios and market reach.
- Market Concentration: Moderately concentrated, with top 5 players holding approximately xx% market share in 2024.
- Technological Innovation: Focus on digital pressure gauges, wireless technologies, and improved accuracy.
- Regulatory Frameworks: Stringent safety standards impacting product design and manufacturing in sectors like aerospace and healthcare.
- Competitive Substitutes: Smart sensors and advanced monitoring systems pose a competitive threat.
- End-User Demographics: Diverse, encompassing aerospace, automotive, healthcare, energy, and other industrial applications.
- M&A Trends: Moderate activity, driven by strategic acquisitions for portfolio expansion and market reach. Approximately xx M&A deals were recorded between 2019 and 2024.
Pressure Gauge Industry Growth Trends & Insights
The pressure gauge market exhibits steady growth, driven by increasing industrialization, rising demand for process automation, and stringent safety regulations. The adoption rate of digital pressure gauges is increasing significantly, fueled by their enhanced accuracy, data logging capabilities, and improved user interface. Technological disruptions, such as the integration of IoT and wireless communication, are transforming the market landscape. Consumer behavior shifts toward preference for higher accuracy, reliability, and ease of use influence product development.
- Market Size Evolution: A CAGR of xx% is projected from 2025 to 2033.
- Adoption Rates: Digital pressure gauges are experiencing high adoption rates, with a market penetration expected to reach xx% by 2033.
- Technological Disruptions: IoT integration, wireless communication, and advanced sensor technologies are shaping market trends.
- Consumer Behavior Shifts: Preference for higher accuracy, reliability, and user-friendly features is driving demand.
Dominant Regions, Countries, or Segments in Pressure Gauge Industry
The North American region holds a significant market share, driven by robust industrial activity and a focus on technological advancements. Within application segments, the aerospace & defense sector displays high growth potential due to stringent safety requirements and sophisticated monitoring systems. The digital output type segment demonstrates faster growth than the analog segment owing to enhanced functionalities and data capabilities.
- Leading Region: North America.
- Key Drivers (North America): Strong industrial base, advanced technologies, and stringent safety regulations.
- Leading Segment (Output Type): Digital, driven by advanced features and data analytics capabilities.
- Leading Segment (Application): Aerospace & Defense, fueled by stringent safety regulations and demand for precise pressure monitoring.
- Market Share & Growth Potential: North America holds approximately xx% market share in 2024, with strong growth potential in Asia Pacific.
Pressure Gauge Industry Product Landscape
The pressure gauge market offers a wide range of products, from simple analog gauges to sophisticated digital instruments with advanced features such as data logging, wireless communication, and user-friendly interfaces. Unique selling propositions include enhanced accuracy, durability, and ease of integration into existing monitoring systems. Continuous technological advancements focus on improving accuracy, reducing size, and enhancing reliability.
Key Drivers, Barriers & Challenges in Pressure Gauge Industry
Key Drivers:
- Increasing industrialization and automation across diverse sectors.
- Growing demand for enhanced accuracy and reliability in pressure monitoring.
- Stringent safety regulations in various industries.
- Technological advancements, such as IoT integration and wireless connectivity.
Key Challenges & Restraints:
- High initial investment costs for advanced digital pressure gauges.
- Supply chain disruptions impacting the availability of raw materials and components.
- Intense competition among established players and new entrants.
- Regulatory hurdles and compliance requirements. The impact of these challenges is estimated to reduce market growth by approximately xx% by 2030.
Emerging Opportunities in Pressure Gauge Industry
- Expansion into emerging economies with growing industrial sectors.
- Development of specialized pressure gauges for niche applications (e.g., medical devices, smart homes).
- Integration of pressure gauges with IoT platforms for real-time data monitoring and analysis.
- Development of sustainable and eco-friendly pressure gauge designs.
Growth Accelerators in the Pressure Gauge Industry
Technological breakthroughs in sensor technology, advanced materials, and wireless communication are driving significant growth. Strategic partnerships between manufacturers and technology providers create innovative solutions, expanding market reach. Market expansion strategies focusing on emerging economies with growing industrial sectors and infrastructure development significantly contribute to overall growth.
Key Players Shaping the Pressure Gauge Industry Market
- Honeywell International Inc
- Stellar Technology
- Meggitt PLC
- AMETEK Inc
- Crane Company
- Tavis Corporation
- Industrial Quick Search Inc
- Emerson Electric Co
- CIRCORS Aerospace
- Newbow Aerospace Ltd
- WINTERS INSTRUMENTS
Notable Milestones in Pressure Gauge Industry Sector
- December 2022: OMEGA launched the DPG509 series of digital pressure gauges, featuring high accuracy (0.08%) and a user-friendly interface. This launch significantly impacted the digital pressure gauge segment.
- October 2022: Parker Meggitt introduced iPRESS, a long-range wireless tire pressure gauge for aviation, enhancing safety and operational efficiency in the aviation industry.
In-Depth Pressure Gauge Industry Market Outlook
The pressure gauge market is poised for continued growth, driven by technological advancements, increasing industrialization, and the rising adoption of digital solutions. Strategic partnerships and expansion into untapped markets will be crucial for sustained growth. The market presents significant opportunities for companies to innovate and offer advanced, reliable, and user-friendly pressure measurement solutions. The market is expected to experience a sustained CAGR of xx% throughout the forecast period.
Pressure Gauge Industry Segmentation
-
1. Output Type
- 1.1. Analog
- 1.2. Digital
-
2. Application
- 2.1. Aerospace and Defense
- 2.2. Automotive
- 2.3. Healthcare
- 2.4. Energy
- 2.5. Other Applications
Pressure Gauge Industry Segmentation By Geography
-
1. North America
- 1.1. United States
- 1.2. Canada
-
2. Europe
- 2.1. United Kingdom
- 2.2. Germany
- 2.3. France
- 2.4. Rest of Europe
-
3. Asia Pacific
- 3.1. China
- 3.2. India
- 3.3. Japan
- 3.4. Rest of Asia Pacific
-
4. Latin America
- 4.1. Brazil
- 4.2. Rest of Latin America
- 5. Middle East
-
6. Saudi Arabia
- 6.1. United Arab Emirates
- 6.2. Turkey
- 6.3. Rest of Middle East
Pressure Gauge Industry Regional Market Share
Geographic Coverage of Pressure Gauge Industry
Pressure Gauge Industry REPORT HIGHLIGHTS
| Aspects | Details |
|---|---|
| Study Period | 2020-2034 |
| Base Year | 2025 |
| Estimated Year | 2026 |
| Forecast Period | 2026-2034 |
| Historical Period | 2020-2025 |
| Growth Rate | CAGR of 3.1% from 2020-2034 |
| Segmentation |
|
Table of Contents
- 1. Introduction
- 1.1. Research Scope
- 1.2. Market Segmentation
- 1.3. Research Objective
- 1.4. Definitions and Assumptions
- 2. Executive Summary
- 2.1. Market Snapshot
- 3. Market Dynamics
- 3.1. Market Drivers
- 3.2. Market Restrains
- 3.3. Market Trends
- 3.4. Market Opportunities
- 4. Market Factor Analysis
- 4.1. Porters Five Forces
- 4.1.1. Bargaining Power of Suppliers
- 4.1.2. Bargaining Power of Buyers
- 4.1.3. Threat of New Entrants
- 4.1.4. Threat of Substitutes
- 4.1.5. Competitive Rivalry
- 4.2. PESTEL analysis
- 4.3. BCG Analysis
- 4.3.1. Stars (High Growth, High Market Share)
- 4.3.2. Cash Cows (Low Growth, High Market Share)
- 4.3.3. Question Mark (High Growth, Low Market Share)
- 4.3.4. Dogs (Low Growth, Low Market Share)
- 4.4. Ansoff Matrix Analysis
- 4.5. Supply Chain Analysis
- 4.6. Regulatory Landscape
- 4.7. Current Market Potential and Opportunity Assessment (TAM–SAM–SOM Framework)
- 4.8. NRP Analyst Note
- 4.1. Porters Five Forces
- 5. Market Analysis, Insights and Forecast 2021-2033
- 5.1. Market Analysis, Insights and Forecast - by Output Type
- 5.1.1. Analog
- 5.1.2. Digital
- 5.2. Market Analysis, Insights and Forecast - by Application
- 5.2.1. Aerospace and Defense
- 5.2.2. Automotive
- 5.2.3. Healthcare
- 5.2.4. Energy
- 5.2.5. Other Applications
- 5.3. Market Analysis, Insights and Forecast - by Region
- 5.3.1. North America
- 5.3.2. Europe
- 5.3.3. Asia Pacific
- 5.3.4. Latin America
- 5.3.5. Middle East
- 5.3.6. Saudi Arabia
- 5.1. Market Analysis, Insights and Forecast - by Output Type
- 6. Global Pressure Gauge Industry Analysis, Insights and Forecast, 2021-2033
- 6.1. Market Analysis, Insights and Forecast - by Output Type
- 6.1.1. Analog
- 6.1.2. Digital
- 6.2. Market Analysis, Insights and Forecast - by Application
- 6.2.1. Aerospace and Defense
- 6.2.2. Automotive
- 6.2.3. Healthcare
- 6.2.4. Energy
- 6.2.5. Other Applications
- 6.1. Market Analysis, Insights and Forecast - by Output Type
- 7. North America Pressure Gauge Industry Analysis, Insights and Forecast, 2020-2032
- 7.1. Market Analysis, Insights and Forecast - by Output Type
- 7.1.1. Analog
- 7.1.2. Digital
- 7.2. Market Analysis, Insights and Forecast - by Application
- 7.2.1. Aerospace and Defense
- 7.2.2. Automotive
- 7.2.3. Healthcare
- 7.2.4. Energy
- 7.2.5. Other Applications
- 7.1. Market Analysis, Insights and Forecast - by Output Type
- 8. Europe Pressure Gauge Industry Analysis, Insights and Forecast, 2020-2032
- 8.1. Market Analysis, Insights and Forecast - by Output Type
- 8.1.1. Analog
- 8.1.2. Digital
- 8.2. Market Analysis, Insights and Forecast - by Application
- 8.2.1. Aerospace and Defense
- 8.2.2. Automotive
- 8.2.3. Healthcare
- 8.2.4. Energy
- 8.2.5. Other Applications
- 8.1. Market Analysis, Insights and Forecast - by Output Type
- 9. Asia Pacific Pressure Gauge Industry Analysis, Insights and Forecast, 2020-2032
- 9.1. Market Analysis, Insights and Forecast - by Output Type
- 9.1.1. Analog
- 9.1.2. Digital
- 9.2. Market Analysis, Insights and Forecast - by Application
- 9.2.1. Aerospace and Defense
- 9.2.2. Automotive
- 9.2.3. Healthcare
- 9.2.4. Energy
- 9.2.5. Other Applications
- 9.1. Market Analysis, Insights and Forecast - by Output Type
- 10. Latin America Pressure Gauge Industry Analysis, Insights and Forecast, 2020-2032
- 10.1. Market Analysis, Insights and Forecast - by Output Type
- 10.1.1. Analog
- 10.1.2. Digital
- 10.2. Market Analysis, Insights and Forecast - by Application
- 10.2.1. Aerospace and Defense
- 10.2.2. Automotive
- 10.2.3. Healthcare
- 10.2.4. Energy
- 10.2.5. Other Applications
- 10.1. Market Analysis, Insights and Forecast - by Output Type
- 11. Middle East Pressure Gauge Industry Analysis, Insights and Forecast, 2020-2032
- 11.1. Market Analysis, Insights and Forecast - by Output Type
- 11.1.1. Analog
- 11.1.2. Digital
- 11.2. Market Analysis, Insights and Forecast - by Application
- 11.2.1. Aerospace and Defense
- 11.2.2. Automotive
- 11.2.3. Healthcare
- 11.2.4. Energy
- 11.2.5. Other Applications
- 11.1. Market Analysis, Insights and Forecast - by Output Type
- 12. Saudi Arabia Pressure Gauge Industry Analysis, Insights and Forecast, 2020-2032
- 12.1. Market Analysis, Insights and Forecast - by Output Type
- 12.1.1. Analog
- 12.1.2. Digital
- 12.2. Market Analysis, Insights and Forecast - by Application
- 12.2.1. Aerospace and Defense
- 12.2.2. Automotive
- 12.2.3. Healthcare
- 12.2.4. Energy
- 12.2.5. Other Applications
- 12.1. Market Analysis, Insights and Forecast - by Output Type
- 13. Competitive Analysis
- 13.1. Company Profiles
- 13.1.1 Honeywell International Inc
- 13.1.1.1. Company Overview
- 13.1.1.2. Products
- 13.1.1.3. Company Financials
- 13.1.1.4. SWOT Analysis
- 13.1.2 Stellar Technology
- 13.1.2.1. Company Overview
- 13.1.2.2. Products
- 13.1.2.3. Company Financials
- 13.1.2.4. SWOT Analysis
- 13.1.3 Meggitt PLC
- 13.1.3.1. Company Overview
- 13.1.3.2. Products
- 13.1.3.3. Company Financials
- 13.1.3.4. SWOT Analysis
- 13.1.4 AMETEK Inc
- 13.1.4.1. Company Overview
- 13.1.4.2. Products
- 13.1.4.3. Company Financials
- 13.1.4.4. SWOT Analysis
- 13.1.5 Crane Company
- 13.1.5.1. Company Overview
- 13.1.5.2. Products
- 13.1.5.3. Company Financials
- 13.1.5.4. SWOT Analysis
- 13.1.6 Tavis Corporation
- 13.1.6.1. Company Overview
- 13.1.6.2. Products
- 13.1.6.3. Company Financials
- 13.1.6.4. SWOT Analysis
- 13.1.7 Industrial Quick Search Inc
- 13.1.7.1. Company Overview
- 13.1.7.2. Products
- 13.1.7.3. Company Financials
- 13.1.7.4. SWOT Analysis
- 13.1.8 Emerson Electric Co
- 13.1.8.1. Company Overview
- 13.1.8.2. Products
- 13.1.8.3. Company Financials
- 13.1.8.4. SWOT Analysis
- 13.1.9 CIRCOR Aerospace
- 13.1.9.1. Company Overview
- 13.1.9.2. Products
- 13.1.9.3. Company Financials
- 13.1.9.4. SWOT Analysis
- 13.1.10 Newbow Aerospace Ltd
- 13.1.10.1. Company Overview
- 13.1.10.2. Products
- 13.1.10.3. Company Financials
- 13.1.10.4. SWOT Analysis
- 13.1.11 WINTERS INSTRUMENTS
- 13.1.11.1. Company Overview
- 13.1.11.2. Products
- 13.1.11.3. Company Financials
- 13.1.11.4. SWOT Analysis
- 13.1.1 Honeywell International Inc
- 13.2. Market Entropy
- 13.2.1 Company's Key Areas Served
- 13.2.2 Recent Developments
- 13.3. Company Market Share Analysis 2025
- 13.3.1 Top 5 Companies Market Share Analysis
- 13.3.2 Top 3 Companies Market Share Analysis
- 13.4. List of Potential Customers
- 14. Research Methodology
List of Figures
- Figure 1: Global Pressure Gauge Industry Revenue Breakdown (million, %) by Region 2025 & 2033
- Figure 2: North America Pressure Gauge Industry Revenue (million), by Output Type 2025 & 2033
- Figure 3: North America Pressure Gauge Industry Revenue Share (%), by Output Type 2025 & 2033
- Figure 4: North America Pressure Gauge Industry Revenue (million), by Application 2025 & 2033
- Figure 5: North America Pressure Gauge Industry Revenue Share (%), by Application 2025 & 2033
- Figure 6: North America Pressure Gauge Industry Revenue (million), by Country 2025 & 2033
- Figure 7: North America Pressure Gauge Industry Revenue Share (%), by Country 2025 & 2033
- Figure 8: Europe Pressure Gauge Industry Revenue (million), by Output Type 2025 & 2033
- Figure 9: Europe Pressure Gauge Industry Revenue Share (%), by Output Type 2025 & 2033
- Figure 10: Europe Pressure Gauge Industry Revenue (million), by Application 2025 & 2033
- Figure 11: Europe Pressure Gauge Industry Revenue Share (%), by Application 2025 & 2033
- Figure 12: Europe Pressure Gauge Industry Revenue (million), by Country 2025 & 2033
- Figure 13: Europe Pressure Gauge Industry Revenue Share (%), by Country 2025 & 2033
- Figure 14: Asia Pacific Pressure Gauge Industry Revenue (million), by Output Type 2025 & 2033
- Figure 15: Asia Pacific Pressure Gauge Industry Revenue Share (%), by Output Type 2025 & 2033
- Figure 16: Asia Pacific Pressure Gauge Industry Revenue (million), by Application 2025 & 2033
- Figure 17: Asia Pacific Pressure Gauge Industry Revenue Share (%), by Application 2025 & 2033
- Figure 18: Asia Pacific Pressure Gauge Industry Revenue (million), by Country 2025 & 2033
- Figure 19: Asia Pacific Pressure Gauge Industry Revenue Share (%), by Country 2025 & 2033
- Figure 20: Latin America Pressure Gauge Industry Revenue (million), by Output Type 2025 & 2033
- Figure 21: Latin America Pressure Gauge Industry Revenue Share (%), by Output Type 2025 & 2033
- Figure 22: Latin America Pressure Gauge Industry Revenue (million), by Application 2025 & 2033
- Figure 23: Latin America Pressure Gauge Industry Revenue Share (%), by Application 2025 & 2033
- Figure 24: Latin America Pressure Gauge Industry Revenue (million), by Country 2025 & 2033
- Figure 25: Latin America Pressure Gauge Industry Revenue Share (%), by Country 2025 & 2033
- Figure 26: Middle East Pressure Gauge Industry Revenue (million), by Output Type 2025 & 2033
- Figure 27: Middle East Pressure Gauge Industry Revenue Share (%), by Output Type 2025 & 2033
- Figure 28: Middle East Pressure Gauge Industry Revenue (million), by Application 2025 & 2033
- Figure 29: Middle East Pressure Gauge Industry Revenue Share (%), by Application 2025 & 2033
- Figure 30: Middle East Pressure Gauge Industry Revenue (million), by Country 2025 & 2033
- Figure 31: Middle East Pressure Gauge Industry Revenue Share (%), by Country 2025 & 2033
- Figure 32: Saudi Arabia Pressure Gauge Industry Revenue (million), by Output Type 2025 & 2033
- Figure 33: Saudi Arabia Pressure Gauge Industry Revenue Share (%), by Output Type 2025 & 2033
- Figure 34: Saudi Arabia Pressure Gauge Industry Revenue (million), by Application 2025 & 2033
- Figure 35: Saudi Arabia Pressure Gauge Industry Revenue Share (%), by Application 2025 & 2033
- Figure 36: Saudi Arabia Pressure Gauge Industry Revenue (million), by Country 2025 & 2033
- Figure 37: Saudi Arabia Pressure Gauge Industry Revenue Share (%), by Country 2025 & 2033
List of Tables
- Table 1: Global Pressure Gauge Industry Revenue million Forecast, by Output Type 2020 & 2033
- Table 2: Global Pressure Gauge Industry Revenue million Forecast, by Application 2020 & 2033
- Table 3: Global Pressure Gauge Industry Revenue million Forecast, by Region 2020 & 2033
- Table 4: Global Pressure Gauge Industry Revenue million Forecast, by Output Type 2020 & 2033
- Table 5: Global Pressure Gauge Industry Revenue million Forecast, by Application 2020 & 2033
- Table 6: Global Pressure Gauge Industry Revenue million Forecast, by Country 2020 & 2033
- Table 7: United States Pressure Gauge Industry Revenue (million) Forecast, by Application 2020 & 2033
- Table 8: Canada Pressure Gauge Industry Revenue (million) Forecast, by Application 2020 & 2033
- Table 9: Global Pressure Gauge Industry Revenue million Forecast, by Output Type 2020 & 2033
- Table 10: Global Pressure Gauge Industry Revenue million Forecast, by Application 2020 & 2033
- Table 11: Global Pressure Gauge Industry Revenue million Forecast, by Country 2020 & 2033
- Table 12: United Kingdom Pressure Gauge Industry Revenue (million) Forecast, by Application 2020 & 2033
- Table 13: Germany Pressure Gauge Industry Revenue (million) Forecast, by Application 2020 & 2033
- Table 14: France Pressure Gauge Industry Revenue (million) Forecast, by Application 2020 & 2033
- Table 15: Rest of Europe Pressure Gauge Industry Revenue (million) Forecast, by Application 2020 & 2033
- Table 16: Global Pressure Gauge Industry Revenue million Forecast, by Output Type 2020 & 2033
- Table 17: Global Pressure Gauge Industry Revenue million Forecast, by Application 2020 & 2033
- Table 18: Global Pressure Gauge Industry Revenue million Forecast, by Country 2020 & 2033
- Table 19: China Pressure Gauge Industry Revenue (million) Forecast, by Application 2020 & 2033
- Table 20: India Pressure Gauge Industry Revenue (million) Forecast, by Application 2020 & 2033
- Table 21: Japan Pressure Gauge Industry Revenue (million) Forecast, by Application 2020 & 2033
- Table 22: Rest of Asia Pacific Pressure Gauge Industry Revenue (million) Forecast, by Application 2020 & 2033
- Table 23: Global Pressure Gauge Industry Revenue million Forecast, by Output Type 2020 & 2033
- Table 24: Global Pressure Gauge Industry Revenue million Forecast, by Application 2020 & 2033
- Table 25: Global Pressure Gauge Industry Revenue million Forecast, by Country 2020 & 2033
- Table 26: Brazil Pressure Gauge Industry Revenue (million) Forecast, by Application 2020 & 2033
- Table 27: Rest of Latin America Pressure Gauge Industry Revenue (million) Forecast, by Application 2020 & 2033
- Table 28: Global Pressure Gauge Industry Revenue million Forecast, by Output Type 2020 & 2033
- Table 29: Global Pressure Gauge Industry Revenue million Forecast, by Application 2020 & 2033
- Table 30: Global Pressure Gauge Industry Revenue million Forecast, by Country 2020 & 2033
- Table 31: Global Pressure Gauge Industry Revenue million Forecast, by Output Type 2020 & 2033
- Table 32: Global Pressure Gauge Industry Revenue million Forecast, by Application 2020 & 2033
- Table 33: Global Pressure Gauge Industry Revenue million Forecast, by Country 2020 & 2033
- Table 34: United Arab Emirates Pressure Gauge Industry Revenue (million) Forecast, by Application 2020 & 2033
- Table 35: Turkey Pressure Gauge Industry Revenue (million) Forecast, by Application 2020 & 2033
- Table 36: Rest of Middle East Pressure Gauge Industry Revenue (million) Forecast, by Application 2020 & 2033
Frequently Asked Questions
1. What is the projected Compound Annual Growth Rate (CAGR) of the Pressure Gauge Industry?
The projected CAGR is approximately 3.1%.
2. Which companies are prominent players in the Pressure Gauge Industry?
Key companies in the market include Honeywell International Inc, Stellar Technology, Meggitt PLC, AMETEK Inc, Crane Company, Tavis Corporation, Industrial Quick Search Inc, Emerson Electric Co, CIRCOR Aerospace, Newbow Aerospace Ltd, WINTERS INSTRUMENTS.
3. What are the main segments of the Pressure Gauge Industry?
The market segments include Output Type, Application.
4. Can you provide details about the market size?
The market size is estimated to be USD 1005.69 million as of 2022.
5. What are some drivers contributing to market growth?
N/A
6. What are the notable trends driving market growth?
Healthcare Segment is Projected to Show the Highest Growth During the Forecast Period.
7. Are there any restraints impacting market growth?
N/A
8. Can you provide examples of recent developments in the market?
In December 2022, OMEGA announced the launch of DPG509, OMEGA's newest series of digital pressure gauges, an advanced product designed with maximum functionality. The new DPG509 features a user-friendly interface with four buttons and a large 4-digit backlit display. The full-scale accuracy the product offers is as high as 0.08%.
9. What pricing options are available for accessing the report?
Pricing options include single-user, multi-user, and enterprise licenses priced at USD 4750, USD 5250, and USD 8750 respectively.
10. Is the market size provided in terms of value or volume?
The market size is provided in terms of value, measured in million.
11. Are there any specific market keywords associated with the report?
Yes, the market keyword associated with the report is "Pressure Gauge Industry," which aids in identifying and referencing the specific market segment covered.
12. How do I determine which pricing option suits my needs best?
The pricing options vary based on user requirements and access needs. Individual users may opt for single-user licenses, while businesses requiring broader access may choose multi-user or enterprise licenses for cost-effective access to the report.
13. Are there any additional resources or data provided in the Pressure Gauge Industry report?
While the report offers comprehensive insights, it's advisable to review the specific contents or supplementary materials provided to ascertain if additional resources or data are available.
14. How can I stay updated on further developments or reports in the Pressure Gauge Industry?
To stay informed about further developments, trends, and reports in the Pressure Gauge Industry, consider subscribing to industry newsletters, following relevant companies and organizations, or regularly checking reputable industry news sources and publications.
Methodology
Step 1 - Identification of Relevant Samples Size from Population Database


Step 2 - Approaches for Defining Global Market Size (Value, Volume* & Price*)

Note*: In applicable scenarios
Step 3 - Data Sources
Primary Research
- Web Analytics
- Survey Reports
- Research Institute
- Latest Research Reports
- Opinion Leaders
Secondary Research
- Annual Reports
- White Paper
- Latest Press Release
- Industry Association
- Paid Database
- Investor Presentations

Step 4 - Data Triangulation
Involves using different sources of information in order to increase the validity of a study
These sources are likely to be stakeholders in a program - participants, other researchers, program staff, other community members, and so on.
Then we put all data in single framework & apply various statistical tools to find out the dynamic on the market.
During the analysis stage, feedback from the stakeholder groups would be compared to determine areas of agreement as well as areas of divergence