

Key Insights
The Global Process Gas Compressors Market is projected to experience robust expansion, reaching an estimated $6.3 billion by 2033, driven by a projected Compound Annual Growth Rate (CAGR) of 5.7% from the base year 2025. This growth is primarily attributed to escalating demand from key sectors including Oil & Gas, Chemicals, and Power Generation. These industries depend on efficient and dependable gas compression for their operational continuity. Rising global energy requirements, advancements in chemical processing, and the ongoing shift towards sustainable energy solutions are collectively stimulating demand for both oil-injected and oil-free compressor technologies. Notably, oil-free compressors are gaining prominence due to their capacity to ensure product purity, a crucial requirement in demanding chemical and pharmaceutical applications. Industrialization and infrastructure development in emerging economies are also anticipated to be significant growth contributors.
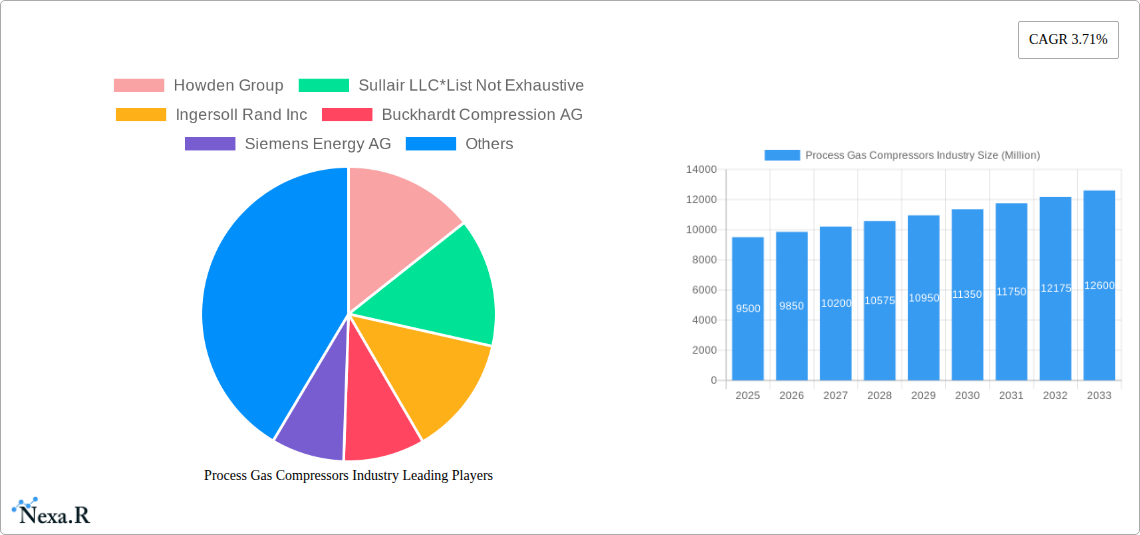
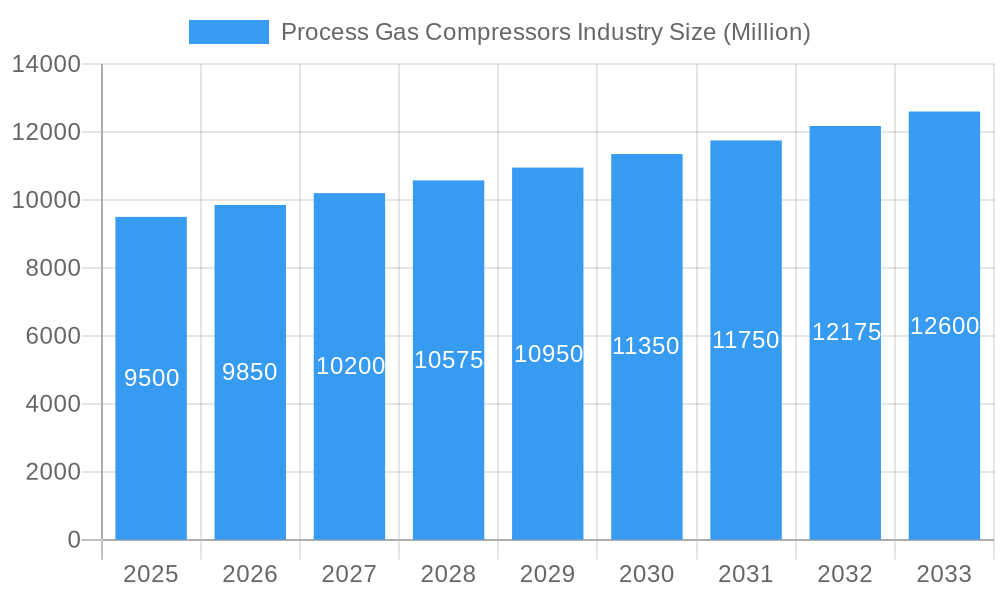
Process Gas Compressors Industry Market Size (In Billion)
However, the market's trajectory is influenced by certain challenges. Stringent environmental regulations concerning emissions and energy efficiency mandate considerable investments in advanced compression technologies. The substantial upfront capital investment for high-performance process gas compressors and the availability of reconditioned units may also present headwinds. Nevertheless, the persistent drive for operational excellence and cost optimization among end-users, coupled with technological innovations such as intelligent monitoring systems and energy recovery solutions, are expected to offset these constraints. Leading industry players, including Howden Group, Sullair LLC, Ingersoll Rand Inc., Buckhardt Compression AG, and Siemens Energy AG, are actively pursuing research and development to launch novel solutions and broaden their global presence, addressing diverse regional market needs. North America and Europe currently hold significant market shares, with the Asia Pacific region demonstrating rapid growth.
Process Gas Compressors Industry Company Market Share
Process Gas Compressors Industry: Market Analysis and Forecast (2019-2033)
This comprehensive report delivers an in-depth analysis of the global Process Gas Compressors market, exploring its current landscape, growth trajectory, and future potential. Covering the period from 2019 to 2033, with a base year of 2025, this study provides critical insights for stakeholders in the oil & gas, chemicals, power generation, industrial gases, and manufacturing sectors. We examine market dynamics, key drivers, emerging opportunities, and the competitive strategies of leading companies, offering a data-driven outlook for strategic decision-making.
Process Gas Compressors Industry Market Dynamics & Structure
The Process Gas Compressors industry is characterized by a moderate to high market concentration, with a few key players holding significant market share. Technological innovation remains a primary driver, with continuous advancements in efficiency, reliability, and environmental compliance shaping product development. Regulatory frameworks, particularly those concerning emissions and energy efficiency, are increasingly influential in dictating market demands and product specifications. Competitive product substitutes, though limited in highly specialized applications, do exist, prompting manufacturers to focus on unique selling propositions. End-user demographics reveal a strong reliance on the Oil & Gas and Chemicals sectors, with growing adoption in Power Generation and Industrial Gases. Mergers and acquisitions (M&A) trends indicate a strategic consolidation to gain market access, technological capabilities, and economies of scale. For instance, the period witnessed several strategic acquisitions aimed at expanding product portfolios and geographical reach. Barriers to innovation include the high cost of R&D, stringent safety standards, and the long product development cycles inherent in this capital-intensive industry.
- Market Concentration: Moderate to High, dominated by a few global leaders.
- Technological Innovation Drivers: Focus on energy efficiency, emission reduction, and advanced materials.
- Regulatory Frameworks: Stringent environmental regulations and safety standards influencing design and adoption.
- Competitive Product Substitutes: Limited in specialized applications but evolving in niche areas.
- End-User Demographics: Significant reliance on Oil & Gas and Chemicals, with rising demand from Power Generation and Industrial Gases.
- M&A Trends: Strategic consolidation for market expansion, technology acquisition, and synergy realization.
- Innovation Barriers: High R&D costs, long development cycles, and strict safety protocols.
Process Gas Compressors Industry Growth Trends & Insights
The Process Gas Compressors market is poised for robust growth, driven by increasing global energy demands, industrial expansion, and advancements in process technologies. The market size is projected to evolve significantly, with a Compound Annual Growth Rate (CAGR) of approximately 5.8% between 2025 and 2033. Adoption rates for advanced and energy-efficient compressor technologies are on the rise as industries strive to reduce operational costs and environmental impact. Technological disruptions, such as the integration of smart sensors for predictive maintenance and the development of specialized compressors for emerging applications like hydrogen liquefaction and carbon capture, are reshaping the market. Consumer behavior is shifting towards solutions offering higher reliability, lower total cost of ownership, and enhanced operational flexibility. The penetration of digital solutions, including remote monitoring and control systems, is also a key trend.
The growth is further fueled by the increasing need for efficient gas handling in various industrial processes. In the Oil & Gas sector, this includes natural gas processing, refining, and petrochemical production. The Chemicals industry relies heavily on process gas compressors for synthesis, separation, and transportation of gases. Power generation, particularly in combined cycle power plants and renewable energy integration, also presents substantial demand. Industrial Gases production, including nitrogen, oxygen, and hydrogen, is another significant contributor to market expansion. The increasing focus on sustainability and decarbonization is driving innovation in compressor technologies that minimize energy consumption and reduce greenhouse gas emissions, thereby accelerating the adoption of advanced solutions. The base year 2025 is estimated to see a market valuation of approximately $18,500 million, with projections indicating substantial growth in the forecast period. The historical period 2019-2024 has laid the groundwork with steady growth, influenced by industrial output and energy prices.
Dominant Regions, Countries, or Segments in Process Gas Compressors Industry
The Oil & Gas end-user segment is a dominant force in the global Process Gas Compressors industry, exhibiting the highest market share and substantial growth potential. This dominance is attributed to the continuous demand for natural gas exploration and production, refining operations, and the transportation of hydrocarbons. The upstream and midstream segments of the Oil & Gas industry are particularly significant consumers of various types of process gas compressors, including both oil-injected and oil-free variants, depending on the specific application and purity requirements.
- Key Drivers in Oil & Gas:
- Increasing global energy demand and the continued reliance on fossil fuels.
- Expansion of liquefied natural gas (LNG) infrastructure and transportation networks.
- Growth in petrochemical production facilities requiring robust gas compression solutions.
- Aging infrastructure necessitating upgrades and replacements of existing compressor units.
- Technological advancements in enhanced oil recovery (EOR) and gas processing.
North America, particularly the United States, emerges as a dominant country, driven by its extensive shale gas reserves and sophisticated oil and gas infrastructure. The region's commitment to energy independence and its well-established industrial base contribute to significant demand for process gas compressors.
- Dominance Factors in North America:
- Abundant natural gas resources and active exploration activities.
- Large-scale petrochemical complexes and refining capacity.
- Government policies supporting energy production and infrastructure development.
- Presence of leading end-users and a well-developed supply chain.
- Significant investments in upgrading and expanding existing facilities.
Geographically, the Asia-Pacific region is also exhibiting rapid growth, fueled by burgeoning industrialization, expanding energy needs, and significant investments in infrastructure development across countries like China, India, and Southeast Asian nations. The Chemicals segment in this region is also a major contributor to the overall market growth.
Process Gas Compressors Industry Product Landscape
The Process Gas Compressors industry is witnessing a dynamic product landscape driven by innovation aimed at enhancing efficiency, reliability, and environmental sustainability. Key product advancements include the development of highly energy-efficient centrifugal compressors with optimized aerodynamic designs and advanced materials for extended lifespan. Oil-free compressors are gaining significant traction across various end-user industries, particularly in applications where product purity is paramount, such as in the pharmaceutical and food & beverage sectors, alongside traditional industrial gases. Reciprocating compressors are being refined for higher pressure ratios and improved sealing technologies, while screw compressors are evolving with variable speed drives and enhanced lubrication systems for greater operational flexibility. The integration of smart monitoring and diagnostic capabilities is a critical development, enabling predictive maintenance and reducing downtime.
Key Drivers, Barriers & Challenges in Process Gas Compressors Industry
Key Drivers:
The Process Gas Compressors industry is propelled by several critical drivers. The escalating global demand for energy, particularly natural gas, fuels expansion in the oil and gas sector, necessitating robust compression solutions. Industrial growth worldwide, especially in emerging economies, drives demand in chemical manufacturing, power generation, and industrial gas production. Technological advancements focusing on energy efficiency, reduced emissions, and enhanced reliability are key differentiators, prompting industries to upgrade to newer, more sustainable technologies. Furthermore, stringent environmental regulations pushing for lower carbon footprints and improved air quality indirectly encourage the adoption of advanced compressor technologies.
- Technological Advancements: Focus on energy efficiency, lower emissions, and improved reliability.
- Growing Energy Demand: Increased consumption of natural gas and other process gases.
- Industrial Expansion: Growth in chemical, petrochemical, and manufacturing sectors.
- Environmental Regulations: Mandates for emission reduction and energy conservation.
Barriers & Challenges:
Despite the positive outlook, the industry faces significant barriers and challenges. The high capital investment required for purchasing and installing process gas compressors can be a deterrent, especially for smaller enterprises or during economic downturns. Intense competition among manufacturers can lead to price pressures, impacting profit margins. Supply chain disruptions, as evidenced in recent global events, can affect component availability and lead times, causing project delays. The complexity of integrating advanced compressor systems with existing industrial infrastructure and the need for specialized maintenance expertise pose further hurdles. Moreover, the long lead times for manufacturing custom-designed compressors can limit responsiveness to rapidly changing market demands.
- High Capital Investment: Significant upfront costs for equipment purchase and installation.
- Intense Competition: Price wars and market saturation in certain segments.
- Supply Chain Vulnerabilities: Risks associated with global component sourcing and logistics.
- Technical Complexity: Challenges in integration and specialized maintenance requirements.
- Long Manufacturing Lead Times: Delays in custom-designed equipment delivery.
Emerging Opportunities in Process Gas Compressors Industry
Emerging opportunities in the Process Gas Compressors industry are predominantly centered around the burgeoning renewable energy sector and the global push for decarbonization. The production and transportation of green hydrogen, a key component of future energy systems, presents a substantial growth avenue, requiring specialized high-pressure compression technologies. Carbon capture, utilization, and storage (CCUS) projects are also gaining momentum, creating demand for compressors to handle CO2 streams. Furthermore, the increasing adoption of industrial digitalization and the Industrial Internet of Things (IIoT) is opening up opportunities for smart compressors equipped with advanced analytics and remote monitoring capabilities, offering predictive maintenance and optimized performance. The expansion of petrochemical industries in emerging markets and the ongoing need for upgrades in existing facilities also represent significant opportunities.
Growth Accelerators in the Process Gas Compressors Industry Industry
Several catalysts are accelerating long-term growth in the Process Gas Compressors industry. The global transition towards cleaner energy sources, including the growing importance of hydrogen as a fuel, is a significant accelerator, driving investment in hydrogen production, storage, and distribution infrastructure, all of which require advanced compression technology. Strategic partnerships between compressor manufacturers and technology providers, as exemplified by collaborations in advanced turbine integration and hydrogen compression, are fostering innovation and market penetration. Market expansion strategies, particularly targeting the rapidly industrializing regions in Asia-Pacific and Latin America, are further fueling growth. The continuous drive for operational efficiency and reduced environmental impact across all industrial sectors ensures sustained demand for high-performance and sustainable compression solutions.
Key Players Shaping the Process Gas Compressors Industry Market
- Howden Group
- Sullair LLC
- Ingersoll Rand Inc
- Burckhardt Compression AG
- Siemens Energy AG
- Sundyne LLC
- Bauer Kompressoren GmbH
- Borsig ZM GmbH
- Atlas Copco Group
Notable Milestones in Process Gas Compressors Industry Sector
- August 2020: Vericor Power Systems announced a strategic partnership with Atlas Copco Gas and Process to power integrally geared centrifugal compressors and companders with Vericor gas-driven turbines, enhancing efficiency and performance.
- February 2020: Burckhardt Compression signed a JV agreement with GRZ Technologies for the development of new hydrogen compression technology, targeting hydrogen fuel stations, energy storage systems, and other applications, signaling a strong commitment to the emerging hydrogen economy.
In-Depth Process Gas Compressors Industry Market Outlook
The future outlook for the Process Gas Compressors industry is exceptionally bright, driven by megatrends such as energy transition, industrial digitalization, and the increasing emphasis on environmental sustainability. The accelerating adoption of hydrogen as a clean energy carrier is a primary growth accelerator, creating substantial demand for specialized and high-pressure compressors. Investments in CCUS technologies also present a significant untapped market, aligned with global climate change mitigation efforts. The continued industrialization of emerging economies will sustain demand for core compressor applications in Oil & Gas, Chemicals, and Power Generation. Furthermore, the integration of AI and IoT in compressor design and operation will lead to more intelligent, efficient, and predictive systems, driving customer value and market differentiation. Strategic collaborations and ongoing technological advancements will continue to shape a dynamic and expanding market landscape.
Process Gas Compressors Industry Segmentation
-
1. Type
- 1.1. Oil Injected
- 1.2. Oil Free
-
2. End User
- 2.1. Oil & Gas
- 2.2. Chemicals
- 2.3. Power Generation
- 2.4. Industrial Gases
- 2.5. Others (Manufacturing, Healthcare, etc.)
Process Gas Compressors Industry Segmentation By Geography
- 1. North America
- 2. Europe
- 3. Asia Pacific
- 4. South America
- 5. Middle East
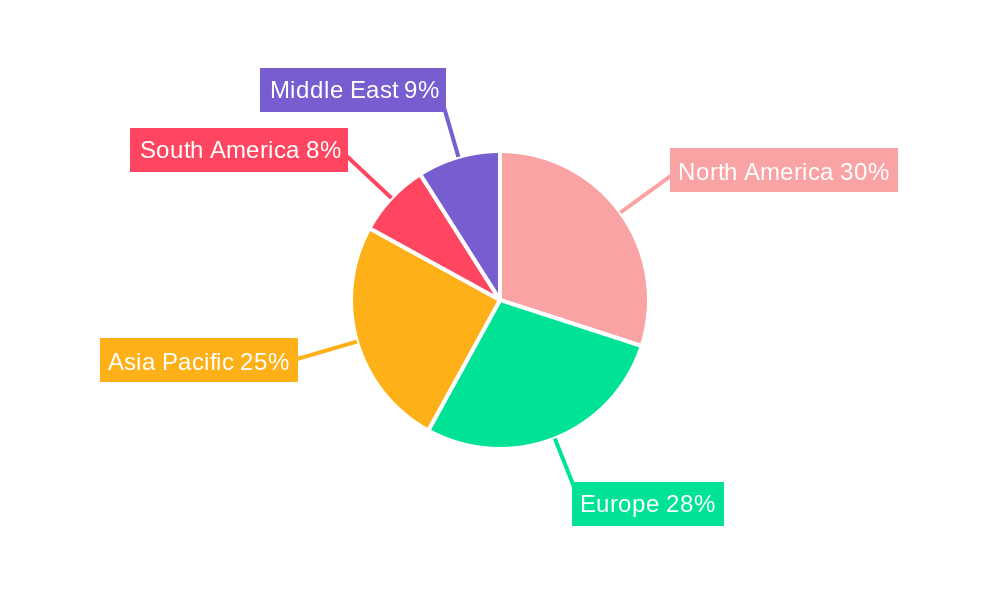
Process Gas Compressors Industry Regional Market Share
Geographic Coverage of Process Gas Compressors Industry
Process Gas Compressors Industry REPORT HIGHLIGHTS
| Aspects | Details |
|---|---|
| Study Period | 2020-2034 |
| Base Year | 2025 |
| Estimated Year | 2026 |
| Forecast Period | 2026-2034 |
| Historical Period | 2020-2025 |
| Growth Rate | CAGR of 5.7% from 2020-2034 |
| Segmentation |
|
Table of Contents
- 1. Introduction
- 1.1. Research Scope
- 1.2. Market Segmentation
- 1.3. Research Objective
- 1.4. Definitions and Assumptions
- 2. Executive Summary
- 2.1. Market Snapshot
- 3. Market Dynamics
- 3.1. Market Drivers
- 3.2. Market Restrains
- 3.3. Market Trends
- 3.4. Market Opportunities
- 4. Market Factor Analysis
- 4.1. Porters Five Forces
- 4.1.1. Bargaining Power of Suppliers
- 4.1.2. Bargaining Power of Buyers
- 4.1.3. Threat of New Entrants
- 4.1.4. Threat of Substitutes
- 4.1.5. Competitive Rivalry
- 4.2. PESTEL analysis
- 4.3. BCG Analysis
- 4.3.1. Stars (High Growth, High Market Share)
- 4.3.2. Cash Cows (Low Growth, High Market Share)
- 4.3.3. Question Mark (High Growth, Low Market Share)
- 4.3.4. Dogs (Low Growth, Low Market Share)
- 4.4. Ansoff Matrix Analysis
- 4.5. Supply Chain Analysis
- 4.6. Regulatory Landscape
- 4.7. Current Market Potential and Opportunity Assessment (TAM–SAM–SOM Framework)
- 4.8. NRP Analyst Note
- 4.1. Porters Five Forces
- 5. Market Analysis, Insights and Forecast 2021-2033
- 5.1. Market Analysis, Insights and Forecast - by Type
- 5.1.1. Oil Injected
- 5.1.2. Oil Free
- 5.2. Market Analysis, Insights and Forecast - by End User
- 5.2.1. Oil & Gas
- 5.2.2. Chemicals
- 5.2.3. Power Generation
- 5.2.4. Industrial Gases
- 5.2.5. Others (Manufacturing, Healthcare, etc.)
- 5.3. Market Analysis, Insights and Forecast - by Region
- 5.3.1. North America
- 5.3.2. Europe
- 5.3.3. Asia Pacific
- 5.3.4. South America
- 5.3.5. Middle East
- 5.1. Market Analysis, Insights and Forecast - by Type
- 6. Global Process Gas Compressors Industry Analysis, Insights and Forecast, 2021-2033
- 6.1. Market Analysis, Insights and Forecast - by Type
- 6.1.1. Oil Injected
- 6.1.2. Oil Free
- 6.2. Market Analysis, Insights and Forecast - by End User
- 6.2.1. Oil & Gas
- 6.2.2. Chemicals
- 6.2.3. Power Generation
- 6.2.4. Industrial Gases
- 6.2.5. Others (Manufacturing, Healthcare, etc.)
- 6.1. Market Analysis, Insights and Forecast - by Type
- 7. North America Process Gas Compressors Industry Analysis, Insights and Forecast, 2020-2032
- 7.1. Market Analysis, Insights and Forecast - by Type
- 7.1.1. Oil Injected
- 7.1.2. Oil Free
- 7.2. Market Analysis, Insights and Forecast - by End User
- 7.2.1. Oil & Gas
- 7.2.2. Chemicals
- 7.2.3. Power Generation
- 7.2.4. Industrial Gases
- 7.2.5. Others (Manufacturing, Healthcare, etc.)
- 7.1. Market Analysis, Insights and Forecast - by Type
- 8. Europe Process Gas Compressors Industry Analysis, Insights and Forecast, 2020-2032
- 8.1. Market Analysis, Insights and Forecast - by Type
- 8.1.1. Oil Injected
- 8.1.2. Oil Free
- 8.2. Market Analysis, Insights and Forecast - by End User
- 8.2.1. Oil & Gas
- 8.2.2. Chemicals
- 8.2.3. Power Generation
- 8.2.4. Industrial Gases
- 8.2.5. Others (Manufacturing, Healthcare, etc.)
- 8.1. Market Analysis, Insights and Forecast - by Type
- 9. Asia Pacific Process Gas Compressors Industry Analysis, Insights and Forecast, 2020-2032
- 9.1. Market Analysis, Insights and Forecast - by Type
- 9.1.1. Oil Injected
- 9.1.2. Oil Free
- 9.2. Market Analysis, Insights and Forecast - by End User
- 9.2.1. Oil & Gas
- 9.2.2. Chemicals
- 9.2.3. Power Generation
- 9.2.4. Industrial Gases
- 9.2.5. Others (Manufacturing, Healthcare, etc.)
- 9.1. Market Analysis, Insights and Forecast - by Type
- 10. South America Process Gas Compressors Industry Analysis, Insights and Forecast, 2020-2032
- 10.1. Market Analysis, Insights and Forecast - by Type
- 10.1.1. Oil Injected
- 10.1.2. Oil Free
- 10.2. Market Analysis, Insights and Forecast - by End User
- 10.2.1. Oil & Gas
- 10.2.2. Chemicals
- 10.2.3. Power Generation
- 10.2.4. Industrial Gases
- 10.2.5. Others (Manufacturing, Healthcare, etc.)
- 10.1. Market Analysis, Insights and Forecast - by Type
- 11. Middle East Process Gas Compressors Industry Analysis, Insights and Forecast, 2020-2032
- 11.1. Market Analysis, Insights and Forecast - by Type
- 11.1.1. Oil Injected
- 11.1.2. Oil Free
- 11.2. Market Analysis, Insights and Forecast - by End User
- 11.2.1. Oil & Gas
- 11.2.2. Chemicals
- 11.2.3. Power Generation
- 11.2.4. Industrial Gases
- 11.2.5. Others (Manufacturing, Healthcare, etc.)
- 11.1. Market Analysis, Insights and Forecast - by Type
- 12. Competitive Analysis
- 12.1. Company Profiles
- 12.1.1 Howden Group
- 12.1.1.1. Company Overview
- 12.1.1.2. Products
- 12.1.1.3. Company Financials
- 12.1.1.4. SWOT Analysis
- 12.1.2 Sullair LLC*List Not Exhaustive
- 12.1.2.1. Company Overview
- 12.1.2.2. Products
- 12.1.2.3. Company Financials
- 12.1.2.4. SWOT Analysis
- 12.1.3 Ingersoll Rand Inc
- 12.1.3.1. Company Overview
- 12.1.3.2. Products
- 12.1.3.3. Company Financials
- 12.1.3.4. SWOT Analysis
- 12.1.4 Buckhardt Compression AG
- 12.1.4.1. Company Overview
- 12.1.4.2. Products
- 12.1.4.3. Company Financials
- 12.1.4.4. SWOT Analysis
- 12.1.5 Siemens Energy AG
- 12.1.5.1. Company Overview
- 12.1.5.2. Products
- 12.1.5.3. Company Financials
- 12.1.5.4. SWOT Analysis
- 12.1.6 Sundyne LLC
- 12.1.6.1. Company Overview
- 12.1.6.2. Products
- 12.1.6.3. Company Financials
- 12.1.6.4. SWOT Analysis
- 12.1.7 Bauer Kompressoren GmbH
- 12.1.7.1. Company Overview
- 12.1.7.2. Products
- 12.1.7.3. Company Financials
- 12.1.7.4. SWOT Analysis
- 12.1.8 Borsig ZM GmbH
- 12.1.8.1. Company Overview
- 12.1.8.2. Products
- 12.1.8.3. Company Financials
- 12.1.8.4. SWOT Analysis
- 12.1.9 Atlas Copco Group
- 12.1.9.1. Company Overview
- 12.1.9.2. Products
- 12.1.9.3. Company Financials
- 12.1.9.4. SWOT Analysis
- 12.1.1 Howden Group
- 12.2. Market Entropy
- 12.2.1 Company's Key Areas Served
- 12.2.2 Recent Developments
- 12.3. Company Market Share Analysis 2025
- 12.3.1 Top 5 Companies Market Share Analysis
- 12.3.2 Top 3 Companies Market Share Analysis
- 12.4. List of Potential Customers
- 13. Research Methodology
List of Figures
- Figure 1: Global Process Gas Compressors Industry Revenue Breakdown (billion, %) by Region 2025 & 2033
- Figure 2: North America Process Gas Compressors Industry Revenue (billion), by Type 2025 & 2033
- Figure 3: North America Process Gas Compressors Industry Revenue Share (%), by Type 2025 & 2033
- Figure 4: North America Process Gas Compressors Industry Revenue (billion), by End User 2025 & 2033
- Figure 5: North America Process Gas Compressors Industry Revenue Share (%), by End User 2025 & 2033
- Figure 6: North America Process Gas Compressors Industry Revenue (billion), by Country 2025 & 2033
- Figure 7: North America Process Gas Compressors Industry Revenue Share (%), by Country 2025 & 2033
- Figure 8: Europe Process Gas Compressors Industry Revenue (billion), by Type 2025 & 2033
- Figure 9: Europe Process Gas Compressors Industry Revenue Share (%), by Type 2025 & 2033
- Figure 10: Europe Process Gas Compressors Industry Revenue (billion), by End User 2025 & 2033
- Figure 11: Europe Process Gas Compressors Industry Revenue Share (%), by End User 2025 & 2033
- Figure 12: Europe Process Gas Compressors Industry Revenue (billion), by Country 2025 & 2033
- Figure 13: Europe Process Gas Compressors Industry Revenue Share (%), by Country 2025 & 2033
- Figure 14: Asia Pacific Process Gas Compressors Industry Revenue (billion), by Type 2025 & 2033
- Figure 15: Asia Pacific Process Gas Compressors Industry Revenue Share (%), by Type 2025 & 2033
- Figure 16: Asia Pacific Process Gas Compressors Industry Revenue (billion), by End User 2025 & 2033
- Figure 17: Asia Pacific Process Gas Compressors Industry Revenue Share (%), by End User 2025 & 2033
- Figure 18: Asia Pacific Process Gas Compressors Industry Revenue (billion), by Country 2025 & 2033
- Figure 19: Asia Pacific Process Gas Compressors Industry Revenue Share (%), by Country 2025 & 2033
- Figure 20: South America Process Gas Compressors Industry Revenue (billion), by Type 2025 & 2033
- Figure 21: South America Process Gas Compressors Industry Revenue Share (%), by Type 2025 & 2033
- Figure 22: South America Process Gas Compressors Industry Revenue (billion), by End User 2025 & 2033
- Figure 23: South America Process Gas Compressors Industry Revenue Share (%), by End User 2025 & 2033
- Figure 24: South America Process Gas Compressors Industry Revenue (billion), by Country 2025 & 2033
- Figure 25: South America Process Gas Compressors Industry Revenue Share (%), by Country 2025 & 2033
- Figure 26: Middle East Process Gas Compressors Industry Revenue (billion), by Type 2025 & 2033
- Figure 27: Middle East Process Gas Compressors Industry Revenue Share (%), by Type 2025 & 2033
- Figure 28: Middle East Process Gas Compressors Industry Revenue (billion), by End User 2025 & 2033
- Figure 29: Middle East Process Gas Compressors Industry Revenue Share (%), by End User 2025 & 2033
- Figure 30: Middle East Process Gas Compressors Industry Revenue (billion), by Country 2025 & 2033
- Figure 31: Middle East Process Gas Compressors Industry Revenue Share (%), by Country 2025 & 2033
List of Tables
- Table 1: Global Process Gas Compressors Industry Revenue billion Forecast, by Type 2020 & 2033
- Table 2: Global Process Gas Compressors Industry Revenue billion Forecast, by End User 2020 & 2033
- Table 3: Global Process Gas Compressors Industry Revenue billion Forecast, by Region 2020 & 2033
- Table 4: Global Process Gas Compressors Industry Revenue billion Forecast, by Type 2020 & 2033
- Table 5: Global Process Gas Compressors Industry Revenue billion Forecast, by End User 2020 & 2033
- Table 6: Global Process Gas Compressors Industry Revenue billion Forecast, by Country 2020 & 2033
- Table 7: Global Process Gas Compressors Industry Revenue billion Forecast, by Type 2020 & 2033
- Table 8: Global Process Gas Compressors Industry Revenue billion Forecast, by End User 2020 & 2033
- Table 9: Global Process Gas Compressors Industry Revenue billion Forecast, by Country 2020 & 2033
- Table 10: Global Process Gas Compressors Industry Revenue billion Forecast, by Type 2020 & 2033
- Table 11: Global Process Gas Compressors Industry Revenue billion Forecast, by End User 2020 & 2033
- Table 12: Global Process Gas Compressors Industry Revenue billion Forecast, by Country 2020 & 2033
- Table 13: Global Process Gas Compressors Industry Revenue billion Forecast, by Type 2020 & 2033
- Table 14: Global Process Gas Compressors Industry Revenue billion Forecast, by End User 2020 & 2033
- Table 15: Global Process Gas Compressors Industry Revenue billion Forecast, by Country 2020 & 2033
- Table 16: Global Process Gas Compressors Industry Revenue billion Forecast, by Type 2020 & 2033
- Table 17: Global Process Gas Compressors Industry Revenue billion Forecast, by End User 2020 & 2033
- Table 18: Global Process Gas Compressors Industry Revenue billion Forecast, by Country 2020 & 2033
Frequently Asked Questions
1. What is the projected Compound Annual Growth Rate (CAGR) of the Process Gas Compressors Industry?
The projected CAGR is approximately 5.7%.
2. Which companies are prominent players in the Process Gas Compressors Industry?
Key companies in the market include Howden Group, Sullair LLC*List Not Exhaustive, Ingersoll Rand Inc, Buckhardt Compression AG, Siemens Energy AG, Sundyne LLC, Bauer Kompressoren GmbH, Borsig ZM GmbH, Atlas Copco Group.
3. What are the main segments of the Process Gas Compressors Industry?
The market segments include Type, End User.
4. Can you provide details about the market size?
The market size is estimated to be USD 6.3 billion as of 2022.
5. What are some drivers contributing to market growth?
4.; Soaring Demand From Natural Gas Sector4.; Increasing Demand From The Refinery And Petrochemical Sector.
6. What are the notable trends driving market growth?
Oil-injected Compressors to Dominate the Market.
7. Are there any restraints impacting market growth?
4.; Higher Capital Cost Compared To Traditional Internal Combustion Engines.
8. Can you provide examples of recent developments in the market?
In August 2020, Vericor power systems announced a strategic partnership with Atlas Copco Gas and process to power integrally geared centrifugal compressors and companders with Vericor gas-driven turbines.
9. What pricing options are available for accessing the report?
Pricing options include single-user, multi-user, and enterprise licenses priced at USD 4750, USD 5250, and USD 8750 respectively.
10. Is the market size provided in terms of value or volume?
The market size is provided in terms of value, measured in billion.
11. Are there any specific market keywords associated with the report?
Yes, the market keyword associated with the report is "Process Gas Compressors Industry," which aids in identifying and referencing the specific market segment covered.
12. How do I determine which pricing option suits my needs best?
The pricing options vary based on user requirements and access needs. Individual users may opt for single-user licenses, while businesses requiring broader access may choose multi-user or enterprise licenses for cost-effective access to the report.
13. Are there any additional resources or data provided in the Process Gas Compressors Industry report?
While the report offers comprehensive insights, it's advisable to review the specific contents or supplementary materials provided to ascertain if additional resources or data are available.
14. How can I stay updated on further developments or reports in the Process Gas Compressors Industry?
To stay informed about further developments, trends, and reports in the Process Gas Compressors Industry, consider subscribing to industry newsletters, following relevant companies and organizations, or regularly checking reputable industry news sources and publications.
Methodology
Step 1 - Identification of Relevant Samples Size from Population Database


Step 2 - Approaches for Defining Global Market Size (Value, Volume* & Price*)

Note*: In applicable scenarios
Step 3 - Data Sources
Primary Research
- Web Analytics
- Survey Reports
- Research Institute
- Latest Research Reports
- Opinion Leaders
Secondary Research
- Annual Reports
- White Paper
- Latest Press Release
- Industry Association
- Paid Database
- Investor Presentations

Step 4 - Data Triangulation
Involves using different sources of information in order to increase the validity of a study
These sources are likely to be stakeholders in a program - participants, other researchers, program staff, other community members, and so on.
Then we put all data in single framework & apply various statistical tools to find out the dynamic on the market.
During the analysis stage, feedback from the stakeholder groups would be compared to determine areas of agreement as well as areas of divergence