

Key Insights
The global pump jack market is experiencing robust growth, driven by increasing oil and gas exploration and production activities worldwide. The market's Compound Annual Growth Rate (CAGR) exceeding 3% indicates a consistent expansion, projected to continue through 2033. This growth is fueled by several factors, including rising global energy demand, particularly in developing economies, leading to increased investment in oil and gas infrastructure. Furthermore, technological advancements in pump jack design, such as improved efficiency and durability, are contributing to market expansion. The segment breakdown reveals a significant demand for both vertical and horizontal well pump jacks, catering to diverse geological conditions and drilling techniques. Onshore applications currently dominate the market, although offshore applications are expected to witness significant growth, driven by exploration in deeper waters and harsher environments. Key players in the market are continuously investing in research and development to enhance product offerings and expand their market share. Competition is intense, with major players focusing on strategic partnerships, acquisitions, and technological innovations to maintain a competitive edge. Geographic analysis reveals that North America and the Asia-Pacific region are major contributors to market revenue, with China and the United States representing significant market segments. However, emerging economies in regions like the Middle East and Africa are projected to show substantial growth potential in the coming years, driven by increased exploration and production activities in these regions. Regulatory changes related to environmental concerns and safety standards might influence market growth, but ongoing technological advancements in emissions reduction and operational safety should mitigate potential restraints.
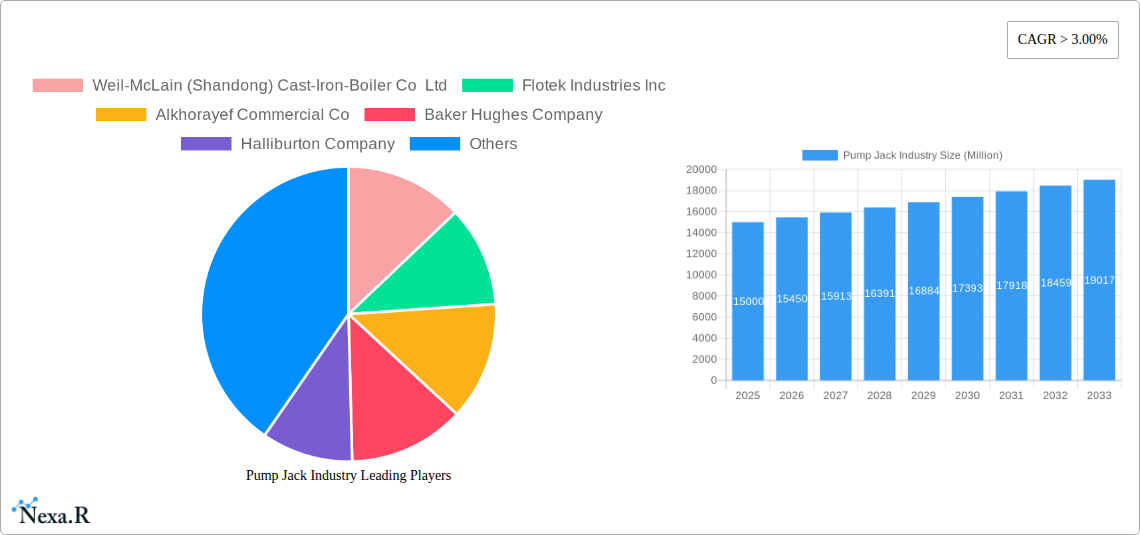
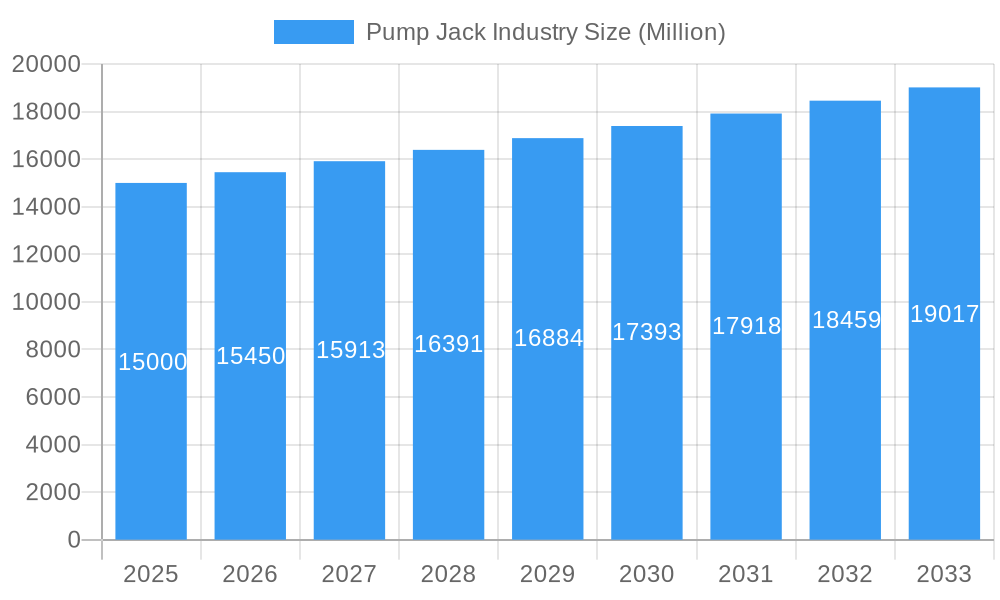
Pump Jack Industry Market Size (In Billion)
The market segmentation by well type (vertical and horizontal) and application (onshore and offshore) provides valuable insights into the specific needs of different operators and geographical locations. The competitive landscape is highly concentrated, with major players dominating the market share. These companies are constantly striving for innovation in pump jack technology, including features such as improved energy efficiency, reduced maintenance requirements, and enhanced reliability. Future growth will depend on several factors, including global energy demand, oil and gas prices, technological advancements, and regulatory changes impacting the industry. The forecast period of 2025-2033 offers considerable opportunity for growth, with continued investment in oil and gas exploration and production expected to drive demand for pump jacks across various segments and regions. Continuous monitoring of technological trends, regulatory frameworks, and geopolitical factors will be crucial for successful market penetration and sustained growth in this dynamic industry.
Pump Jack Industry Company Market Share
This comprehensive report provides an in-depth analysis of the global pump jack industry, encompassing market dynamics, growth trends, regional analysis, product landscape, and key players. The study period covers 2019-2033, with a base year of 2025 and a forecast period of 2025-2033. The report utilizes both quantitative and qualitative data to offer a holistic view of this critical sector within the oil and gas industry. This report is designed for industry professionals, investors, and anyone seeking to understand the current state and future trajectory of the pump jack market. The total market size in 2025 is estimated at xx Million units.
Pump Jack Industry Market Dynamics & Structure
The global pump jack market, valued at xx Million units in 2025, is characterized by a moderately concentrated structure with several major players vying for market share. Technological advancements, particularly in automation and remote monitoring, are significantly influencing market dynamics. Stringent regulatory frameworks concerning environmental protection and safety are also shaping industry practices. While the market faces competition from alternative extraction methods, the continued demand for oil and gas ensures the sustained relevance of pump jacks, especially in onshore applications. Mergers and acquisitions (M&A) activity remains a key factor, with deal volumes expected to average xx per year during the forecast period (2025-2033).
- Market Concentration: Moderately concentrated, with top 5 players holding approximately xx% market share in 2025.
- Technological Innovation: Focus on automation, remote operation, and improved efficiency to reduce operational costs and enhance safety.
- Regulatory Landscape: Stringent environmental regulations and safety standards drive innovation and operational changes.
- Competitive Substitutes: Alternative extraction methods like hydraulic fracturing pose a competitive threat, but pump jacks remain crucial for specific applications.
- End-User Demographics: Primarily oil and gas exploration and production companies, with varying degrees of dependence on pump jacks depending on geography and operational scope.
- M&A Activity: Average of xx M&A deals per year projected during 2025-2033, driven by market consolidation and expansion strategies.
Pump Jack Industry Growth Trends & Insights
The pump jack market exhibited a CAGR of xx% during the historical period (2019-2024) and is projected to maintain a CAGR of xx% during the forecast period (2025-2033). This growth is largely driven by increasing global energy demand, particularly in emerging economies, and the continued reliance on conventional oil and gas extraction methods. Technological disruptions, such as the adoption of smart pump jacks and advanced monitoring systems, are enhancing efficiency and contributing to market expansion. Consumer behavior, reflected in the demand for more sustainable and cost-effective extraction technologies, also shapes the industry's growth trajectory. Market penetration of advanced pump jack technologies is anticipated to reach xx% by 2033. Fluctuations in oil prices remain a key factor influencing market growth.
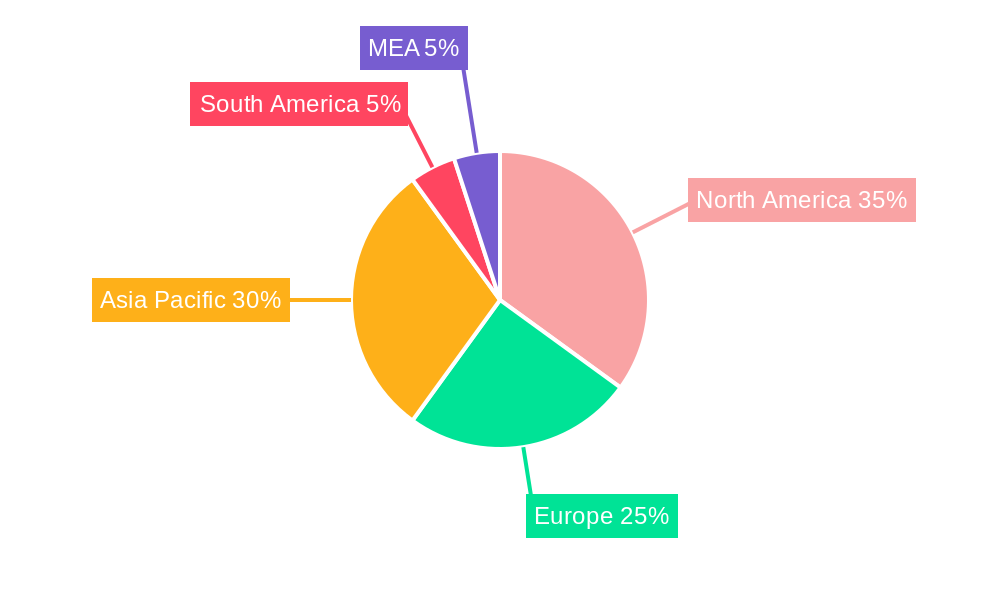
Dominant Regions, Countries, or Segments in Pump Jack Industry
The North American market, particularly the United States, is currently the dominant region for pump jacks, holding approximately xx% of the global market share in 2025. However, significant growth potential exists in developing regions of Asia-Pacific and the Middle East.
By Type: The horizontal well segment is predicted to have a higher CAGR than the vertical well segment due to its increased efficiency in extracting oil and gas from challenging geological formations.
By Application: The onshore segment constitutes a larger market share compared to the offshore segment, reflecting the greater abundance of onshore oil and gas reserves accessible via pump jack technology.
- Key Drivers (North America): Robust oil and gas production, established infrastructure, technological advancements.
- Key Drivers (Asia-Pacific): Rapid industrialization and economic growth, increasing energy demand, government investment in oil and gas infrastructure.
- Key Drivers (Middle East): Large oil and gas reserves, ongoing exploration and production activities, strategic investments in energy infrastructure.
Pump Jack Industry Product Landscape
The pump jack market offers a range of products, from basic mechanical units to sophisticated, automated systems incorporating advanced monitoring and control technologies. Key features driving product differentiation include efficiency, durability, safety features, and ease of maintenance. Technological advancements are focused on enhancing operational efficiency, reducing environmental impact, and improving worker safety. Unique selling propositions (USPs) center on reduced energy consumption, increased uptime, and remote monitoring capabilities.
Key Drivers, Barriers & Challenges in Pump Jack Industry
Key Drivers:
- Increasing global energy demand
- Growth in onshore oil and gas exploration and production
- Technological advancements enhancing efficiency and safety
Key Challenges and Restraints:
- Fluctuations in oil prices impacting investment decisions
- Environmental regulations and concerns regarding carbon emissions
- Competition from alternative extraction methods (e.g., hydraulic fracturing)
- Supply chain disruptions causing delays and increased costs
Emerging Opportunities in Pump Jack Industry
Emerging opportunities lie in the development of more sustainable and environmentally friendly pump jack technologies, including those incorporating renewable energy sources. Expanding into untapped markets in developing economies presents significant growth potential. The integration of advanced analytics and artificial intelligence for predictive maintenance and operational optimization represents a key area of innovation.
Growth Accelerators in the Pump Jack Industry
Long-term growth is fueled by strategic partnerships aimed at optimizing operations and developing cutting-edge technologies. Technological breakthroughs in automation, remote monitoring, and predictive maintenance are crucial catalysts. Market expansion into new geographical regions with significant oil and gas reserves presents substantial opportunities for growth.
Key Players Shaping the Pump Jack Industry Market
- Weil-McLain (Shandong) Cast-Iron-Boiler Co Ltd
- Flotek Industries Inc
- Alkhorayef Commercial Co
- Baker Hughes Company
- Halliburton Company
- National-Oilwell Varco Inc
- Borets International Ltd
- Weatherford International Ltd
- Schlumberger Limited
- Dover Corp
Notable Milestones in Pump Jack Industry Sector
- 2020: Introduction of a new generation of smart pump jacks with advanced monitoring capabilities by Baker Hughes.
- 2022: Acquisition of a smaller pump jack manufacturer by National-Oilwell Varco, expanding its market reach.
- 2023: Launch of a new, more environmentally friendly pump jack design by Schlumberger, reducing carbon emissions. (Further milestones can be added here as data becomes available.)
In-Depth Pump Jack Industry Market Outlook
The future of the pump jack industry is bright, driven by sustained demand for oil and gas, technological innovation, and strategic expansion into new markets. Continued advancements in automation, remote operations, and predictive maintenance will enhance efficiency and profitability. Strategic partnerships and M&A activity will further shape the industry landscape. The market is poised for steady growth, creating attractive opportunities for established players and new entrants alike.
Pump Jack Industry Segmentation
-
1. Type
- 1.1. Vertical Well
- 1.2. Horizontal Well
-
2. Application
- 2.1. Offshore
- 2.2. Onshore
Pump Jack Industry Segmentation By Geography
- 1. North America
- 2. Asia Pacific
- 3. Europe
- 4. South America
- 5. Middle East and Africa
Pump Jack Industry Regional Market Share
Geographic Coverage of Pump Jack Industry
Pump Jack Industry REPORT HIGHLIGHTS
| Aspects | Details |
|---|---|
| Study Period | 2020-2034 |
| Base Year | 2025 |
| Estimated Year | 2026 |
| Forecast Period | 2026-2034 |
| Historical Period | 2020-2025 |
| Growth Rate | CAGR of 5.7% from 2020-2034 |
| Segmentation |
|
Table of Contents
- 1. Introduction
- 1.1. Research Scope
- 1.2. Market Segmentation
- 1.3. Research Objective
- 1.4. Definitions and Assumptions
- 2. Executive Summary
- 2.1. Market Snapshot
- 3. Market Dynamics
- 3.1. Market Drivers
- 3.2. Market Restrains
- 3.3. Market Trends
- 3.4. Market Opportunities
- 4. Market Factor Analysis
- 4.1. Porters Five Forces
- 4.1.1. Bargaining Power of Suppliers
- 4.1.2. Bargaining Power of Buyers
- 4.1.3. Threat of New Entrants
- 4.1.4. Threat of Substitutes
- 4.1.5. Competitive Rivalry
- 4.2. PESTEL analysis
- 4.3. BCG Analysis
- 4.3.1. Stars (High Growth, High Market Share)
- 4.3.2. Cash Cows (Low Growth, High Market Share)
- 4.3.3. Question Mark (High Growth, Low Market Share)
- 4.3.4. Dogs (Low Growth, Low Market Share)
- 4.4. Ansoff Matrix Analysis
- 4.5. Supply Chain Analysis
- 4.6. Regulatory Landscape
- 4.7. Current Market Potential and Opportunity Assessment (TAM–SAM–SOM Framework)
- 4.8. NRP Analyst Note
- 4.1. Porters Five Forces
- 5. Market Analysis, Insights and Forecast 2021-2033
- 5.1. Market Analysis, Insights and Forecast - by Type
- 5.1.1. Vertical Well
- 5.1.2. Horizontal Well
- 5.2. Market Analysis, Insights and Forecast - by Application
- 5.2.1. Offshore
- 5.2.2. Onshore
- 5.3. Market Analysis, Insights and Forecast - by Region
- 5.3.1. North America
- 5.3.2. Asia Pacific
- 5.3.3. Europe
- 5.3.4. South America
- 5.3.5. Middle East and Africa
- 5.1. Market Analysis, Insights and Forecast - by Type
- 6. Global Pump Jack Industry Analysis, Insights and Forecast, 2021-2033
- 6.1. Market Analysis, Insights and Forecast - by Type
- 6.1.1. Vertical Well
- 6.1.2. Horizontal Well
- 6.2. Market Analysis, Insights and Forecast - by Application
- 6.2.1. Offshore
- 6.2.2. Onshore
- 6.1. Market Analysis, Insights and Forecast - by Type
- 7. North America Pump Jack Industry Analysis, Insights and Forecast, 2020-2032
- 7.1. Market Analysis, Insights and Forecast - by Type
- 7.1.1. Vertical Well
- 7.1.2. Horizontal Well
- 7.2. Market Analysis, Insights and Forecast - by Application
- 7.2.1. Offshore
- 7.2.2. Onshore
- 7.1. Market Analysis, Insights and Forecast - by Type
- 8. Asia Pacific Pump Jack Industry Analysis, Insights and Forecast, 2020-2032
- 8.1. Market Analysis, Insights and Forecast - by Type
- 8.1.1. Vertical Well
- 8.1.2. Horizontal Well
- 8.2. Market Analysis, Insights and Forecast - by Application
- 8.2.1. Offshore
- 8.2.2. Onshore
- 8.1. Market Analysis, Insights and Forecast - by Type
- 9. Europe Pump Jack Industry Analysis, Insights and Forecast, 2020-2032
- 9.1. Market Analysis, Insights and Forecast - by Type
- 9.1.1. Vertical Well
- 9.1.2. Horizontal Well
- 9.2. Market Analysis, Insights and Forecast - by Application
- 9.2.1. Offshore
- 9.2.2. Onshore
- 9.1. Market Analysis, Insights and Forecast - by Type
- 10. South America Pump Jack Industry Analysis, Insights and Forecast, 2020-2032
- 10.1. Market Analysis, Insights and Forecast - by Type
- 10.1.1. Vertical Well
- 10.1.2. Horizontal Well
- 10.2. Market Analysis, Insights and Forecast - by Application
- 10.2.1. Offshore
- 10.2.2. Onshore
- 10.1. Market Analysis, Insights and Forecast - by Type
- 11. Middle East and Africa Pump Jack Industry Analysis, Insights and Forecast, 2020-2032
- 11.1. Market Analysis, Insights and Forecast - by Type
- 11.1.1. Vertical Well
- 11.1.2. Horizontal Well
- 11.2. Market Analysis, Insights and Forecast - by Application
- 11.2.1. Offshore
- 11.2.2. Onshore
- 11.1. Market Analysis, Insights and Forecast - by Type
- 12. Competitive Analysis
- 12.1. Company Profiles
- 12.1.1 Weil-McLain (Shandong) Cast-Iron-Boiler Co Ltd
- 12.1.1.1. Company Overview
- 12.1.1.2. Products
- 12.1.1.3. Company Financials
- 12.1.1.4. SWOT Analysis
- 12.1.2 Flotek Industries Inc
- 12.1.2.1. Company Overview
- 12.1.2.2. Products
- 12.1.2.3. Company Financials
- 12.1.2.4. SWOT Analysis
- 12.1.3 Alkhorayef Commercial Co
- 12.1.3.1. Company Overview
- 12.1.3.2. Products
- 12.1.3.3. Company Financials
- 12.1.3.4. SWOT Analysis
- 12.1.4 Baker Hughes Company
- 12.1.4.1. Company Overview
- 12.1.4.2. Products
- 12.1.4.3. Company Financials
- 12.1.4.4. SWOT Analysis
- 12.1.5 Halliburton Company
- 12.1.5.1. Company Overview
- 12.1.5.2. Products
- 12.1.5.3. Company Financials
- 12.1.5.4. SWOT Analysis
- 12.1.6 National-Oilwell Varco Inc
- 12.1.6.1. Company Overview
- 12.1.6.2. Products
- 12.1.6.3. Company Financials
- 12.1.6.4. SWOT Analysis
- 12.1.7 Borets International Ltd
- 12.1.7.1. Company Overview
- 12.1.7.2. Products
- 12.1.7.3. Company Financials
- 12.1.7.4. SWOT Analysis
- 12.1.8 Weatherford International Ltd
- 12.1.8.1. Company Overview
- 12.1.8.2. Products
- 12.1.8.3. Company Financials
- 12.1.8.4. SWOT Analysis
- 12.1.9 Schlumberger Limited
- 12.1.9.1. Company Overview
- 12.1.9.2. Products
- 12.1.9.3. Company Financials
- 12.1.9.4. SWOT Analysis
- 12.1.10 Dover Corp
- 12.1.10.1. Company Overview
- 12.1.10.2. Products
- 12.1.10.3. Company Financials
- 12.1.10.4. SWOT Analysis
- 12.1.1 Weil-McLain (Shandong) Cast-Iron-Boiler Co Ltd
- 12.2. Market Entropy
- 12.2.1 Company's Key Areas Served
- 12.2.2 Recent Developments
- 12.3. Company Market Share Analysis 2025
- 12.3.1 Top 5 Companies Market Share Analysis
- 12.3.2 Top 3 Companies Market Share Analysis
- 12.4. List of Potential Customers
- 13. Research Methodology
List of Figures
- Figure 1: Global Pump Jack Industry Revenue Breakdown (million, %) by Region 2025 & 2033
- Figure 2: North America Pump Jack Industry Revenue (million), by Type 2025 & 2033
- Figure 3: North America Pump Jack Industry Revenue Share (%), by Type 2025 & 2033
- Figure 4: North America Pump Jack Industry Revenue (million), by Application 2025 & 2033
- Figure 5: North America Pump Jack Industry Revenue Share (%), by Application 2025 & 2033
- Figure 6: North America Pump Jack Industry Revenue (million), by Country 2025 & 2033
- Figure 7: North America Pump Jack Industry Revenue Share (%), by Country 2025 & 2033
- Figure 8: Asia Pacific Pump Jack Industry Revenue (million), by Type 2025 & 2033
- Figure 9: Asia Pacific Pump Jack Industry Revenue Share (%), by Type 2025 & 2033
- Figure 10: Asia Pacific Pump Jack Industry Revenue (million), by Application 2025 & 2033
- Figure 11: Asia Pacific Pump Jack Industry Revenue Share (%), by Application 2025 & 2033
- Figure 12: Asia Pacific Pump Jack Industry Revenue (million), by Country 2025 & 2033
- Figure 13: Asia Pacific Pump Jack Industry Revenue Share (%), by Country 2025 & 2033
- Figure 14: Europe Pump Jack Industry Revenue (million), by Type 2025 & 2033
- Figure 15: Europe Pump Jack Industry Revenue Share (%), by Type 2025 & 2033
- Figure 16: Europe Pump Jack Industry Revenue (million), by Application 2025 & 2033
- Figure 17: Europe Pump Jack Industry Revenue Share (%), by Application 2025 & 2033
- Figure 18: Europe Pump Jack Industry Revenue (million), by Country 2025 & 2033
- Figure 19: Europe Pump Jack Industry Revenue Share (%), by Country 2025 & 2033
- Figure 20: South America Pump Jack Industry Revenue (million), by Type 2025 & 2033
- Figure 21: South America Pump Jack Industry Revenue Share (%), by Type 2025 & 2033
- Figure 22: South America Pump Jack Industry Revenue (million), by Application 2025 & 2033
- Figure 23: South America Pump Jack Industry Revenue Share (%), by Application 2025 & 2033
- Figure 24: South America Pump Jack Industry Revenue (million), by Country 2025 & 2033
- Figure 25: South America Pump Jack Industry Revenue Share (%), by Country 2025 & 2033
- Figure 26: Middle East and Africa Pump Jack Industry Revenue (million), by Type 2025 & 2033
- Figure 27: Middle East and Africa Pump Jack Industry Revenue Share (%), by Type 2025 & 2033
- Figure 28: Middle East and Africa Pump Jack Industry Revenue (million), by Application 2025 & 2033
- Figure 29: Middle East and Africa Pump Jack Industry Revenue Share (%), by Application 2025 & 2033
- Figure 30: Middle East and Africa Pump Jack Industry Revenue (million), by Country 2025 & 2033
- Figure 31: Middle East and Africa Pump Jack Industry Revenue Share (%), by Country 2025 & 2033
List of Tables
- Table 1: Global Pump Jack Industry Revenue million Forecast, by Type 2020 & 2033
- Table 2: Global Pump Jack Industry Revenue million Forecast, by Application 2020 & 2033
- Table 3: Global Pump Jack Industry Revenue million Forecast, by Region 2020 & 2033
- Table 4: Global Pump Jack Industry Revenue million Forecast, by Type 2020 & 2033
- Table 5: Global Pump Jack Industry Revenue million Forecast, by Application 2020 & 2033
- Table 6: Global Pump Jack Industry Revenue million Forecast, by Country 2020 & 2033
- Table 7: Global Pump Jack Industry Revenue million Forecast, by Type 2020 & 2033
- Table 8: Global Pump Jack Industry Revenue million Forecast, by Application 2020 & 2033
- Table 9: Global Pump Jack Industry Revenue million Forecast, by Country 2020 & 2033
- Table 10: Global Pump Jack Industry Revenue million Forecast, by Type 2020 & 2033
- Table 11: Global Pump Jack Industry Revenue million Forecast, by Application 2020 & 2033
- Table 12: Global Pump Jack Industry Revenue million Forecast, by Country 2020 & 2033
- Table 13: Global Pump Jack Industry Revenue million Forecast, by Type 2020 & 2033
- Table 14: Global Pump Jack Industry Revenue million Forecast, by Application 2020 & 2033
- Table 15: Global Pump Jack Industry Revenue million Forecast, by Country 2020 & 2033
- Table 16: Global Pump Jack Industry Revenue million Forecast, by Type 2020 & 2033
- Table 17: Global Pump Jack Industry Revenue million Forecast, by Application 2020 & 2033
- Table 18: Global Pump Jack Industry Revenue million Forecast, by Country 2020 & 2033
Frequently Asked Questions
1. What is the projected Compound Annual Growth Rate (CAGR) of the Pump Jack Industry?
The projected CAGR is approximately 5.7%.
2. Which companies are prominent players in the Pump Jack Industry?
Key companies in the market include Weil-McLain (Shandong) Cast-Iron-Boiler Co Ltd, Flotek Industries Inc, Alkhorayef Commercial Co, Baker Hughes Company, Halliburton Company, National-Oilwell Varco Inc, Borets International Ltd, Weatherford International Ltd, Schlumberger Limited, Dover Corp.
3. What are the main segments of the Pump Jack Industry?
The market segments include Type, Application.
4. Can you provide details about the market size?
The market size is estimated to be USD 3687.6 million as of 2022.
5. What are some drivers contributing to market growth?
4.; Focus On Unconventional Resources4.; Global Energy Demand And Exploration Activities.
6. What are the notable trends driving market growth?
Onshore Application to Dominate the Market.
7. Are there any restraints impacting market growth?
4.; High Implementation Costs.
8. Can you provide examples of recent developments in the market?
N/A
9. What pricing options are available for accessing the report?
Pricing options include single-user, multi-user, and enterprise licenses priced at USD 4750, USD 5250, and USD 8750 respectively.
10. Is the market size provided in terms of value or volume?
The market size is provided in terms of value, measured in million.
11. Are there any specific market keywords associated with the report?
Yes, the market keyword associated with the report is "Pump Jack Industry," which aids in identifying and referencing the specific market segment covered.
12. How do I determine which pricing option suits my needs best?
The pricing options vary based on user requirements and access needs. Individual users may opt for single-user licenses, while businesses requiring broader access may choose multi-user or enterprise licenses for cost-effective access to the report.
13. Are there any additional resources or data provided in the Pump Jack Industry report?
While the report offers comprehensive insights, it's advisable to review the specific contents or supplementary materials provided to ascertain if additional resources or data are available.
14. How can I stay updated on further developments or reports in the Pump Jack Industry?
To stay informed about further developments, trends, and reports in the Pump Jack Industry, consider subscribing to industry newsletters, following relevant companies and organizations, or regularly checking reputable industry news sources and publications.
Methodology
Step 1 - Identification of Relevant Samples Size from Population Database


Step 2 - Approaches for Defining Global Market Size (Value, Volume* & Price*)

Note*: In applicable scenarios
Step 3 - Data Sources
Primary Research
- Web Analytics
- Survey Reports
- Research Institute
- Latest Research Reports
- Opinion Leaders
Secondary Research
- Annual Reports
- White Paper
- Latest Press Release
- Industry Association
- Paid Database
- Investor Presentations

Step 4 - Data Triangulation
Involves using different sources of information in order to increase the validity of a study
These sources are likely to be stakeholders in a program - participants, other researchers, program staff, other community members, and so on.
Then we put all data in single framework & apply various statistical tools to find out the dynamic on the market.
During the analysis stage, feedback from the stakeholder groups would be compared to determine areas of agreement as well as areas of divergence