

Key Insights
The residential battery storage market, valued at $17.4 billion in the base year of 2025, is projected to experience significant expansion at a Compound Annual Growth Rate (CAGR) of 10.9%. This growth is propelled by escalating electricity costs, heightened concerns regarding grid stability, and the increasing integration of residential renewable energy systems, such as solar panels. Consumers are prioritizing energy independence and seeking to reduce utility expenses through the adoption of residential battery solutions that store surplus solar power for later use. Technological advancements enhancing battery efficiency, lifespan, and cost-effectiveness are key market drivers. Lithium-ion batteries currently hold the dominant market share due to their superior energy density and longevity. Nonetheless, lead-acid batteries continue to serve a niche market segment, particularly for cost-sensitive applications. Key revenue-generating regions include North America, Europe, and Asia-Pacific. The competitive landscape features established leaders such as BYD, Samsung SDI, and LG Energy Solution, alongside innovative emerging players. The convergence of smart home technology and advanced energy management systems will further influence market trajectory.
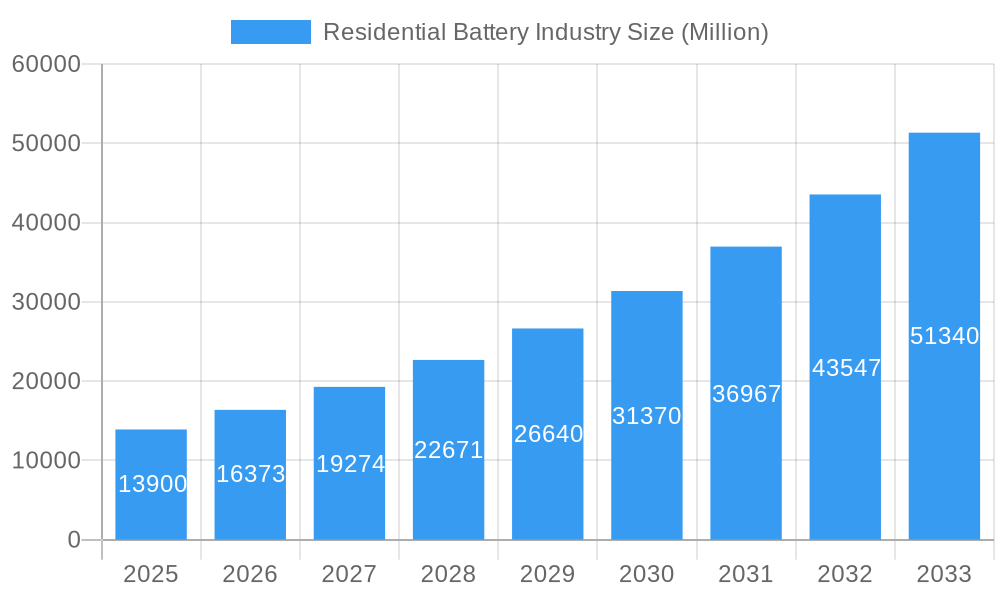
Residential Battery Industry Market Size (In Billion)
Market segmentation by battery chemistry highlights the dominance of lithium-ion technology, attributed to its performance advantages. The lead-acid segment is anticipated to retain its relevance, especially in price-sensitive markets. Geographic expansion will be shaped by government incentives and supportive policies for renewable energy and energy storage. Regions with high renewable energy adoption and favorable regulatory environments, including Europe and North America, are expected to lead growth. Ongoing development in advanced battery chemistries and energy storage technologies will foster market expansion and innovation. Furthermore, improvements in battery management systems and seamless integration with smart home ecosystems will enhance user experience and accelerate adoption.
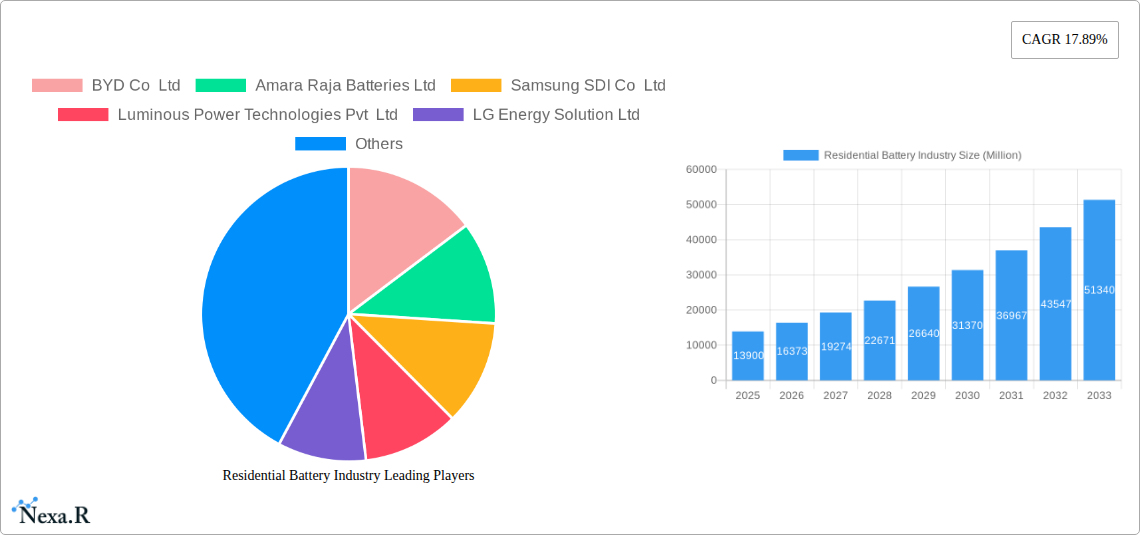
Residential Battery Industry Company Market Share
Residential Battery Industry Market Report: 2019-2033
This comprehensive report provides an in-depth analysis of the residential battery industry, encompassing market dynamics, growth trends, key players, and future outlook. With a focus on both parent (energy storage) and child (residential) markets, this report is an essential resource for industry professionals, investors, and stakeholders seeking a clear understanding of this rapidly evolving sector. The study period spans 2019-2033, with a base year of 2025 and a forecast period of 2025-2033. Expected market size in Million units is provided throughout the report where available.
Residential Battery Industry Market Dynamics & Structure
The residential battery market is characterized by increasing market concentration, driven by technological innovation and strategic mergers & acquisitions (M&A). The market is segmented by battery type, with Lithium-ion batteries leading the charge, followed by Lead-acid and others. Regulatory frameworks, including government incentives and energy efficiency standards, significantly impact market growth. Competitive substitutes, such as grid-tied solar systems, pose a challenge, while end-user demographics—primarily homeowners with high energy consumption or off-grid locations—are key drivers of adoption.
- Market Concentration: The top 5 players hold approximately xx% of the market share in 2025.
- Technological Innovation: Focus on higher energy density, longer lifespan, and improved safety features.
- Regulatory Landscape: Government subsidies and renewable energy mandates are accelerating market growth.
- M&A Activity: xx major M&A deals were recorded between 2019 and 2024, consolidating market share.
- Competitive Substitutes: Grid-tied solar systems and other energy storage solutions present competition.
- End-User Demographics: High energy consumption households and off-grid communities are key target markets.
Residential Battery Industry Growth Trends & Insights
The residential battery market exhibits robust growth, driven by increasing electricity prices, grid instability concerns, and the rising adoption of renewable energy sources. The market size has grown from xx Million units in 2019 to an estimated xx Million units in 2025, and is projected to reach xx Million units by 2033, exhibiting a Compound Annual Growth Rate (CAGR) of xx% during the forecast period. This growth is fueled by technological advancements, particularly in lithium-ion battery technology, and shifting consumer preferences towards energy independence and cost savings. Technological disruptions, such as the development of solid-state batteries, hold the potential to further revolutionize the sector. Market penetration has increased from xx% in 2019 to xx% in 2025 and is expected to reach xx% by 2033.
Dominant Regions, Countries, or Segments in Residential Battery Industry
North America and Europe are currently the dominant regions for residential battery adoption, driven by strong government support for renewable energy and a higher awareness of environmental concerns among consumers. Within these regions, countries such as the US and Germany lead the market. The Lithium-ion battery segment dominates, representing xx% of the total market in 2025 due to its higher energy density and longer lifespan compared to lead-acid batteries.
- Key Drivers in North America: Strong government incentives, high electricity prices, and increasing solar panel installations.
- Key Drivers in Europe: Renewable energy targets, stringent environmental regulations, and rising energy security concerns.
- Lithium-ion Battery Dominance: Superior performance characteristics and technological advancements drive market share.
- Growth Potential: Emerging markets in Asia-Pacific and Latin America show significant growth potential.
Residential Battery Industry Product Landscape
Residential battery systems are offered in a variety of configurations, ranging from small-scale backup power solutions to large-capacity energy storage systems integrated with solar panels. Technological advancements focus on improving energy density, lifespan, safety features, and integration with smart home technologies. Key innovations include battery management systems (BMS) for enhanced efficiency and safety, and modular designs for flexible capacity scaling. Unique selling propositions frequently include warranties, remote monitoring capabilities, and seamless integration with existing home energy systems.
Key Drivers, Barriers & Challenges in Residential Battery Industry
Key Drivers:
- Increased adoption of renewable energy sources (solar, wind)
- Rising electricity prices and grid instability concerns
- Government incentives and supportive policies
- Technological advancements leading to improved performance and cost reductions
Key Barriers & Challenges:
- High initial investment costs
- Limited awareness and understanding among consumers
- Supply chain disruptions affecting raw material availability
- Regulatory hurdles and safety concerns impacting market expansion. The impact of these is estimated at a xx% reduction in growth in 2025.
Emerging Opportunities in Residential Battery Industry
- Expansion into emerging markets with high growth potential (e.g., Asia-Pacific, Latin America).
- Development of innovative applications, such as microgrids and off-grid power solutions.
- Integration with smart home technologies for enhanced energy management and efficiency.
- Growing demand for battery storage solutions in commercial and industrial sectors.
Growth Accelerators in the Residential Battery Industry Industry
Technological breakthroughs, particularly in solid-state battery technology, hold immense potential for driving long-term growth. Strategic partnerships between battery manufacturers, solar panel providers, and energy management companies will create integrated solutions catering to evolving consumer needs. Expansion into new geographical markets and the development of tailored financing options will further boost market penetration and accelerate growth.
Key Players Shaping the Residential Battery Industry Market
- BYD Co Ltd
- Amara Raja Batteries Ltd
- Samsung SDI Co Ltd
- Luminous Power Technologies Pvt Ltd
- LG Energy Solution Ltd
- FIMER SpA
- Siemens AG
- Tesla Inc
- Delta Electronics Ltd
- NEC Corporation
- Energizer Holding Inc
- Duracell Inc
- Panasonic Corporation
Notable Milestones in Residential Battery Industry Sector
- 2020: Introduction of several new lithium-ion battery models with improved energy density and safety features.
- 2021: Significant increase in government subsidies for residential battery installations across several countries.
- 2022: Several major M&A deals consolidating market share among key players.
- 2023: Launch of new battery management systems (BMS) improving efficiency and safety.
- 2024: Successful pilot programs demonstrate the feasibility of integrating residential batteries into microgrids.
In-Depth Residential Battery Industry Market Outlook
The residential battery market is poised for sustained growth, driven by increasing demand for energy independence, cost savings, and grid resilience. Technological advancements, strategic collaborations, and supportive government policies will be key drivers of future market expansion. Strategic opportunities lie in developing innovative product offerings, expanding into new geographical markets, and forging strategic alliances to create robust value chains and cater to the evolving needs of consumers and businesses alike. The long-term outlook is positive, with significant growth potential in the coming decade.
Residential Battery Industry Segmentation
-
1. Type
- 1.1. Lithium-ion Battery
- 1.2. Lead-acid Battery
- 1.3. Others Types
Residential Battery Industry Segmentation By Geography
- 1. North America
- 2. Asia Pacific
- 3. Europe
- 4. South America
- 5. Middle East and Africa
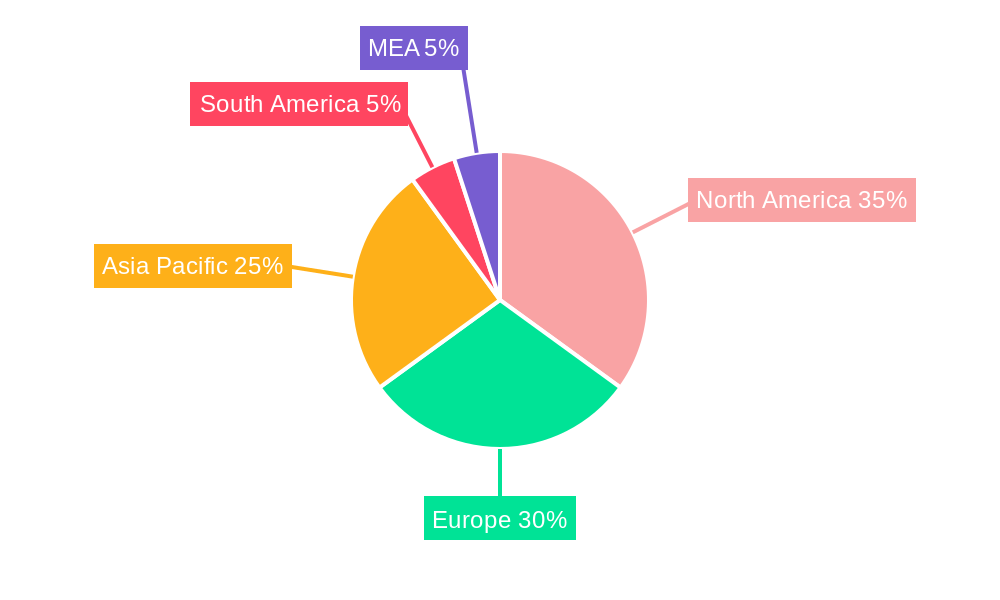
Residential Battery Industry Regional Market Share
Geographic Coverage of Residential Battery Industry
Residential Battery Industry REPORT HIGHLIGHTS
| Aspects | Details |
|---|---|
| Study Period | 2020-2034 |
| Base Year | 2025 |
| Estimated Year | 2026 |
| Forecast Period | 2026-2034 |
| Historical Period | 2020-2025 |
| Growth Rate | CAGR of 10.9% from 2020-2034 |
| Segmentation |
|
Table of Contents
- 1. Introduction
- 1.1. Research Scope
- 1.2. Market Segmentation
- 1.3. Research Objective
- 1.4. Definitions and Assumptions
- 2. Executive Summary
- 2.1. Market Snapshot
- 3. Market Dynamics
- 3.1. Market Drivers
- 3.2. Market Restrains
- 3.3. Market Trends
- 3.4. Market Opportunities
- 4. Market Factor Analysis
- 4.1. Porters Five Forces
- 4.1.1. Bargaining Power of Suppliers
- 4.1.2. Bargaining Power of Buyers
- 4.1.3. Threat of New Entrants
- 4.1.4. Threat of Substitutes
- 4.1.5. Competitive Rivalry
- 4.2. PESTEL analysis
- 4.3. BCG Analysis
- 4.3.1. Stars (High Growth, High Market Share)
- 4.3.2. Cash Cows (Low Growth, High Market Share)
- 4.3.3. Question Mark (High Growth, Low Market Share)
- 4.3.4. Dogs (Low Growth, Low Market Share)
- 4.4. Ansoff Matrix Analysis
- 4.5. Supply Chain Analysis
- 4.6. Regulatory Landscape
- 4.7. Current Market Potential and Opportunity Assessment (TAM–SAM–SOM Framework)
- 4.8. NRP Analyst Note
- 4.1. Porters Five Forces
- 5. Market Analysis, Insights and Forecast 2021-2033
- 5.1. Market Analysis, Insights and Forecast - by Type
- 5.1.1. Lithium-ion Battery
- 5.1.2. Lead-acid Battery
- 5.1.3. Others Types
- 5.2. Market Analysis, Insights and Forecast - by Region
- 5.2.1. North America
- 5.2.2. Asia Pacific
- 5.2.3. Europe
- 5.2.4. South America
- 5.2.5. Middle East and Africa
- 5.1. Market Analysis, Insights and Forecast - by Type
- 6. Global Residential Battery Industry Analysis, Insights and Forecast, 2021-2033
- 6.1. Market Analysis, Insights and Forecast - by Type
- 6.1.1. Lithium-ion Battery
- 6.1.2. Lead-acid Battery
- 6.1.3. Others Types
- 6.1. Market Analysis, Insights and Forecast - by Type
- 7. North America Residential Battery Industry Analysis, Insights and Forecast, 2020-2032
- 7.1. Market Analysis, Insights and Forecast - by Type
- 7.1.1. Lithium-ion Battery
- 7.1.2. Lead-acid Battery
- 7.1.3. Others Types
- 7.1. Market Analysis, Insights and Forecast - by Type
- 8. Asia Pacific Residential Battery Industry Analysis, Insights and Forecast, 2020-2032
- 8.1. Market Analysis, Insights and Forecast - by Type
- 8.1.1. Lithium-ion Battery
- 8.1.2. Lead-acid Battery
- 8.1.3. Others Types
- 8.1. Market Analysis, Insights and Forecast - by Type
- 9. Europe Residential Battery Industry Analysis, Insights and Forecast, 2020-2032
- 9.1. Market Analysis, Insights and Forecast - by Type
- 9.1.1. Lithium-ion Battery
- 9.1.2. Lead-acid Battery
- 9.1.3. Others Types
- 9.1. Market Analysis, Insights and Forecast - by Type
- 10. South America Residential Battery Industry Analysis, Insights and Forecast, 2020-2032
- 10.1. Market Analysis, Insights and Forecast - by Type
- 10.1.1. Lithium-ion Battery
- 10.1.2. Lead-acid Battery
- 10.1.3. Others Types
- 10.1. Market Analysis, Insights and Forecast - by Type
- 11. Middle East and Africa Residential Battery Industry Analysis, Insights and Forecast, 2020-2032
- 11.1. Market Analysis, Insights and Forecast - by Type
- 11.1.1. Lithium-ion Battery
- 11.1.2. Lead-acid Battery
- 11.1.3. Others Types
- 11.1. Market Analysis, Insights and Forecast - by Type
- 12. Competitive Analysis
- 12.1. Company Profiles
- 12.1.1 BYD Co Ltd
- 12.1.1.1. Company Overview
- 12.1.1.2. Products
- 12.1.1.3. Company Financials
- 12.1.1.4. SWOT Analysis
- 12.1.2 Amara Raja Batteries Ltd
- 12.1.2.1. Company Overview
- 12.1.2.2. Products
- 12.1.2.3. Company Financials
- 12.1.2.4. SWOT Analysis
- 12.1.3 Samsung SDI Co Ltd
- 12.1.3.1. Company Overview
- 12.1.3.2. Products
- 12.1.3.3. Company Financials
- 12.1.3.4. SWOT Analysis
- 12.1.4 Luminous Power Technologies Pvt Ltd
- 12.1.4.1. Company Overview
- 12.1.4.2. Products
- 12.1.4.3. Company Financials
- 12.1.4.4. SWOT Analysis
- 12.1.5 LG Energy Solution Ltd
- 12.1.5.1. Company Overview
- 12.1.5.2. Products
- 12.1.5.3. Company Financials
- 12.1.5.4. SWOT Analysis
- 12.1.6 FIMER SpA
- 12.1.6.1. Company Overview
- 12.1.6.2. Products
- 12.1.6.3. Company Financials
- 12.1.6.4. SWOT Analysis
- 12.1.7 Siemens AG
- 12.1.7.1. Company Overview
- 12.1.7.2. Products
- 12.1.7.3. Company Financials
- 12.1.7.4. SWOT Analysis
- 12.1.8 Tesla Inc
- 12.1.8.1. Company Overview
- 12.1.8.2. Products
- 12.1.8.3. Company Financials
- 12.1.8.4. SWOT Analysis
- 12.1.9 Delta Electronics Ltd
- 12.1.9.1. Company Overview
- 12.1.9.2. Products
- 12.1.9.3. Company Financials
- 12.1.9.4. SWOT Analysis
- 12.1.10 NEC Corporation
- 12.1.10.1. Company Overview
- 12.1.10.2. Products
- 12.1.10.3. Company Financials
- 12.1.10.4. SWOT Analysis
- 12.1.11 Energizer Holding Inc
- 12.1.11.1. Company Overview
- 12.1.11.2. Products
- 12.1.11.3. Company Financials
- 12.1.11.4. SWOT Analysis
- 12.1.12 Duracell Inc
- 12.1.12.1. Company Overview
- 12.1.12.2. Products
- 12.1.12.3. Company Financials
- 12.1.12.4. SWOT Analysis
- 12.1.13 Panasonic Corporation
- 12.1.13.1. Company Overview
- 12.1.13.2. Products
- 12.1.13.3. Company Financials
- 12.1.13.4. SWOT Analysis
- 12.1.1 BYD Co Ltd
- 12.2. Market Entropy
- 12.2.1 Company's Key Areas Served
- 12.2.2 Recent Developments
- 12.3. Company Market Share Analysis 2025
- 12.3.1 Top 5 Companies Market Share Analysis
- 12.3.2 Top 3 Companies Market Share Analysis
- 12.4. List of Potential Customers
- 13. Research Methodology
List of Figures
- Figure 1: Global Residential Battery Industry Revenue Breakdown (billion, %) by Region 2025 & 2033
- Figure 2: Global Residential Battery Industry Volume Breakdown (K Tons, %) by Region 2025 & 2033
- Figure 3: North America Residential Battery Industry Revenue (billion), by Type 2025 & 2033
- Figure 4: North America Residential Battery Industry Volume (K Tons), by Type 2025 & 2033
- Figure 5: North America Residential Battery Industry Revenue Share (%), by Type 2025 & 2033
- Figure 6: North America Residential Battery Industry Volume Share (%), by Type 2025 & 2033
- Figure 7: North America Residential Battery Industry Revenue (billion), by Country 2025 & 2033
- Figure 8: North America Residential Battery Industry Volume (K Tons), by Country 2025 & 2033
- Figure 9: North America Residential Battery Industry Revenue Share (%), by Country 2025 & 2033
- Figure 10: North America Residential Battery Industry Volume Share (%), by Country 2025 & 2033
- Figure 11: Asia Pacific Residential Battery Industry Revenue (billion), by Type 2025 & 2033
- Figure 12: Asia Pacific Residential Battery Industry Volume (K Tons), by Type 2025 & 2033
- Figure 13: Asia Pacific Residential Battery Industry Revenue Share (%), by Type 2025 & 2033
- Figure 14: Asia Pacific Residential Battery Industry Volume Share (%), by Type 2025 & 2033
- Figure 15: Asia Pacific Residential Battery Industry Revenue (billion), by Country 2025 & 2033
- Figure 16: Asia Pacific Residential Battery Industry Volume (K Tons), by Country 2025 & 2033
- Figure 17: Asia Pacific Residential Battery Industry Revenue Share (%), by Country 2025 & 2033
- Figure 18: Asia Pacific Residential Battery Industry Volume Share (%), by Country 2025 & 2033
- Figure 19: Europe Residential Battery Industry Revenue (billion), by Type 2025 & 2033
- Figure 20: Europe Residential Battery Industry Volume (K Tons), by Type 2025 & 2033
- Figure 21: Europe Residential Battery Industry Revenue Share (%), by Type 2025 & 2033
- Figure 22: Europe Residential Battery Industry Volume Share (%), by Type 2025 & 2033
- Figure 23: Europe Residential Battery Industry Revenue (billion), by Country 2025 & 2033
- Figure 24: Europe Residential Battery Industry Volume (K Tons), by Country 2025 & 2033
- Figure 25: Europe Residential Battery Industry Revenue Share (%), by Country 2025 & 2033
- Figure 26: Europe Residential Battery Industry Volume Share (%), by Country 2025 & 2033
- Figure 27: South America Residential Battery Industry Revenue (billion), by Type 2025 & 2033
- Figure 28: South America Residential Battery Industry Volume (K Tons), by Type 2025 & 2033
- Figure 29: South America Residential Battery Industry Revenue Share (%), by Type 2025 & 2033
- Figure 30: South America Residential Battery Industry Volume Share (%), by Type 2025 & 2033
- Figure 31: South America Residential Battery Industry Revenue (billion), by Country 2025 & 2033
- Figure 32: South America Residential Battery Industry Volume (K Tons), by Country 2025 & 2033
- Figure 33: South America Residential Battery Industry Revenue Share (%), by Country 2025 & 2033
- Figure 34: South America Residential Battery Industry Volume Share (%), by Country 2025 & 2033
- Figure 35: Middle East and Africa Residential Battery Industry Revenue (billion), by Type 2025 & 2033
- Figure 36: Middle East and Africa Residential Battery Industry Volume (K Tons), by Type 2025 & 2033
- Figure 37: Middle East and Africa Residential Battery Industry Revenue Share (%), by Type 2025 & 2033
- Figure 38: Middle East and Africa Residential Battery Industry Volume Share (%), by Type 2025 & 2033
- Figure 39: Middle East and Africa Residential Battery Industry Revenue (billion), by Country 2025 & 2033
- Figure 40: Middle East and Africa Residential Battery Industry Volume (K Tons), by Country 2025 & 2033
- Figure 41: Middle East and Africa Residential Battery Industry Revenue Share (%), by Country 2025 & 2033
- Figure 42: Middle East and Africa Residential Battery Industry Volume Share (%), by Country 2025 & 2033
List of Tables
- Table 1: Global Residential Battery Industry Revenue billion Forecast, by Type 2020 & 2033
- Table 2: Global Residential Battery Industry Volume K Tons Forecast, by Type 2020 & 2033
- Table 3: Global Residential Battery Industry Revenue billion Forecast, by Region 2020 & 2033
- Table 4: Global Residential Battery Industry Volume K Tons Forecast, by Region 2020 & 2033
- Table 5: Global Residential Battery Industry Revenue billion Forecast, by Type 2020 & 2033
- Table 6: Global Residential Battery Industry Volume K Tons Forecast, by Type 2020 & 2033
- Table 7: Global Residential Battery Industry Revenue billion Forecast, by Country 2020 & 2033
- Table 8: Global Residential Battery Industry Volume K Tons Forecast, by Country 2020 & 2033
- Table 9: Global Residential Battery Industry Revenue billion Forecast, by Type 2020 & 2033
- Table 10: Global Residential Battery Industry Volume K Tons Forecast, by Type 2020 & 2033
- Table 11: Global Residential Battery Industry Revenue billion Forecast, by Country 2020 & 2033
- Table 12: Global Residential Battery Industry Volume K Tons Forecast, by Country 2020 & 2033
- Table 13: Global Residential Battery Industry Revenue billion Forecast, by Type 2020 & 2033
- Table 14: Global Residential Battery Industry Volume K Tons Forecast, by Type 2020 & 2033
- Table 15: Global Residential Battery Industry Revenue billion Forecast, by Country 2020 & 2033
- Table 16: Global Residential Battery Industry Volume K Tons Forecast, by Country 2020 & 2033
- Table 17: Global Residential Battery Industry Revenue billion Forecast, by Type 2020 & 2033
- Table 18: Global Residential Battery Industry Volume K Tons Forecast, by Type 2020 & 2033
- Table 19: Global Residential Battery Industry Revenue billion Forecast, by Country 2020 & 2033
- Table 20: Global Residential Battery Industry Volume K Tons Forecast, by Country 2020 & 2033
- Table 21: Global Residential Battery Industry Revenue billion Forecast, by Type 2020 & 2033
- Table 22: Global Residential Battery Industry Volume K Tons Forecast, by Type 2020 & 2033
- Table 23: Global Residential Battery Industry Revenue billion Forecast, by Country 2020 & 2033
- Table 24: Global Residential Battery Industry Volume K Tons Forecast, by Country 2020 & 2033
Frequently Asked Questions
1. What is the projected Compound Annual Growth Rate (CAGR) of the Residential Battery Industry?
The projected CAGR is approximately 10.9%.
2. Which companies are prominent players in the Residential Battery Industry?
Key companies in the market include BYD Co Ltd, Amara Raja Batteries Ltd, Samsung SDI Co Ltd, Luminous Power Technologies Pvt Ltd, LG Energy Solution Ltd, FIMER SpA, Siemens AG, Tesla Inc, Delta Electronics Ltd, NEC Corporation, Energizer Holding Inc, Duracell Inc, Panasonic Corporation.
3. What are the main segments of the Residential Battery Industry?
The market segments include Type.
4. Can you provide details about the market size?
The market size is estimated to be USD 17.4 billion as of 2022.
5. What are some drivers contributing to market growth?
4.; Increasing Investments in Water Treatment by Developing Countries4.; Growing Demand for the Various End-Use Sectors.
6. What are the notable trends driving market growth?
Lithium-ion Battery Segment Expected to Dominate the Market.
7. Are there any restraints impacting market growth?
4.; Availability of Cheap and Alternative Pumps.
8. Can you provide examples of recent developments in the market?
N/A
9. What pricing options are available for accessing the report?
Pricing options include single-user, multi-user, and enterprise licenses priced at USD 4750, USD 5250, and USD 8750 respectively.
10. Is the market size provided in terms of value or volume?
The market size is provided in terms of value, measured in billion and volume, measured in K Tons.
11. Are there any specific market keywords associated with the report?
Yes, the market keyword associated with the report is "Residential Battery Industry," which aids in identifying and referencing the specific market segment covered.
12. How do I determine which pricing option suits my needs best?
The pricing options vary based on user requirements and access needs. Individual users may opt for single-user licenses, while businesses requiring broader access may choose multi-user or enterprise licenses for cost-effective access to the report.
13. Are there any additional resources or data provided in the Residential Battery Industry report?
While the report offers comprehensive insights, it's advisable to review the specific contents or supplementary materials provided to ascertain if additional resources or data are available.
14. How can I stay updated on further developments or reports in the Residential Battery Industry?
To stay informed about further developments, trends, and reports in the Residential Battery Industry, consider subscribing to industry newsletters, following relevant companies and organizations, or regularly checking reputable industry news sources and publications.
Methodology
Step 1 - Identification of Relevant Samples Size from Population Database


Step 2 - Approaches for Defining Global Market Size (Value, Volume* & Price*)

Note*: In applicable scenarios
Step 3 - Data Sources
Primary Research
- Web Analytics
- Survey Reports
- Research Institute
- Latest Research Reports
- Opinion Leaders
Secondary Research
- Annual Reports
- White Paper
- Latest Press Release
- Industry Association
- Paid Database
- Investor Presentations

Step 4 - Data Triangulation
Involves using different sources of information in order to increase the validity of a study
These sources are likely to be stakeholders in a program - participants, other researchers, program staff, other community members, and so on.
Then we put all data in single framework & apply various statistical tools to find out the dynamic on the market.
During the analysis stage, feedback from the stakeholder groups would be compared to determine areas of agreement as well as areas of divergence