

Key Insights
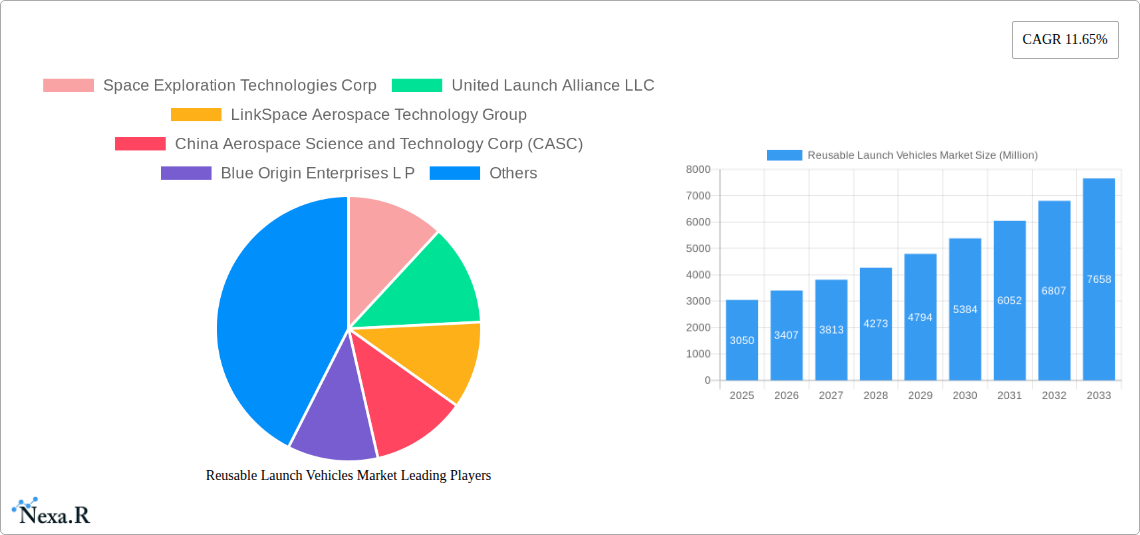
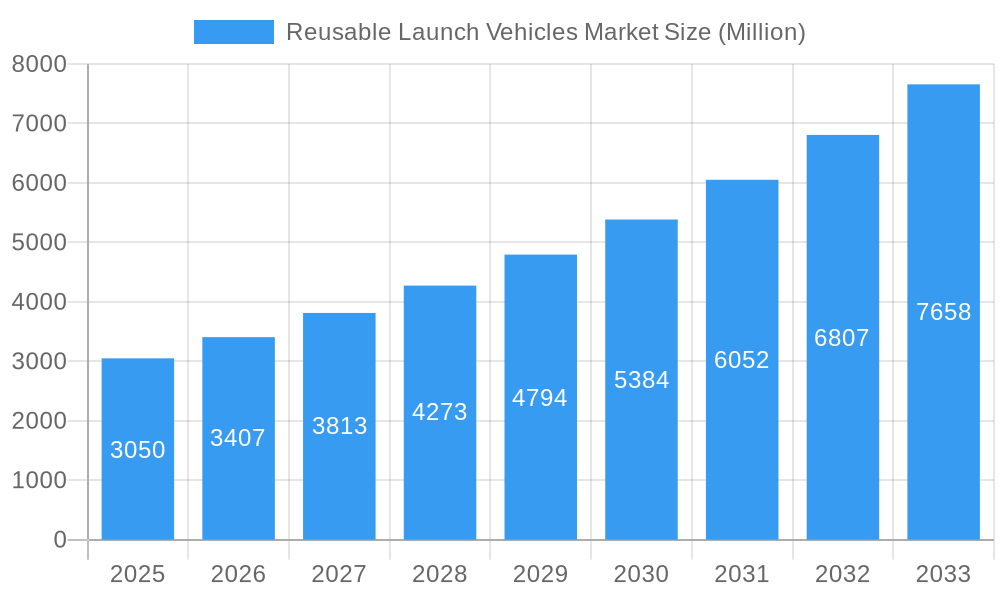
The Reusable Launch Vehicles (RLV) market is experiencing robust growth, projected to reach a market size of $3.05 billion in 2025 and exhibiting a Compound Annual Growth Rate (CAGR) of 11.65% from 2025 to 2033. This expansion is driven by several key factors. Firstly, the increasing demand for cost-effective access to space is a major catalyst. Reusable vehicles significantly reduce launch costs compared to expendable rockets, making space exploration and commercial activities more financially viable. Secondly, advancements in materials science and propulsion technology are leading to more reliable and efficient RLV designs. This includes improvements in thermal protection systems, engine reusability, and overall vehicle durability, which reduces operational downtime and maintenance costs. Finally, growing government and private sector investments in space exploration and commercial space ventures are fueling the market's growth. Countries and companies are investing heavily in developing advanced RLV technologies to achieve their space ambitions, including satellite deployment, space tourism, and deep space exploration.
Reusable Launch Vehicles Market Market Size (In Billion)
The market segmentation reveals a strong preference for partially reusable vehicles, given their balance between cost-effectiveness and technological maturity. However, the multi-stage configuration segment is expected to see significant growth as technological hurdles are overcome and economies of scale are realized. Geographically, North America currently holds a dominant market share, due to the presence of established players like SpaceX and Blue Origin. However, the Asia-Pacific region, particularly China and India, are expected to witness substantial growth in the coming years, driven by national space programs and increasing private sector participation. Competition is intense, with leading players like SpaceX, United Launch Alliance, and Blue Origin constantly innovating to improve their RLV designs and capture larger market shares. The market's future depends on overcoming challenges such as high initial development costs, stringent regulatory frameworks, and the need for consistent technological advancements to ensure reliable and safe operations.
Reusable Launch Vehicles Market Company Market Share
Reusable Launch Vehicles Market: A Comprehensive Report (2019-2033)
This comprehensive report provides an in-depth analysis of the Reusable Launch Vehicles (RLV) market, encompassing its dynamic landscape, growth trends, dominant players, and future outlook. The study period covers 2019-2033, with 2025 serving as the base and estimated year. The forecast period spans 2025-2033, while historical data is analyzed from 2019-2024. This report delves into both the parent market (Space Launch Systems) and the child market (Reusable Launch Vehicles), offering a granular understanding for industry professionals and investors. The market size is projected to reach xx Million units by 2033.
Reusable Launch Vehicles Market Dynamics & Structure
The Reusable Launch Vehicles market is characterized by high market concentration, with a few key players dominating the landscape. Market share is heavily influenced by technological advancements, particularly in reusable engine technology and overall vehicle design. Stringent regulatory frameworks, including licensing and safety regulations, significantly impact market entry and operations. The market faces competition from traditional expendable launch vehicles, although the cost-effectiveness and environmental benefits of RLVs are driving a gradual shift in preference. End-users comprise primarily governmental space agencies and commercial satellite operators. M&A activity has been moderate, primarily involving partnerships and technology acquisitions.
- Market Concentration: High, with top 5 players holding approximately xx% market share in 2025.
- Technological Innovation Drivers: Reusable engine technology, advanced materials, autonomous landing systems.
- Regulatory Frameworks: Stringent safety and environmental regulations influence market entry and operational costs.
- Competitive Product Substitutes: Expendable launch vehicles (ELVs) remain a significant competitor.
- End-User Demographics: Primarily governmental agencies (NASA, ESA, etc.) and commercial satellite operators.
- M&A Trends: Moderate activity, focused on technology acquisition and strategic partnerships (xx deals in 2019-2024).
- Innovation Barriers: High development costs, complex technological challenges, and lengthy certification processes.
Reusable Launch Vehicles Market Growth Trends & Insights
The RLV market is experiencing robust growth, driven by the increasing demand for space-based services and the inherent cost advantages of reusability. The market is transitioning from a nascent stage to a more established market, demonstrating significant adoption rates among both governmental and commercial entities. Technological disruptions, such as the advancements in reusable rocket engines and improved autonomous landing systems, are accelerating market growth. Shifting consumer behavior towards more sustainable and cost-effective space launch solutions is a key factor.
- Market Size Evolution: A CAGR of xx% is projected from 2025 to 2033, driven by increasing demand and technological advancements.
- Adoption Rates: Growing adoption by commercial satellite operators and increased government investment are fueling market growth.
- Technological Disruptions: Reusable engine technology is a significant driver, offering significant cost reductions.
- Consumer Behavior Shifts: A growing preference for cost-effective and environmentally friendly launch solutions.
- Market Penetration: Expected to reach xx% by 2033, indicating significant growth potential.
Dominant Regions, Countries, or Segments in Reusable Launch Vehicles Market
The North American region is currently dominating the Reusable Launch Vehicles market, driven by substantial investments from government agencies like NASA and the presence of major players such as SpaceX and Blue Origin. This dominance is fueled by robust aerospace infrastructure, a supportive regulatory environment, and significant private sector investment. The fully reusable segment is expected to witness the highest growth, given its potential to drastically reduce launch costs. Multi-stage configurations currently dominate, but single-stage-to-orbit (SSTO) technology is showing promise for future growth.
- Key Drivers (North America): Strong government support, robust aerospace infrastructure, presence of major players.
- Dominance Factors: High investment in R&D, advanced technological capabilities, established supply chains.
- Growth Potential (Fully Reusable): High growth potential due to cost savings and increased operational efficiency.
- Growth Potential (Multi-Stage): Currently dominant, but technological advancements in SSTO could impact its future market share.
- Market Share (North America): Holds approximately xx% of the global market in 2025.
Reusable Launch Vehicles Market Product Landscape
The RLV market showcases a diverse range of products, featuring both partially and fully reusable launch vehicles. These vehicles vary in configuration, encompassing single-stage and multi-stage designs. Innovations focus on reusable engine technologies, advanced materials for heat shielding, and autonomous landing systems. Key performance metrics include payload capacity, launch cost, and reusability cycles. The unique selling propositions of RLVs center around cost reductions and increased launch frequency compared to expendable launch systems. Technological advancements are continuously improving reliability and reducing operational costs.
Key Drivers, Barriers & Challenges in Reusable Launch Vehicles Market
Key Drivers:
- Technological advancements in reusable engines and autonomous landing systems.
- Increasing demand for satellite launches and space-based services.
- Government initiatives and investments in space exploration.
- Cost reductions compared to traditional expendable launch vehicles.
Key Challenges & Restraints:
- High development costs and long certification processes for new RLV designs.
- Supply chain complexities and the need for specialized materials.
- Regulatory hurdles and safety concerns related to reusable technology.
- Intense competition among established and emerging players. This leads to price pressures and limits profit margins. The impact of this is estimated to be a xx% reduction in average profit margins by 2033.
Emerging Opportunities in Reusable Launch Vehicles Market
- Expanding commercial space tourism market presents significant opportunities.
- Development of reusable launch systems for smaller payloads (e.g., CubeSats).
- Growing demand for point-to-point transportation using reusable spacecraft.
- Exploration of new propulsion systems and materials to further reduce launch costs and improve performance.
Growth Accelerators in the Reusable Launch Vehicles Market Industry
Technological breakthroughs in propulsion, materials science, and autonomous flight control systems are crucial growth accelerators. Strategic partnerships between aerospace companies, government agencies, and private investors will foster innovation and market expansion. Aggressive market expansion strategies, including development of new launch sites and international collaborations, will further drive growth in the coming years.
Key Players Shaping the Reusable Launch Vehicles Market Market
- Space Exploration Technologies Corp
- United Launch Alliance LLC
- LinkSpace Aerospace Technology Group
- China Aerospace Science and Technology Corp (CASC)
- Blue Origin Enterprises L P
- ArianeGroup
- Deutsches Zentrum für Luft- und Raumfahrt e V (DLR)
- Indian Space Research Organisation (ISRO)
- National Aeronautics and Space Administration (NASA)
Notable Milestones in Reusable Launch Vehicles Market Sector
- 2015: SpaceX successfully lands the Falcon 9 first stage, marking a significant milestone in reusable rocket technology.
- 2018: Blue Origin achieves multiple successful landings of the New Shepard suborbital vehicle.
- 2020: Increased investment in RLV technology by both public and private sectors.
- 2022: Significant advancements in reusable engine technology, leading to improved efficiency and reduced costs.
- 2023: Several key partnerships formed between established and emerging players.
In-Depth Reusable Launch Vehicles Market Market Outlook
The Reusable Launch Vehicles market is poised for significant growth driven by continuous technological advancements, increasing demand for space-based services, and the economic advantages of reusability. Strategic partnerships and government investments will play a crucial role in shaping the market's future. The market holds significant potential for further innovation, particularly in single-stage-to-orbit technologies and expanded applications beyond satellite deployment. The long-term outlook is extremely positive, projecting significant market expansion and increased competition in the coming decade.
Reusable Launch Vehicles Market Segmentation
-
1. Type
- 1.1. Partially Reusable
- 1.2. Fully Reusable
-
2. Configuration
- 2.1. Single-Stage
- 2.2. Multi-Stage
Reusable Launch Vehicles Market Segmentation By Geography
-
1. North America
- 1.1. North America
- 1.2. Canada
-
2. Europe
- 2.1. United Kingdom
- 2.2. Germany
- 2.3. France
- 2.4. Italy
- 2.5. Russia
- 2.6. Rest of Europe
-
3. Asia Pacific
- 3.1. China
- 3.2. India
- 3.3. Japan
- 3.4. South Korea
- 3.5. Rest of Asia Pacific
-
4. Latin America
- 4.1. Brazil
- 4.2. Mexico
- 4.3. Rest of Latin America
-
5. Middle East and Africa
- 5.1. Saudi Arabia
- 5.2. United Arab Emirates
- 5.3. Israel
- 5.4. South Africa
- 5.5. Rest of Middle East and Africa
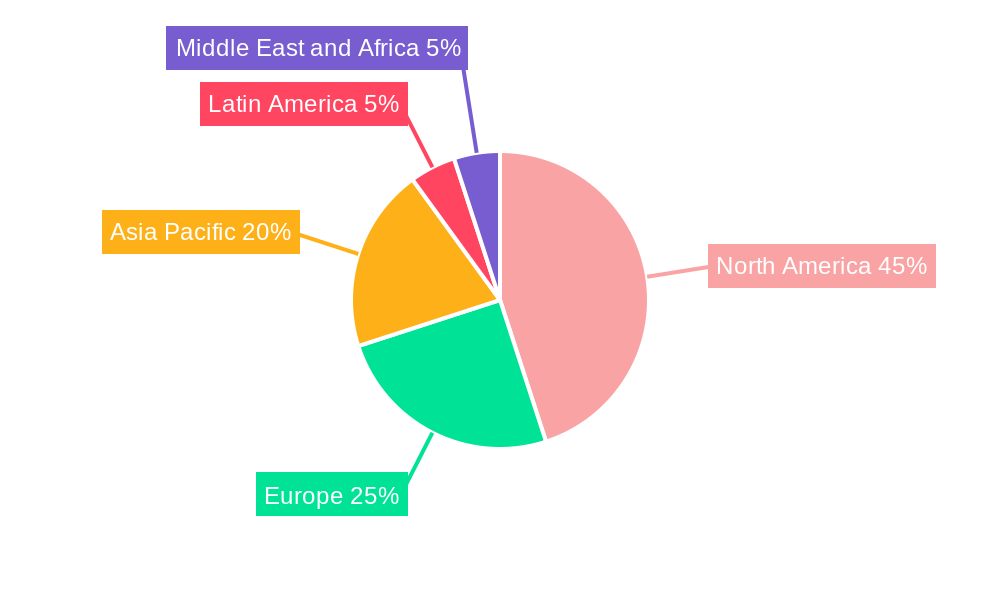
Reusable Launch Vehicles Market Regional Market Share
Geographic Coverage of Reusable Launch Vehicles Market
Reusable Launch Vehicles Market REPORT HIGHLIGHTS
| Aspects | Details |
|---|---|
| Study Period | 2020-2034 |
| Base Year | 2025 |
| Estimated Year | 2026 |
| Forecast Period | 2026-2034 |
| Historical Period | 2020-2025 |
| Growth Rate | CAGR of 11.65% from 2020-2034 |
| Segmentation |
|
Table of Contents
- 1. Introduction
- 1.1. Research Scope
- 1.2. Market Segmentation
- 1.3. Research Objective
- 1.4. Definitions and Assumptions
- 2. Executive Summary
- 2.1. Market Snapshot
- 3. Market Dynamics
- 3.1. Market Drivers
- 3.2. Market Restrains
- 3.3. Market Trends
- 3.4. Market Opportunities
- 4. Market Factor Analysis
- 4.1. Porters Five Forces
- 4.1.1. Bargaining Power of Suppliers
- 4.1.2. Bargaining Power of Buyers
- 4.1.3. Threat of New Entrants
- 4.1.4. Threat of Substitutes
- 4.1.5. Competitive Rivalry
- 4.2. PESTEL analysis
- 4.3. BCG Analysis
- 4.3.1. Stars (High Growth, High Market Share)
- 4.3.2. Cash Cows (Low Growth, High Market Share)
- 4.3.3. Question Mark (High Growth, Low Market Share)
- 4.3.4. Dogs (Low Growth, Low Market Share)
- 4.4. Ansoff Matrix Analysis
- 4.5. Supply Chain Analysis
- 4.6. Regulatory Landscape
- 4.7. Current Market Potential and Opportunity Assessment (TAM–SAM–SOM Framework)
- 4.8. NRP Analyst Note
- 4.1. Porters Five Forces
- 5. Market Analysis, Insights and Forecast 2021-2033
- 5.1. Market Analysis, Insights and Forecast - by Type
- 5.1.1. Partially Reusable
- 5.1.2. Fully Reusable
- 5.2. Market Analysis, Insights and Forecast - by Configuration
- 5.2.1. Single-Stage
- 5.2.2. Multi-Stage
- 5.3. Market Analysis, Insights and Forecast - by Region
- 5.3.1. North America
- 5.3.2. Europe
- 5.3.3. Asia Pacific
- 5.3.4. Latin America
- 5.3.5. Middle East and Africa
- 5.1. Market Analysis, Insights and Forecast - by Type
- 6. Global Reusable Launch Vehicles Market Analysis, Insights and Forecast, 2021-2033
- 6.1. Market Analysis, Insights and Forecast - by Type
- 6.1.1. Partially Reusable
- 6.1.2. Fully Reusable
- 6.2. Market Analysis, Insights and Forecast - by Configuration
- 6.2.1. Single-Stage
- 6.2.2. Multi-Stage
- 6.1. Market Analysis, Insights and Forecast - by Type
- 7. North America Reusable Launch Vehicles Market Analysis, Insights and Forecast, 2020-2032
- 7.1. Market Analysis, Insights and Forecast - by Type
- 7.1.1. Partially Reusable
- 7.1.2. Fully Reusable
- 7.2. Market Analysis, Insights and Forecast - by Configuration
- 7.2.1. Single-Stage
- 7.2.2. Multi-Stage
- 7.1. Market Analysis, Insights and Forecast - by Type
- 8. Europe Reusable Launch Vehicles Market Analysis, Insights and Forecast, 2020-2032
- 8.1. Market Analysis, Insights and Forecast - by Type
- 8.1.1. Partially Reusable
- 8.1.2. Fully Reusable
- 8.2. Market Analysis, Insights and Forecast - by Configuration
- 8.2.1. Single-Stage
- 8.2.2. Multi-Stage
- 8.1. Market Analysis, Insights and Forecast - by Type
- 9. Asia Pacific Reusable Launch Vehicles Market Analysis, Insights and Forecast, 2020-2032
- 9.1. Market Analysis, Insights and Forecast - by Type
- 9.1.1. Partially Reusable
- 9.1.2. Fully Reusable
- 9.2. Market Analysis, Insights and Forecast - by Configuration
- 9.2.1. Single-Stage
- 9.2.2. Multi-Stage
- 9.1. Market Analysis, Insights and Forecast - by Type
- 10. Latin America Reusable Launch Vehicles Market Analysis, Insights and Forecast, 2020-2032
- 10.1. Market Analysis, Insights and Forecast - by Type
- 10.1.1. Partially Reusable
- 10.1.2. Fully Reusable
- 10.2. Market Analysis, Insights and Forecast - by Configuration
- 10.2.1. Single-Stage
- 10.2.2. Multi-Stage
- 10.1. Market Analysis, Insights and Forecast - by Type
- 11. Middle East and Africa Reusable Launch Vehicles Market Analysis, Insights and Forecast, 2020-2032
- 11.1. Market Analysis, Insights and Forecast - by Type
- 11.1.1. Partially Reusable
- 11.1.2. Fully Reusable
- 11.2. Market Analysis, Insights and Forecast - by Configuration
- 11.2.1. Single-Stage
- 11.2.2. Multi-Stage
- 11.1. Market Analysis, Insights and Forecast - by Type
- 12. Competitive Analysis
- 12.1. Company Profiles
- 12.1.1 Space Exploration Technologies Corp
- 12.1.1.1. Company Overview
- 12.1.1.2. Products
- 12.1.1.3. Company Financials
- 12.1.1.4. SWOT Analysis
- 12.1.2 United Launch Alliance LLC
- 12.1.2.1. Company Overview
- 12.1.2.2. Products
- 12.1.2.3. Company Financials
- 12.1.2.4. SWOT Analysis
- 12.1.3 LinkSpace Aerospace Technology Group
- 12.1.3.1. Company Overview
- 12.1.3.2. Products
- 12.1.3.3. Company Financials
- 12.1.3.4. SWOT Analysis
- 12.1.4 China Aerospace Science and Technology Corp (CASC)
- 12.1.4.1. Company Overview
- 12.1.4.2. Products
- 12.1.4.3. Company Financials
- 12.1.4.4. SWOT Analysis
- 12.1.5 Blue Origin Enterprises L P
- 12.1.5.1. Company Overview
- 12.1.5.2. Products
- 12.1.5.3. Company Financials
- 12.1.5.4. SWOT Analysis
- 12.1.6 ArianeGroup
- 12.1.6.1. Company Overview
- 12.1.6.2. Products
- 12.1.6.3. Company Financials
- 12.1.6.4. SWOT Analysis
- 12.1.7 Deutsches Zentrum für Luft- und Raumfahrt e V (DLR
- 12.1.7.1. Company Overview
- 12.1.7.2. Products
- 12.1.7.3. Company Financials
- 12.1.7.4. SWOT Analysis
- 12.1.8 Indian Space Research Organisation (ISRO)
- 12.1.8.1. Company Overview
- 12.1.8.2. Products
- 12.1.8.3. Company Financials
- 12.1.8.4. SWOT Analysis
- 12.1.9 National Aeronautics and Space Administration (NASA)
- 12.1.9.1. Company Overview
- 12.1.9.2. Products
- 12.1.9.3. Company Financials
- 12.1.9.4. SWOT Analysis
- 12.1.1 Space Exploration Technologies Corp
- 12.2. Market Entropy
- 12.2.1 Company's Key Areas Served
- 12.2.2 Recent Developments
- 12.3. Company Market Share Analysis 2025
- 12.3.1 Top 5 Companies Market Share Analysis
- 12.3.2 Top 3 Companies Market Share Analysis
- 12.4. List of Potential Customers
- 13. Research Methodology
List of Figures
- Figure 1: Global Reusable Launch Vehicles Market Revenue Breakdown (Million, %) by Region 2025 & 2033
- Figure 2: North America Reusable Launch Vehicles Market Revenue (Million), by Type 2025 & 2033
- Figure 3: North America Reusable Launch Vehicles Market Revenue Share (%), by Type 2025 & 2033
- Figure 4: North America Reusable Launch Vehicles Market Revenue (Million), by Configuration 2025 & 2033
- Figure 5: North America Reusable Launch Vehicles Market Revenue Share (%), by Configuration 2025 & 2033
- Figure 6: North America Reusable Launch Vehicles Market Revenue (Million), by Country 2025 & 2033
- Figure 7: North America Reusable Launch Vehicles Market Revenue Share (%), by Country 2025 & 2033
- Figure 8: Europe Reusable Launch Vehicles Market Revenue (Million), by Type 2025 & 2033
- Figure 9: Europe Reusable Launch Vehicles Market Revenue Share (%), by Type 2025 & 2033
- Figure 10: Europe Reusable Launch Vehicles Market Revenue (Million), by Configuration 2025 & 2033
- Figure 11: Europe Reusable Launch Vehicles Market Revenue Share (%), by Configuration 2025 & 2033
- Figure 12: Europe Reusable Launch Vehicles Market Revenue (Million), by Country 2025 & 2033
- Figure 13: Europe Reusable Launch Vehicles Market Revenue Share (%), by Country 2025 & 2033
- Figure 14: Asia Pacific Reusable Launch Vehicles Market Revenue (Million), by Type 2025 & 2033
- Figure 15: Asia Pacific Reusable Launch Vehicles Market Revenue Share (%), by Type 2025 & 2033
- Figure 16: Asia Pacific Reusable Launch Vehicles Market Revenue (Million), by Configuration 2025 & 2033
- Figure 17: Asia Pacific Reusable Launch Vehicles Market Revenue Share (%), by Configuration 2025 & 2033
- Figure 18: Asia Pacific Reusable Launch Vehicles Market Revenue (Million), by Country 2025 & 2033
- Figure 19: Asia Pacific Reusable Launch Vehicles Market Revenue Share (%), by Country 2025 & 2033
- Figure 20: Latin America Reusable Launch Vehicles Market Revenue (Million), by Type 2025 & 2033
- Figure 21: Latin America Reusable Launch Vehicles Market Revenue Share (%), by Type 2025 & 2033
- Figure 22: Latin America Reusable Launch Vehicles Market Revenue (Million), by Configuration 2025 & 2033
- Figure 23: Latin America Reusable Launch Vehicles Market Revenue Share (%), by Configuration 2025 & 2033
- Figure 24: Latin America Reusable Launch Vehicles Market Revenue (Million), by Country 2025 & 2033
- Figure 25: Latin America Reusable Launch Vehicles Market Revenue Share (%), by Country 2025 & 2033
- Figure 26: Middle East and Africa Reusable Launch Vehicles Market Revenue (Million), by Type 2025 & 2033
- Figure 27: Middle East and Africa Reusable Launch Vehicles Market Revenue Share (%), by Type 2025 & 2033
- Figure 28: Middle East and Africa Reusable Launch Vehicles Market Revenue (Million), by Configuration 2025 & 2033
- Figure 29: Middle East and Africa Reusable Launch Vehicles Market Revenue Share (%), by Configuration 2025 & 2033
- Figure 30: Middle East and Africa Reusable Launch Vehicles Market Revenue (Million), by Country 2025 & 2033
- Figure 31: Middle East and Africa Reusable Launch Vehicles Market Revenue Share (%), by Country 2025 & 2033
List of Tables
- Table 1: Global Reusable Launch Vehicles Market Revenue Million Forecast, by Type 2020 & 2033
- Table 2: Global Reusable Launch Vehicles Market Revenue Million Forecast, by Configuration 2020 & 2033
- Table 3: Global Reusable Launch Vehicles Market Revenue Million Forecast, by Region 2020 & 2033
- Table 4: Global Reusable Launch Vehicles Market Revenue Million Forecast, by Type 2020 & 2033
- Table 5: Global Reusable Launch Vehicles Market Revenue Million Forecast, by Configuration 2020 & 2033
- Table 6: Global Reusable Launch Vehicles Market Revenue Million Forecast, by Country 2020 & 2033
- Table 7: North America Reusable Launch Vehicles Market Revenue (Million) Forecast, by Application 2020 & 2033
- Table 8: Canada Reusable Launch Vehicles Market Revenue (Million) Forecast, by Application 2020 & 2033
- Table 9: Global Reusable Launch Vehicles Market Revenue Million Forecast, by Type 2020 & 2033
- Table 10: Global Reusable Launch Vehicles Market Revenue Million Forecast, by Configuration 2020 & 2033
- Table 11: Global Reusable Launch Vehicles Market Revenue Million Forecast, by Country 2020 & 2033
- Table 12: United Kingdom Reusable Launch Vehicles Market Revenue (Million) Forecast, by Application 2020 & 2033
- Table 13: Germany Reusable Launch Vehicles Market Revenue (Million) Forecast, by Application 2020 & 2033
- Table 14: France Reusable Launch Vehicles Market Revenue (Million) Forecast, by Application 2020 & 2033
- Table 15: Italy Reusable Launch Vehicles Market Revenue (Million) Forecast, by Application 2020 & 2033
- Table 16: Russia Reusable Launch Vehicles Market Revenue (Million) Forecast, by Application 2020 & 2033
- Table 17: Rest of Europe Reusable Launch Vehicles Market Revenue (Million) Forecast, by Application 2020 & 2033
- Table 18: Global Reusable Launch Vehicles Market Revenue Million Forecast, by Type 2020 & 2033
- Table 19: Global Reusable Launch Vehicles Market Revenue Million Forecast, by Configuration 2020 & 2033
- Table 20: Global Reusable Launch Vehicles Market Revenue Million Forecast, by Country 2020 & 2033
- Table 21: China Reusable Launch Vehicles Market Revenue (Million) Forecast, by Application 2020 & 2033
- Table 22: India Reusable Launch Vehicles Market Revenue (Million) Forecast, by Application 2020 & 2033
- Table 23: Japan Reusable Launch Vehicles Market Revenue (Million) Forecast, by Application 2020 & 2033
- Table 24: South Korea Reusable Launch Vehicles Market Revenue (Million) Forecast, by Application 2020 & 2033
- Table 25: Rest of Asia Pacific Reusable Launch Vehicles Market Revenue (Million) Forecast, by Application 2020 & 2033
- Table 26: Global Reusable Launch Vehicles Market Revenue Million Forecast, by Type 2020 & 2033
- Table 27: Global Reusable Launch Vehicles Market Revenue Million Forecast, by Configuration 2020 & 2033
- Table 28: Global Reusable Launch Vehicles Market Revenue Million Forecast, by Country 2020 & 2033
- Table 29: Brazil Reusable Launch Vehicles Market Revenue (Million) Forecast, by Application 2020 & 2033
- Table 30: Mexico Reusable Launch Vehicles Market Revenue (Million) Forecast, by Application 2020 & 2033
- Table 31: Rest of Latin America Reusable Launch Vehicles Market Revenue (Million) Forecast, by Application 2020 & 2033
- Table 32: Global Reusable Launch Vehicles Market Revenue Million Forecast, by Type 2020 & 2033
- Table 33: Global Reusable Launch Vehicles Market Revenue Million Forecast, by Configuration 2020 & 2033
- Table 34: Global Reusable Launch Vehicles Market Revenue Million Forecast, by Country 2020 & 2033
- Table 35: Saudi Arabia Reusable Launch Vehicles Market Revenue (Million) Forecast, by Application 2020 & 2033
- Table 36: United Arab Emirates Reusable Launch Vehicles Market Revenue (Million) Forecast, by Application 2020 & 2033
- Table 37: Israel Reusable Launch Vehicles Market Revenue (Million) Forecast, by Application 2020 & 2033
- Table 38: South Africa Reusable Launch Vehicles Market Revenue (Million) Forecast, by Application 2020 & 2033
- Table 39: Rest of Middle East and Africa Reusable Launch Vehicles Market Revenue (Million) Forecast, by Application 2020 & 2033
Frequently Asked Questions
1. What is the projected Compound Annual Growth Rate (CAGR) of the Reusable Launch Vehicles Market?
The projected CAGR is approximately 11.65%.
2. Which companies are prominent players in the Reusable Launch Vehicles Market?
Key companies in the market include Space Exploration Technologies Corp, United Launch Alliance LLC, LinkSpace Aerospace Technology Group, China Aerospace Science and Technology Corp (CASC), Blue Origin Enterprises L P, ArianeGroup, Deutsches Zentrum für Luft- und Raumfahrt e V (DLR, Indian Space Research Organisation (ISRO), National Aeronautics and Space Administration (NASA).
3. What are the main segments of the Reusable Launch Vehicles Market?
The market segments include Type, Configuration.
4. Can you provide details about the market size?
The market size is estimated to be USD 3.05 Million as of 2022.
5. What are some drivers contributing to market growth?
N/A
6. What are the notable trends driving market growth?
Fully Reusable Launch Vehicles to hold the Largest Market Share in 2023.
7. Are there any restraints impacting market growth?
N/A
8. Can you provide examples of recent developments in the market?
N/A
9. What pricing options are available for accessing the report?
Pricing options include single-user, multi-user, and enterprise licenses priced at USD 4750, USD 5250, and USD 8750 respectively.
10. Is the market size provided in terms of value or volume?
The market size is provided in terms of value, measured in Million.
11. Are there any specific market keywords associated with the report?
Yes, the market keyword associated with the report is "Reusable Launch Vehicles Market," which aids in identifying and referencing the specific market segment covered.
12. How do I determine which pricing option suits my needs best?
The pricing options vary based on user requirements and access needs. Individual users may opt for single-user licenses, while businesses requiring broader access may choose multi-user or enterprise licenses for cost-effective access to the report.
13. Are there any additional resources or data provided in the Reusable Launch Vehicles Market report?
While the report offers comprehensive insights, it's advisable to review the specific contents or supplementary materials provided to ascertain if additional resources or data are available.
14. How can I stay updated on further developments or reports in the Reusable Launch Vehicles Market?
To stay informed about further developments, trends, and reports in the Reusable Launch Vehicles Market, consider subscribing to industry newsletters, following relevant companies and organizations, or regularly checking reputable industry news sources and publications.
Methodology
Step 1 - Identification of Relevant Samples Size from Population Database


Step 2 - Approaches for Defining Global Market Size (Value, Volume* & Price*)

Note*: In applicable scenarios
Step 3 - Data Sources
Primary Research
- Web Analytics
- Survey Reports
- Research Institute
- Latest Research Reports
- Opinion Leaders
Secondary Research
- Annual Reports
- White Paper
- Latest Press Release
- Industry Association
- Paid Database
- Investor Presentations

Step 4 - Data Triangulation
Involves using different sources of information in order to increase the validity of a study
These sources are likely to be stakeholders in a program - participants, other researchers, program staff, other community members, and so on.
Then we put all data in single framework & apply various statistical tools to find out the dynamic on the market.
During the analysis stage, feedback from the stakeholder groups would be compared to determine areas of agreement as well as areas of divergence