

Key Insights
The secure payment services market is experiencing robust growth, driven by the increasing adoption of digital payment methods, the expansion of e-commerce, and the rising concerns around data security and fraud prevention. A 9% CAGR suggests a significant market expansion, with the total market size likely exceeding $500 billion by 2025, considering the substantial investments and technological advancements in this sector. Key drivers include the proliferation of mobile payments, the increasing demand for contactless transactions, and the growing adoption of biometric authentication methods. Furthermore, the integration of advanced security technologies like tokenization and encryption is bolstering market growth, as businesses seek to mitigate risks associated with online transactions and protect sensitive customer data. The market is segmented by various payment methods (credit/debit cards, mobile wallets, digital wallets, etc.), transaction types, and deployment models (cloud-based, on-premise). Leading players like Adyen, Stripe, and PayPal are constantly innovating to maintain their competitive edge, incorporating AI and machine learning to enhance fraud detection and improve the overall user experience.
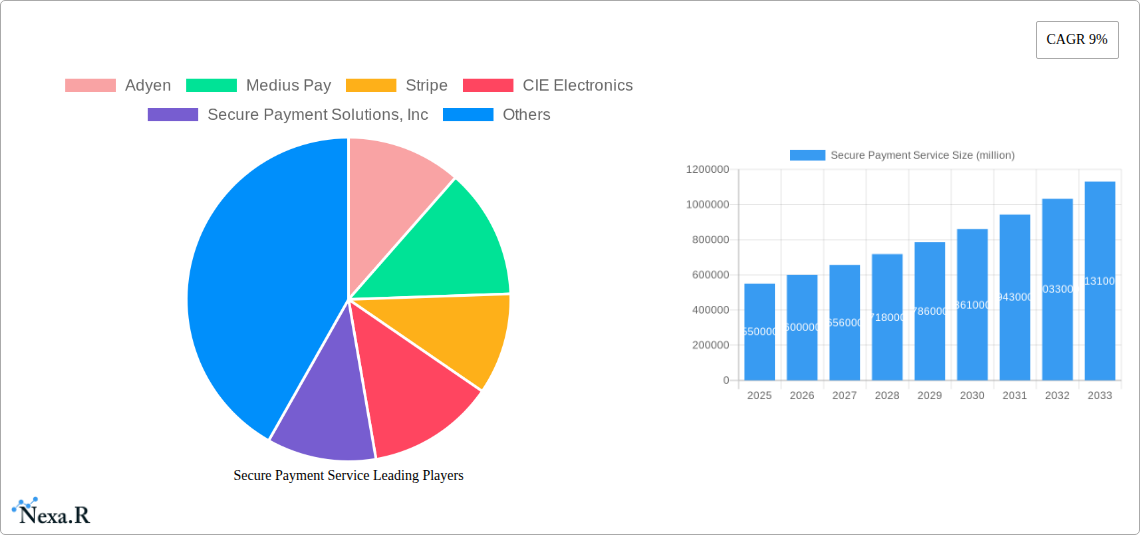
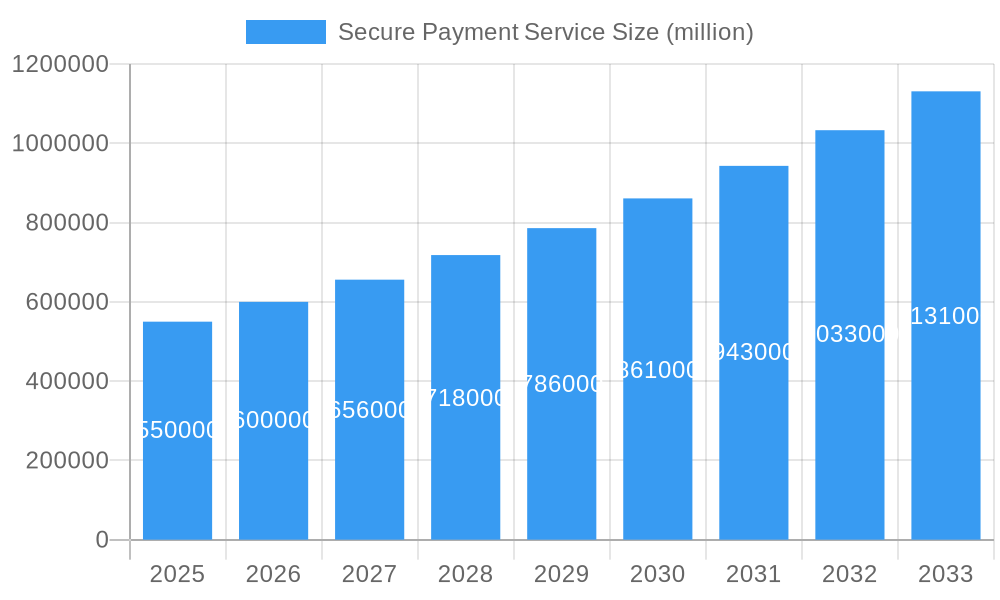
Secure Payment Service Market Size (In Billion)
The market's growth trajectory is expected to continue through 2033, although the rate of expansion might gradually moderate. Several factors could influence this, including regulatory changes in different regions impacting cross-border transactions, potential economic downturns influencing consumer spending, and the ongoing challenge of managing increasing cyber threats. The competitive landscape is characterized by both large established players and smaller niche providers. Consolidation through mergers and acquisitions is expected to continue, leading to a more concentrated market with a few dominant players. The focus on providing seamless, secure, and convenient payment experiences will be paramount for continued success in this evolving market. Growth opportunities are significant in emerging markets with rising internet penetration and increasing smartphone adoption.
Secure Payment Service Company Market Share
Secure Payment Service Market Report: 2019-2033
This comprehensive report provides an in-depth analysis of the Secure Payment Service market, encompassing historical data (2019-2024), current estimates (2025), and future forecasts (2025-2033). Targeting industry professionals, investors, and strategic planners, this report offers invaluable insights into market dynamics, growth trends, competitive landscapes, and emerging opportunities across various segments and geographies. The study period covers 2019-2033, with 2025 serving as both the base and estimated year.
Secure Payment Service Market Dynamics & Structure
This section analyzes the competitive landscape, technological advancements, regulatory influences, and market trends within the secure payment services industry. We explore market concentration, identifying key players and their market share (e.g., Stripe holding xx% in 2025). The report assesses the impact of technological innovations like tokenization and biometrics on market growth. Regulatory frameworks (e.g., PSD2, GDPR) and their influence on market structure are also examined. Furthermore, the report investigates the role of competitive substitutes (e.g., cash, checks) and analyzes end-user demographics and their preferences concerning payment methods. Finally, M&A activity within the sector is analyzed, including deal volumes (xx deals in 2024) and their impact on market consolidation.
- Market Concentration: High, with a few dominant players controlling a significant market share.
- Technological Innovation Drivers: Tokenization, biometrics, AI-powered fraud detection.
- Regulatory Frameworks: PSD2, GDPR, PCI DSS significantly impact market dynamics.
- Competitive Product Substitutes: Cash, checks, other traditional payment methods.
- End-User Demographics: Shift towards digital payments driven by millennials and Gen Z.
- M&A Trends: Consolidation through acquisitions and mergers to enhance market reach and technological capabilities.
Secure Payment Service Growth Trends & Insights
This section leverages extensive data analysis to illustrate the evolution of the secure payment service market. We present a detailed analysis of market size growth, adoption rates of secure payment solutions across various industry verticals, and the impact of technological disruptions and evolving consumer behavior. Specific metrics such as Compound Annual Growth Rate (CAGR) and market penetration rates across different segments are provided, offering quantitative insights into market performance (projected CAGR of xx% from 2025 to 2033, with a market size reaching xx million by 2033). The analysis encompasses the influence of factors such as mobile commerce, contactless payments, and the increasing adoption of digital wallets.
Dominant Regions, Countries, or Segments in Secure Payment Service
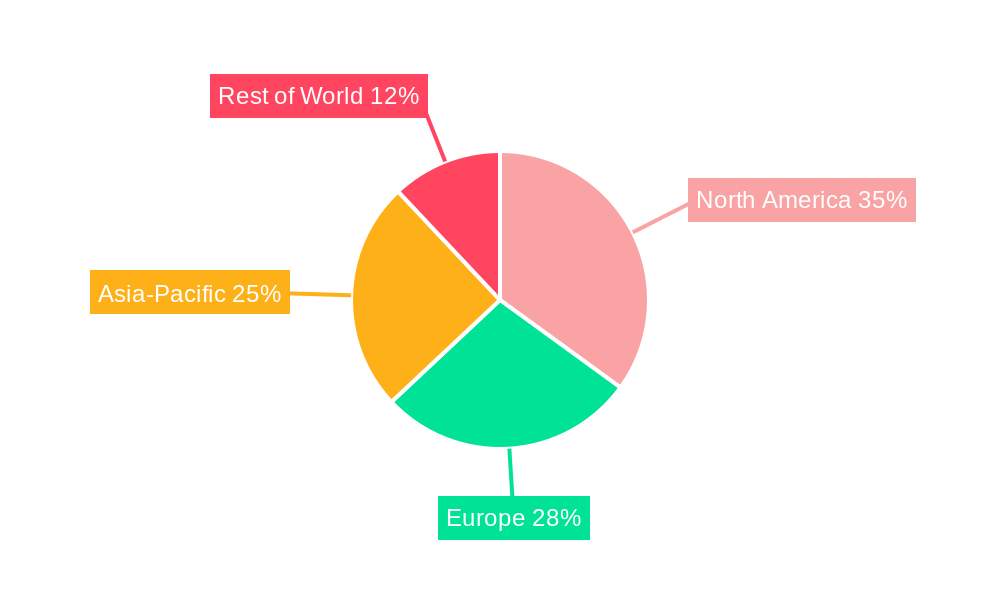
This section identifies the leading regions, countries, and market segments driving the growth of secure payment services. We analyze the factors contributing to market dominance, such as favorable economic policies, robust digital infrastructure, and consumer preference for specific payment methods. The report highlights the market share and growth potential of each dominant region, providing insights into future market expansion. North America (particularly the US) and Europe are expected to hold significant market shares in 2025, while Asia-Pacific is projected to witness the fastest growth during the forecast period.
- North America: Strong adoption of digital payments, advanced technology infrastructure.
- Europe: Stringent regulations driving innovation and security.
- Asia-Pacific: High growth potential driven by increasing smartphone penetration and e-commerce.
- Market Share Distribution: North America holds approximately xx%, Europe xx%, and Asia-Pacific xx% in 2025.
Secure Payment Service Product Landscape
This section offers a concise overview of secure payment service products, highlighting key innovations, applications, and performance metrics. The focus lies on the unique selling propositions and technological advancements that differentiate leading solutions in the market, such as improved security features, enhanced user experience, and integration with various platforms. The report examines the evolution of technologies like tokenization, biometric authentication, and fraud prevention mechanisms and their impact on product offerings.
Key Drivers, Barriers & Challenges in Secure Payment Service
This section analyzes the key factors driving market growth and the challenges inhibiting its expansion. Drivers include increasing e-commerce adoption, rising demand for secure online transactions, and government initiatives promoting digital payments. Challenges include stringent regulatory compliance, concerns regarding data privacy and security, and the potential for fraud and cyberattacks. The quantitative impact of these challenges on market growth is assessed.
- Key Drivers: Growth of e-commerce, increased smartphone penetration, government initiatives.
- Challenges: Regulatory compliance, data security concerns, cybersecurity threats (estimated xx million in losses due to fraud in 2024).
Emerging Opportunities in Secure Payment Service
This section outlines emerging trends and opportunities in the secure payment services market. These include the expansion into untapped markets, innovative applications like blockchain technology for secure transactions, and evolving consumer preferences for seamless and personalized payment experiences. The focus is on identifying new market segments and innovative solutions with high growth potential.
Growth Accelerators in the Secure Payment Service Industry
This section identifies key catalysts for long-term market growth, emphasizing technological advancements, strategic partnerships, and market expansion strategies. The focus is on highlighting factors that will drive sustained market expansion in the coming years. Examples include the adoption of 5G technology, the growth of the Internet of Things (IoT), and collaborations between financial institutions and technology providers.
Key Players Shaping the Secure Payment Service Market
- Adyen
- Medius Pay
- Stripe
- CIE Electronics
- Secure Payment Solutions, Inc
- TSYS
- Coupa
- Nium
- Ingram Micro Services
- STMicroelectronics
- EMVCo
- MagTek
- UL Solutions
- Payoneer
- Braintree
- CyberSource
- Elavon
- TokenEx
- Ingenico ePayments
- Intelligent Payments
- GEOBRIDGE
- Shift4
- Transaction Network Services (TNS)
Notable Milestones in Secure Payment Service Sector
- 2020-Q3: Increased adoption of contactless payments due to COVID-19 pandemic.
- 2021-Q4: Launch of several new biometric authentication solutions.
- 2022-Q1: Significant M&A activity in the secure payment services sector.
- 2023-Q2: Introduction of new regulations impacting data privacy and security.
In-Depth Secure Payment Service Market Outlook
The secure payment service market is poised for significant growth driven by technological innovation, increasing digitalization, and expanding e-commerce. Strategic partnerships between technology providers and financial institutions will further accelerate market expansion. The focus on enhanced security measures and user experience will be critical for attracting and retaining customers in a competitive landscape. The market is expected to maintain a healthy growth trajectory throughout the forecast period, with opportunities for both established players and new entrants.
Secure Payment Service Segmentation
-
1. Application
- 1.1. Enterprise
- 1.2. Personal
- 1.3. Others
-
2. Type
- 2.1. Online Banking
- 2.2. Credit Card
- 2.3. Electronic Wallet
- 2.4. Others
Secure Payment Service Segmentation By Geography
-
1. North America
- 1.1. United States
- 1.2. Canada
- 1.3. Mexico
-
2. South America
- 2.1. Brazil
- 2.2. Argentina
- 2.3. Rest of South America
-
3. Europe
- 3.1. United Kingdom
- 3.2. Germany
- 3.3. France
- 3.4. Italy
- 3.5. Spain
- 3.6. Russia
- 3.7. Benelux
- 3.8. Nordics
- 3.9. Rest of Europe
-
4. Middle East & Africa
- 4.1. Turkey
- 4.2. Israel
- 4.3. GCC
- 4.4. North Africa
- 4.5. South Africa
- 4.6. Rest of Middle East & Africa
-
5. Asia Pacific
- 5.1. China
- 5.2. India
- 5.3. Japan
- 5.4. South Korea
- 5.5. ASEAN
- 5.6. Oceania
- 5.7. Rest of Asia Pacific
Secure Payment Service Regional Market Share
Geographic Coverage of Secure Payment Service
Secure Payment Service REPORT HIGHLIGHTS
| Aspects | Details |
|---|---|
| Study Period | 2020-2034 |
| Base Year | 2025 |
| Estimated Year | 2026 |
| Forecast Period | 2026-2034 |
| Historical Period | 2020-2025 |
| Growth Rate | CAGR of 9% from 2020-2034 |
| Segmentation |
|
Table of Contents
- 1. Introduction
- 1.1. Research Scope
- 1.2. Market Segmentation
- 1.3. Research Methodology
- 1.4. Definitions and Assumptions
- 2. Executive Summary
- 2.1. Introduction
- 3. Market Dynamics
- 3.1. Introduction
- 3.2. Market Drivers
- 3.3. Market Restrains
- 3.4. Market Trends
- 4. Market Factor Analysis
- 4.1. Porters Five Forces
- 4.2. Supply/Value Chain
- 4.3. PESTEL analysis
- 4.4. Market Entropy
- 4.5. Patent/Trademark Analysis
- 5. Global Secure Payment Service Analysis, Insights and Forecast, 2020-2032
- 5.1. Market Analysis, Insights and Forecast - by Application
- 5.1.1. Enterprise
- 5.1.2. Personal
- 5.1.3. Others
- 5.2. Market Analysis, Insights and Forecast - by Type
- 5.2.1. Online Banking
- 5.2.2. Credit Card
- 5.2.3. Electronic Wallet
- 5.2.4. Others
- 5.3. Market Analysis, Insights and Forecast - by Region
- 5.3.1. North America
- 5.3.2. South America
- 5.3.3. Europe
- 5.3.4. Middle East & Africa
- 5.3.5. Asia Pacific
- 5.1. Market Analysis, Insights and Forecast - by Application
- 6. North America Secure Payment Service Analysis, Insights and Forecast, 2020-2032
- 6.1. Market Analysis, Insights and Forecast - by Application
- 6.1.1. Enterprise
- 6.1.2. Personal
- 6.1.3. Others
- 6.2. Market Analysis, Insights and Forecast - by Type
- 6.2.1. Online Banking
- 6.2.2. Credit Card
- 6.2.3. Electronic Wallet
- 6.2.4. Others
- 6.1. Market Analysis, Insights and Forecast - by Application
- 7. South America Secure Payment Service Analysis, Insights and Forecast, 2020-2032
- 7.1. Market Analysis, Insights and Forecast - by Application
- 7.1.1. Enterprise
- 7.1.2. Personal
- 7.1.3. Others
- 7.2. Market Analysis, Insights and Forecast - by Type
- 7.2.1. Online Banking
- 7.2.2. Credit Card
- 7.2.3. Electronic Wallet
- 7.2.4. Others
- 7.1. Market Analysis, Insights and Forecast - by Application
- 8. Europe Secure Payment Service Analysis, Insights and Forecast, 2020-2032
- 8.1. Market Analysis, Insights and Forecast - by Application
- 8.1.1. Enterprise
- 8.1.2. Personal
- 8.1.3. Others
- 8.2. Market Analysis, Insights and Forecast - by Type
- 8.2.1. Online Banking
- 8.2.2. Credit Card
- 8.2.3. Electronic Wallet
- 8.2.4. Others
- 8.1. Market Analysis, Insights and Forecast - by Application
- 9. Middle East & Africa Secure Payment Service Analysis, Insights and Forecast, 2020-2032
- 9.1. Market Analysis, Insights and Forecast - by Application
- 9.1.1. Enterprise
- 9.1.2. Personal
- 9.1.3. Others
- 9.2. Market Analysis, Insights and Forecast - by Type
- 9.2.1. Online Banking
- 9.2.2. Credit Card
- 9.2.3. Electronic Wallet
- 9.2.4. Others
- 9.1. Market Analysis, Insights and Forecast - by Application
- 10. Asia Pacific Secure Payment Service Analysis, Insights and Forecast, 2020-2032
- 10.1. Market Analysis, Insights and Forecast - by Application
- 10.1.1. Enterprise
- 10.1.2. Personal
- 10.1.3. Others
- 10.2. Market Analysis, Insights and Forecast - by Type
- 10.2.1. Online Banking
- 10.2.2. Credit Card
- 10.2.3. Electronic Wallet
- 10.2.4. Others
- 10.1. Market Analysis, Insights and Forecast - by Application
- 11. Competitive Analysis
- 11.1. Global Market Share Analysis 2025
- 11.2. Company Profiles
- 11.2.1 Adyen
- 11.2.1.1. Overview
- 11.2.1.2. Products
- 11.2.1.3. SWOT Analysis
- 11.2.1.4. Recent Developments
- 11.2.1.5. Financials (Based on Availability)
- 11.2.2 Medius Pay
- 11.2.2.1. Overview
- 11.2.2.2. Products
- 11.2.2.3. SWOT Analysis
- 11.2.2.4. Recent Developments
- 11.2.2.5. Financials (Based on Availability)
- 11.2.3 Stripe
- 11.2.3.1. Overview
- 11.2.3.2. Products
- 11.2.3.3. SWOT Analysis
- 11.2.3.4. Recent Developments
- 11.2.3.5. Financials (Based on Availability)
- 11.2.4 CIE Electronics
- 11.2.4.1. Overview
- 11.2.4.2. Products
- 11.2.4.3. SWOT Analysis
- 11.2.4.4. Recent Developments
- 11.2.4.5. Financials (Based on Availability)
- 11.2.5 Secure Payment Solutions Inc
- 11.2.5.1. Overview
- 11.2.5.2. Products
- 11.2.5.3. SWOT Analysis
- 11.2.5.4. Recent Developments
- 11.2.5.5. Financials (Based on Availability)
- 11.2.6 TSYS
- 11.2.6.1. Overview
- 11.2.6.2. Products
- 11.2.6.3. SWOT Analysis
- 11.2.6.4. Recent Developments
- 11.2.6.5. Financials (Based on Availability)
- 11.2.7 Coupa
- 11.2.7.1. Overview
- 11.2.7.2. Products
- 11.2.7.3. SWOT Analysis
- 11.2.7.4. Recent Developments
- 11.2.7.5. Financials (Based on Availability)
- 11.2.8 Nium
- 11.2.8.1. Overview
- 11.2.8.2. Products
- 11.2.8.3. SWOT Analysis
- 11.2.8.4. Recent Developments
- 11.2.8.5. Financials (Based on Availability)
- 11.2.9 Ingram Micro Services
- 11.2.9.1. Overview
- 11.2.9.2. Products
- 11.2.9.3. SWOT Analysis
- 11.2.9.4. Recent Developments
- 11.2.9.5. Financials (Based on Availability)
- 11.2.10 STMicroelectronics
- 11.2.10.1. Overview
- 11.2.10.2. Products
- 11.2.10.3. SWOT Analysis
- 11.2.10.4. Recent Developments
- 11.2.10.5. Financials (Based on Availability)
- 11.2.11 EMVCo
- 11.2.11.1. Overview
- 11.2.11.2. Products
- 11.2.11.3. SWOT Analysis
- 11.2.11.4. Recent Developments
- 11.2.11.5. Financials (Based on Availability)
- 11.2.12 MagTek
- 11.2.12.1. Overview
- 11.2.12.2. Products
- 11.2.12.3. SWOT Analysis
- 11.2.12.4. Recent Developments
- 11.2.12.5. Financials (Based on Availability)
- 11.2.13 UL Solutions
- 11.2.13.1. Overview
- 11.2.13.2. Products
- 11.2.13.3. SWOT Analysis
- 11.2.13.4. Recent Developments
- 11.2.13.5. Financials (Based on Availability)
- 11.2.14 Payoneer
- 11.2.14.1. Overview
- 11.2.14.2. Products
- 11.2.14.3. SWOT Analysis
- 11.2.14.4. Recent Developments
- 11.2.14.5. Financials (Based on Availability)
- 11.2.15 Braintree
- 11.2.15.1. Overview
- 11.2.15.2. Products
- 11.2.15.3. SWOT Analysis
- 11.2.15.4. Recent Developments
- 11.2.15.5. Financials (Based on Availability)
- 11.2.16 CyberSource
- 11.2.16.1. Overview
- 11.2.16.2. Products
- 11.2.16.3. SWOT Analysis
- 11.2.16.4. Recent Developments
- 11.2.16.5. Financials (Based on Availability)
- 11.2.17 Elavon
- 11.2.17.1. Overview
- 11.2.17.2. Products
- 11.2.17.3. SWOT Analysis
- 11.2.17.4. Recent Developments
- 11.2.17.5. Financials (Based on Availability)
- 11.2.18 TokenEx
- 11.2.18.1. Overview
- 11.2.18.2. Products
- 11.2.18.3. SWOT Analysis
- 11.2.18.4. Recent Developments
- 11.2.18.5. Financials (Based on Availability)
- 11.2.19 Ingenico ePayments
- 11.2.19.1. Overview
- 11.2.19.2. Products
- 11.2.19.3. SWOT Analysis
- 11.2.19.4. Recent Developments
- 11.2.19.5. Financials (Based on Availability)
- 11.2.20 Intelligent Payments
- 11.2.20.1. Overview
- 11.2.20.2. Products
- 11.2.20.3. SWOT Analysis
- 11.2.20.4. Recent Developments
- 11.2.20.5. Financials (Based on Availability)
- 11.2.21 GEOBRIDGE
- 11.2.21.1. Overview
- 11.2.21.2. Products
- 11.2.21.3. SWOT Analysis
- 11.2.21.4. Recent Developments
- 11.2.21.5. Financials (Based on Availability)
- 11.2.22 Shift4
- 11.2.22.1. Overview
- 11.2.22.2. Products
- 11.2.22.3. SWOT Analysis
- 11.2.22.4. Recent Developments
- 11.2.22.5. Financials (Based on Availability)
- 11.2.23 Transaction Network Services (TNS)
- 11.2.23.1. Overview
- 11.2.23.2. Products
- 11.2.23.3. SWOT Analysis
- 11.2.23.4. Recent Developments
- 11.2.23.5. Financials (Based on Availability)
- 11.2.1 Adyen
List of Figures
- Figure 1: Global Secure Payment Service Revenue Breakdown (million, %) by Region 2025 & 2033
- Figure 2: North America Secure Payment Service Revenue (million), by Application 2025 & 2033
- Figure 3: North America Secure Payment Service Revenue Share (%), by Application 2025 & 2033
- Figure 4: North America Secure Payment Service Revenue (million), by Type 2025 & 2033
- Figure 5: North America Secure Payment Service Revenue Share (%), by Type 2025 & 2033
- Figure 6: North America Secure Payment Service Revenue (million), by Country 2025 & 2033
- Figure 7: North America Secure Payment Service Revenue Share (%), by Country 2025 & 2033
- Figure 8: South America Secure Payment Service Revenue (million), by Application 2025 & 2033
- Figure 9: South America Secure Payment Service Revenue Share (%), by Application 2025 & 2033
- Figure 10: South America Secure Payment Service Revenue (million), by Type 2025 & 2033
- Figure 11: South America Secure Payment Service Revenue Share (%), by Type 2025 & 2033
- Figure 12: South America Secure Payment Service Revenue (million), by Country 2025 & 2033
- Figure 13: South America Secure Payment Service Revenue Share (%), by Country 2025 & 2033
- Figure 14: Europe Secure Payment Service Revenue (million), by Application 2025 & 2033
- Figure 15: Europe Secure Payment Service Revenue Share (%), by Application 2025 & 2033
- Figure 16: Europe Secure Payment Service Revenue (million), by Type 2025 & 2033
- Figure 17: Europe Secure Payment Service Revenue Share (%), by Type 2025 & 2033
- Figure 18: Europe Secure Payment Service Revenue (million), by Country 2025 & 2033
- Figure 19: Europe Secure Payment Service Revenue Share (%), by Country 2025 & 2033
- Figure 20: Middle East & Africa Secure Payment Service Revenue (million), by Application 2025 & 2033
- Figure 21: Middle East & Africa Secure Payment Service Revenue Share (%), by Application 2025 & 2033
- Figure 22: Middle East & Africa Secure Payment Service Revenue (million), by Type 2025 & 2033
- Figure 23: Middle East & Africa Secure Payment Service Revenue Share (%), by Type 2025 & 2033
- Figure 24: Middle East & Africa Secure Payment Service Revenue (million), by Country 2025 & 2033
- Figure 25: Middle East & Africa Secure Payment Service Revenue Share (%), by Country 2025 & 2033
- Figure 26: Asia Pacific Secure Payment Service Revenue (million), by Application 2025 & 2033
- Figure 27: Asia Pacific Secure Payment Service Revenue Share (%), by Application 2025 & 2033
- Figure 28: Asia Pacific Secure Payment Service Revenue (million), by Type 2025 & 2033
- Figure 29: Asia Pacific Secure Payment Service Revenue Share (%), by Type 2025 & 2033
- Figure 30: Asia Pacific Secure Payment Service Revenue (million), by Country 2025 & 2033
- Figure 31: Asia Pacific Secure Payment Service Revenue Share (%), by Country 2025 & 2033
List of Tables
- Table 1: Global Secure Payment Service Revenue million Forecast, by Application 2020 & 2033
- Table 2: Global Secure Payment Service Revenue million Forecast, by Type 2020 & 2033
- Table 3: Global Secure Payment Service Revenue million Forecast, by Region 2020 & 2033
- Table 4: Global Secure Payment Service Revenue million Forecast, by Application 2020 & 2033
- Table 5: Global Secure Payment Service Revenue million Forecast, by Type 2020 & 2033
- Table 6: Global Secure Payment Service Revenue million Forecast, by Country 2020 & 2033
- Table 7: United States Secure Payment Service Revenue (million) Forecast, by Application 2020 & 2033
- Table 8: Canada Secure Payment Service Revenue (million) Forecast, by Application 2020 & 2033
- Table 9: Mexico Secure Payment Service Revenue (million) Forecast, by Application 2020 & 2033
- Table 10: Global Secure Payment Service Revenue million Forecast, by Application 2020 & 2033
- Table 11: Global Secure Payment Service Revenue million Forecast, by Type 2020 & 2033
- Table 12: Global Secure Payment Service Revenue million Forecast, by Country 2020 & 2033
- Table 13: Brazil Secure Payment Service Revenue (million) Forecast, by Application 2020 & 2033
- Table 14: Argentina Secure Payment Service Revenue (million) Forecast, by Application 2020 & 2033
- Table 15: Rest of South America Secure Payment Service Revenue (million) Forecast, by Application 2020 & 2033
- Table 16: Global Secure Payment Service Revenue million Forecast, by Application 2020 & 2033
- Table 17: Global Secure Payment Service Revenue million Forecast, by Type 2020 & 2033
- Table 18: Global Secure Payment Service Revenue million Forecast, by Country 2020 & 2033
- Table 19: United Kingdom Secure Payment Service Revenue (million) Forecast, by Application 2020 & 2033
- Table 20: Germany Secure Payment Service Revenue (million) Forecast, by Application 2020 & 2033
- Table 21: France Secure Payment Service Revenue (million) Forecast, by Application 2020 & 2033
- Table 22: Italy Secure Payment Service Revenue (million) Forecast, by Application 2020 & 2033
- Table 23: Spain Secure Payment Service Revenue (million) Forecast, by Application 2020 & 2033
- Table 24: Russia Secure Payment Service Revenue (million) Forecast, by Application 2020 & 2033
- Table 25: Benelux Secure Payment Service Revenue (million) Forecast, by Application 2020 & 2033
- Table 26: Nordics Secure Payment Service Revenue (million) Forecast, by Application 2020 & 2033
- Table 27: Rest of Europe Secure Payment Service Revenue (million) Forecast, by Application 2020 & 2033
- Table 28: Global Secure Payment Service Revenue million Forecast, by Application 2020 & 2033
- Table 29: Global Secure Payment Service Revenue million Forecast, by Type 2020 & 2033
- Table 30: Global Secure Payment Service Revenue million Forecast, by Country 2020 & 2033
- Table 31: Turkey Secure Payment Service Revenue (million) Forecast, by Application 2020 & 2033
- Table 32: Israel Secure Payment Service Revenue (million) Forecast, by Application 2020 & 2033
- Table 33: GCC Secure Payment Service Revenue (million) Forecast, by Application 2020 & 2033
- Table 34: North Africa Secure Payment Service Revenue (million) Forecast, by Application 2020 & 2033
- Table 35: South Africa Secure Payment Service Revenue (million) Forecast, by Application 2020 & 2033
- Table 36: Rest of Middle East & Africa Secure Payment Service Revenue (million) Forecast, by Application 2020 & 2033
- Table 37: Global Secure Payment Service Revenue million Forecast, by Application 2020 & 2033
- Table 38: Global Secure Payment Service Revenue million Forecast, by Type 2020 & 2033
- Table 39: Global Secure Payment Service Revenue million Forecast, by Country 2020 & 2033
- Table 40: China Secure Payment Service Revenue (million) Forecast, by Application 2020 & 2033
- Table 41: India Secure Payment Service Revenue (million) Forecast, by Application 2020 & 2033
- Table 42: Japan Secure Payment Service Revenue (million) Forecast, by Application 2020 & 2033
- Table 43: South Korea Secure Payment Service Revenue (million) Forecast, by Application 2020 & 2033
- Table 44: ASEAN Secure Payment Service Revenue (million) Forecast, by Application 2020 & 2033
- Table 45: Oceania Secure Payment Service Revenue (million) Forecast, by Application 2020 & 2033
- Table 46: Rest of Asia Pacific Secure Payment Service Revenue (million) Forecast, by Application 2020 & 2033
Frequently Asked Questions
1. What is the projected Compound Annual Growth Rate (CAGR) of the Secure Payment Service?
The projected CAGR is approximately 9%.
2. Which companies are prominent players in the Secure Payment Service?
Key companies in the market include Adyen, Medius Pay, Stripe, CIE Electronics, Secure Payment Solutions, Inc, TSYS, Coupa, Nium, Ingram Micro Services, STMicroelectronics, EMVCo, MagTek, UL Solutions, Payoneer, Braintree, CyberSource, Elavon, TokenEx, Ingenico ePayments, Intelligent Payments, GEOBRIDGE, Shift4, Transaction Network Services (TNS).
3. What are the main segments of the Secure Payment Service?
The market segments include Application, Type.
4. Can you provide details about the market size?
The market size is estimated to be USD XXX million as of 2022.
5. What are some drivers contributing to market growth?
N/A
6. What are the notable trends driving market growth?
N/A
7. Are there any restraints impacting market growth?
N/A
8. Can you provide examples of recent developments in the market?
N/A
9. What pricing options are available for accessing the report?
Pricing options include single-user, multi-user, and enterprise licenses priced at USD 3950.00, USD 5925.00, and USD 7900.00 respectively.
10. Is the market size provided in terms of value or volume?
The market size is provided in terms of value, measured in million.
11. Are there any specific market keywords associated with the report?
Yes, the market keyword associated with the report is "Secure Payment Service," which aids in identifying and referencing the specific market segment covered.
12. How do I determine which pricing option suits my needs best?
The pricing options vary based on user requirements and access needs. Individual users may opt for single-user licenses, while businesses requiring broader access may choose multi-user or enterprise licenses for cost-effective access to the report.
13. Are there any additional resources or data provided in the Secure Payment Service report?
While the report offers comprehensive insights, it's advisable to review the specific contents or supplementary materials provided to ascertain if additional resources or data are available.
14. How can I stay updated on further developments or reports in the Secure Payment Service?
To stay informed about further developments, trends, and reports in the Secure Payment Service, consider subscribing to industry newsletters, following relevant companies and organizations, or regularly checking reputable industry news sources and publications.
Methodology
Step 1 - Identification of Relevant Samples Size from Population Database


Step 2 - Approaches for Defining Global Market Size (Value, Volume* & Price*)

Note*: In applicable scenarios
Step 3 - Data Sources
Primary Research
- Web Analytics
- Survey Reports
- Research Institute
- Latest Research Reports
- Opinion Leaders
Secondary Research
- Annual Reports
- White Paper
- Latest Press Release
- Industry Association
- Paid Database
- Investor Presentations

Step 4 - Data Triangulation
Involves using different sources of information in order to increase the validity of a study
These sources are likely to be stakeholders in a program - participants, other researchers, program staff, other community members, and so on.
Then we put all data in single framework & apply various statistical tools to find out the dynamic on the market.
During the analysis stage, feedback from the stakeholder groups would be compared to determine areas of agreement as well as areas of divergence