

Key Insights
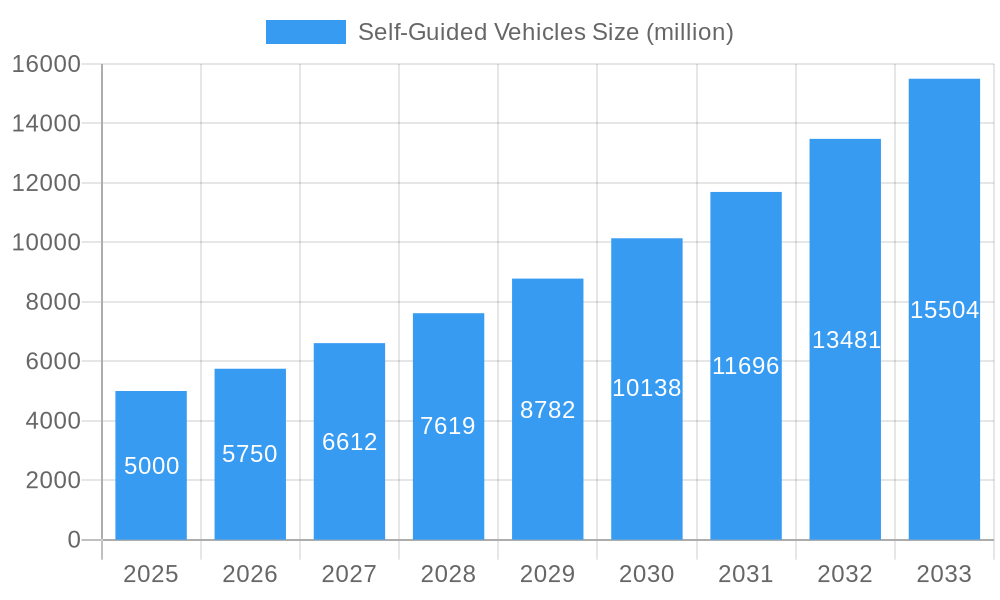
The global Self-Guided Vehicle (SGV) market is experiencing robust growth, driven by the increasing demand for automation in warehousing, manufacturing, and logistics. The market, estimated at $5 billion in 2025, is projected to witness a Compound Annual Growth Rate (CAGR) of 15% from 2025 to 2033, reaching approximately $15 billion by the end of the forecast period. This expansion is fueled by several key factors: the rising adoption of e-commerce, leading to increased warehouse automation needs; the growing need for improved efficiency and reduced operational costs in various industries; and advancements in SGV technology, such as improved navigation systems, payload capacity, and battery life. Furthermore, the integration of SGVs with other technologies, like warehouse management systems (WMS) and robotics, is enhancing their capabilities and driving wider adoption. Leading players like Daifuku, Dematic, Swisslog, and others are actively investing in R&D and strategic partnerships to strengthen their market positions and cater to the growing demand.
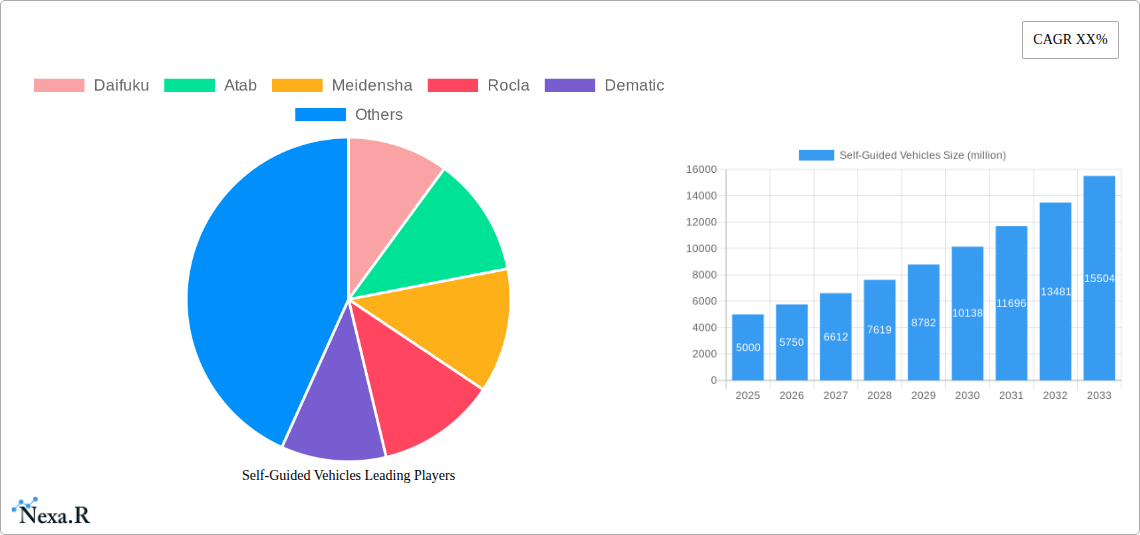
Self-Guided Vehicles Market Size (In Billion)
However, market growth faces some restraints. High initial investment costs associated with implementing SGV systems can be a deterrent for smaller businesses. Concerns related to system integration complexity, potential safety risks, and the need for skilled labor to manage and maintain these systems also pose challenges. Nevertheless, the long-term benefits of increased productivity, reduced labor costs, and improved operational efficiency are expected to outweigh these limitations, further fueling the market's expansion. Segmentation within the market is primarily driven by vehicle type (e.g., autonomous mobile robots (AMRs), automated guided vehicles (AGVs)), application (e.g., warehousing, manufacturing), and geographical region. North America and Europe currently hold significant market shares, but the Asia-Pacific region is poised for substantial growth in the coming years due to rapid industrialization and rising e-commerce activities.
Self-Guided Vehicles Company Market Share
Self-Guided Vehicles Market Report: 2019-2033
This comprehensive report provides an in-depth analysis of the Self-Guided Vehicles (SGV) market, encompassing market dynamics, growth trends, regional analysis, product landscape, key players, and future outlook. The report covers the period from 2019 to 2033, with a focus on the forecast period of 2025-2033 and a base year of 2025. This crucial market intelligence is designed for industry professionals, investors, and strategists seeking a clear understanding of this rapidly evolving sector, encompassing both the parent market of automated material handling equipment and the child market of autonomous mobile robots (AMRs). The market size is projected to reach xx million units by 2033.
Self-Guided Vehicles Market Dynamics & Structure
This section analyzes the competitive landscape, technological advancements, and regulatory influences shaping the SGV market. We delve into market concentration, identifying key players and their market share, alongside M&A activity within the sector. The analysis also considers the impact of substitute technologies and evolving end-user demographics.
- Market Concentration: The market is moderately concentrated, with the top 5 players holding approximately xx% of the market share in 2025. This is expected to shift slightly by 2033.
- Technological Innovation: Technological advancements, including improved navigation systems, AI-powered decision-making, and enhanced safety features are key drivers. Innovation barriers include high initial investment costs and integration complexities.
- Regulatory Framework: Government regulations regarding safety and data privacy are increasingly influencing market growth. Regional variations in these regulations impact adoption rates.
- Competitive Substitutes: Traditional material handling methods pose a competitive challenge, although SGVs are increasingly favored for their efficiency gains.
- End-User Demographics: The primary end-users are warehousing and logistics companies, manufacturing plants, and e-commerce fulfillment centers. The growth of e-commerce is a significant driver.
- M&A Trends: The past five years have seen xx M&A deals in the SGV sector, reflecting consolidation and expansion strategies among key players.
Self-Guided Vehicles Growth Trends & Insights
This section provides a detailed analysis of SGV market size evolution, adoption rates, technological disruptions, and shifting consumer behavior. We utilize various analytical methodologies, including market penetration rate analysis and CAGR calculations, to deliver actionable insights.
The SGV market experienced significant growth during the historical period (2019-2024), with a CAGR of xx%. This growth is projected to continue during the forecast period (2025-2033), with an estimated CAGR of xx%. Factors driving this growth include the increasing demand for automation in various industries, coupled with advancements in robotics and AI technologies. The market penetration rate is expected to reach xx% by 2033. Technological advancements like improved sensor technology and sophisticated navigation systems are further accelerating the adoption of SGVs across industries. The shift towards e-commerce and the need for efficient order fulfillment are key drivers impacting consumer behavior and, consequently, market growth.
Dominant Regions, Countries, or Segments in Self-Guided Vehicles
This section identifies the leading regions, countries, and segments driving SGV market growth. We analyze market share and growth potential in detail, highlighting key factors contributing to regional dominance.
- North America: North America is currently the dominant region, driven by strong demand from e-commerce and robust manufacturing sectors. Supportive government policies and advanced infrastructure contribute significantly.
- Europe: Europe is experiencing substantial growth, boosted by increasing automation adoption in logistics and manufacturing. The region's focus on Industry 4.0 initiatives drives further SGV adoption.
- Asia-Pacific: The Asia-Pacific region shows strong potential for future growth, fueled by rising labor costs and increasing investments in automation.
Self-Guided Vehicles Product Landscape
The SGV market offers a diverse range of products, categorized by payload capacity, navigation technology, and functionalities. Innovations focus on improved safety features, enhanced navigation precision, and increased operational efficiency. Unique selling propositions include features such as fleet management systems, remote monitoring capabilities, and integration with existing warehouse management systems. Technological advancements like LiDAR, cameras, and inertial measurement units (IMUs) provide greater accuracy and reliability for navigation.
Key Drivers, Barriers & Challenges in Self-Guided Vehicles
Key Drivers:
The market is driven by factors such as increasing labor costs, rising demand for efficient warehouse operations, growing e-commerce, and technological advancements (AI, improved sensors). Government initiatives promoting automation also contribute significantly.
Key Challenges and Restraints:
High initial investment costs, integration complexities, safety concerns, and potential job displacement are key challenges hindering market growth. Supply chain disruptions can impact the availability of components, and regulatory hurdles differ across regions, impacting adoption rates. Competition from traditional material handling methods and the need for skilled labor for implementation also pose challenges.
Emerging Opportunities in Self-Guided Vehicles
Emerging opportunities lie in the expansion into new sectors, such as healthcare and agriculture. The development of collaborative robots (cobots) that can work alongside human workers and the integration of SGVs with other automated systems present significant potential. The growing focus on sustainability and the development of energy-efficient SGVs also offer new avenues for growth.
Growth Accelerators in the Self-Guided Vehicles Industry
Technological advancements, particularly in AI and robotics, are significant growth catalysts. Strategic partnerships between SGV manufacturers and logistics companies will drive broader adoption. Expansion into new geographical markets and vertical integration within the supply chain also contribute to accelerating growth.
Notable Milestones in Self-Guided Vehicles Sector
- 2020: Launch of AI-powered navigation system by Daifuku.
- 2021: Swisslog announces strategic partnership with a major e-commerce company.
- 2022: Dematic acquires a smaller SGV manufacturer, expanding its product portfolio.
- 2023: Introduction of a new generation of energy-efficient SGVs by Meidensha.
In-Depth Self-Guided Vehicles Market Outlook
The SGV market is poised for significant growth in the coming years, driven by technological advancements, increased automation demand, and expansion into new sectors. Strategic partnerships and investments in research and development will play a crucial role in shaping the future of the industry. The market's potential is substantial, with opportunities for both established players and new entrants. Focusing on innovation, addressing key challenges, and adapting to evolving market needs will be vital for success.
Self-Guided Vehicles Segmentation
-
1. Application
- 1.1. Automotive
- 1.2. Beverage
- 1.3. Chemicals
-
2. Types
- 2.1. Unit Load Type
- 2.2. Tugger Type
Self-Guided Vehicles Segmentation By Geography
-
1. North America
- 1.1. United States
- 1.2. Canada
- 1.3. Mexico
-
2. South America
- 2.1. Brazil
- 2.2. Argentina
- 2.3. Rest of South America
-
3. Europe
- 3.1. United Kingdom
- 3.2. Germany
- 3.3. France
- 3.4. Italy
- 3.5. Spain
- 3.6. Russia
- 3.7. Benelux
- 3.8. Nordics
- 3.9. Rest of Europe
-
4. Middle East & Africa
- 4.1. Turkey
- 4.2. Israel
- 4.3. GCC
- 4.4. North Africa
- 4.5. South Africa
- 4.6. Rest of Middle East & Africa
-
5. Asia Pacific
- 5.1. China
- 5.2. India
- 5.3. Japan
- 5.4. South Korea
- 5.5. ASEAN
- 5.6. Oceania
- 5.7. Rest of Asia Pacific

Self-Guided Vehicles Regional Market Share
Geographic Coverage of Self-Guided Vehicles
Self-Guided Vehicles REPORT HIGHLIGHTS
| Aspects | Details |
|---|---|
| Study Period | 2020-2034 |
| Base Year | 2025 |
| Estimated Year | 2026 |
| Forecast Period | 2026-2034 |
| Historical Period | 2020-2025 |
| Growth Rate | CAGR of XX% from 2020-2034 |
| Segmentation |
|
Table of Contents
- 1. Introduction
- 1.1. Research Scope
- 1.2. Market Segmentation
- 1.3. Research Objective
- 1.4. Definitions and Assumptions
- 2. Executive Summary
- 2.1. Market Snapshot
- 3. Market Dynamics
- 3.1. Market Drivers
- 3.2. Market Restrains
- 3.3. Market Trends
- 3.4. Market Opportunities
- 4. Market Factor Analysis
- 4.1. Porters Five Forces
- 4.1.1. Bargaining Power of Suppliers
- 4.1.2. Bargaining Power of Buyers
- 4.1.3. Threat of New Entrants
- 4.1.4. Threat of Substitutes
- 4.1.5. Competitive Rivalry
- 4.2. PESTEL analysis
- 4.3. BCG Analysis
- 4.3.1. Stars (High Growth, High Market Share)
- 4.3.2. Cash Cows (Low Growth, High Market Share)
- 4.3.3. Question Mark (High Growth, Low Market Share)
- 4.3.4. Dogs (Low Growth, Low Market Share)
- 4.4. Ansoff Matrix Analysis
- 4.5. Supply Chain Analysis
- 4.6. Regulatory Landscape
- 4.7. Current Market Potential and Opportunity Assessment (TAM–SAM–SOM Framework)
- 4.8. NRP Analyst Note
- 4.1. Porters Five Forces
- 5. Market Analysis, Insights and Forecast 2021-2033
- 5.1. Market Analysis, Insights and Forecast - by Application
- 5.1.1. Automotive
- 5.1.2. Beverage
- 5.1.3. Chemicals
- 5.2. Market Analysis, Insights and Forecast - by Types
- 5.2.1. Unit Load Type
- 5.2.2. Tugger Type
- 5.3. Market Analysis, Insights and Forecast - by Region
- 5.3.1. North America
- 5.3.2. South America
- 5.3.3. Europe
- 5.3.4. Middle East & Africa
- 5.3.5. Asia Pacific
- 5.1. Market Analysis, Insights and Forecast - by Application
- 6. Global Self-Guided Vehicles Analysis, Insights and Forecast, 2021-2033
- 6.1. Market Analysis, Insights and Forecast - by Application
- 6.1.1. Automotive
- 6.1.2. Beverage
- 6.1.3. Chemicals
- 6.2. Market Analysis, Insights and Forecast - by Types
- 6.2.1. Unit Load Type
- 6.2.2. Tugger Type
- 6.1. Market Analysis, Insights and Forecast - by Application
- 7. North America Self-Guided Vehicles Analysis, Insights and Forecast, 2020-2032
- 7.1. Market Analysis, Insights and Forecast - by Application
- 7.1.1. Automotive
- 7.1.2. Beverage
- 7.1.3. Chemicals
- 7.2. Market Analysis, Insights and Forecast - by Types
- 7.2.1. Unit Load Type
- 7.2.2. Tugger Type
- 7.1. Market Analysis, Insights and Forecast - by Application
- 8. South America Self-Guided Vehicles Analysis, Insights and Forecast, 2020-2032
- 8.1. Market Analysis, Insights and Forecast - by Application
- 8.1.1. Automotive
- 8.1.2. Beverage
- 8.1.3. Chemicals
- 8.2. Market Analysis, Insights and Forecast - by Types
- 8.2.1. Unit Load Type
- 8.2.2. Tugger Type
- 8.1. Market Analysis, Insights and Forecast - by Application
- 9. Europe Self-Guided Vehicles Analysis, Insights and Forecast, 2020-2032
- 9.1. Market Analysis, Insights and Forecast - by Application
- 9.1.1. Automotive
- 9.1.2. Beverage
- 9.1.3. Chemicals
- 9.2. Market Analysis, Insights and Forecast - by Types
- 9.2.1. Unit Load Type
- 9.2.2. Tugger Type
- 9.1. Market Analysis, Insights and Forecast - by Application
- 10. Middle East & Africa Self-Guided Vehicles Analysis, Insights and Forecast, 2020-2032
- 10.1. Market Analysis, Insights and Forecast - by Application
- 10.1.1. Automotive
- 10.1.2. Beverage
- 10.1.3. Chemicals
- 10.2. Market Analysis, Insights and Forecast - by Types
- 10.2.1. Unit Load Type
- 10.2.2. Tugger Type
- 10.1. Market Analysis, Insights and Forecast - by Application
- 11. Asia Pacific Self-Guided Vehicles Analysis, Insights and Forecast, 2020-2032
- 11.1. Market Analysis, Insights and Forecast - by Application
- 11.1.1. Automotive
- 11.1.2. Beverage
- 11.1.3. Chemicals
- 11.2. Market Analysis, Insights and Forecast - by Types
- 11.2.1. Unit Load Type
- 11.2.2. Tugger Type
- 11.1. Market Analysis, Insights and Forecast - by Application
- 12. Competitive Analysis
- 12.1. Company Profiles
- 12.1.1 Daifuku
- 12.1.1.1. Company Overview
- 12.1.1.2. Products
- 12.1.1.3. Company Financials
- 12.1.1.4. SWOT Analysis
- 12.1.2 Atab
- 12.1.2.1. Company Overview
- 12.1.2.2. Products
- 12.1.2.3. Company Financials
- 12.1.2.4. SWOT Analysis
- 12.1.3 Meidensha
- 12.1.3.1. Company Overview
- 12.1.3.2. Products
- 12.1.3.3. Company Financials
- 12.1.3.4. SWOT Analysis
- 12.1.4 Rocla
- 12.1.4.1. Company Overview
- 12.1.4.2. Products
- 12.1.4.3. Company Financials
- 12.1.4.4. SWOT Analysis
- 12.1.5 Dematic
- 12.1.5.1. Company Overview
- 12.1.5.2. Products
- 12.1.5.3. Company Financials
- 12.1.5.4. SWOT Analysis
- 12.1.6 Dematic
- 12.1.6.1. Company Overview
- 12.1.6.2. Products
- 12.1.6.3. Company Financials
- 12.1.6.4. SWOT Analysis
- 12.1.7 Swisslog
- 12.1.7.1. Company Overview
- 12.1.7.2. Products
- 12.1.7.3. Company Financials
- 12.1.7.4. SWOT Analysis
- 12.1.8 Aichikikai
- 12.1.8.1. Company Overview
- 12.1.8.2. Products
- 12.1.8.3. Company Financials
- 12.1.8.4. SWOT Analysis
- 12.1.9 JBT
- 12.1.9.1. Company Overview
- 12.1.9.2. Products
- 12.1.9.3. Company Financials
- 12.1.9.4. SWOT Analysis
- 12.1.10 DS Automotion
- 12.1.10.1. Company Overview
- 12.1.10.2. Products
- 12.1.10.3. Company Financials
- 12.1.10.4. SWOT Analysis
- 12.1.1 Daifuku
- 12.2. Market Entropy
- 12.2.1 Company's Key Areas Served
- 12.2.2 Recent Developments
- 12.3. Company Market Share Analysis 2025
- 12.3.1 Top 5 Companies Market Share Analysis
- 12.3.2 Top 3 Companies Market Share Analysis
- 12.4. List of Potential Customers
- 13. Research Methodology
List of Figures
- Figure 1: Global Self-Guided Vehicles Revenue Breakdown (million, %) by Region 2025 & 2033
- Figure 2: Global Self-Guided Vehicles Volume Breakdown (K, %) by Region 2025 & 2033
- Figure 3: North America Self-Guided Vehicles Revenue (million), by Application 2025 & 2033
- Figure 4: North America Self-Guided Vehicles Volume (K), by Application 2025 & 2033
- Figure 5: North America Self-Guided Vehicles Revenue Share (%), by Application 2025 & 2033
- Figure 6: North America Self-Guided Vehicles Volume Share (%), by Application 2025 & 2033
- Figure 7: North America Self-Guided Vehicles Revenue (million), by Types 2025 & 2033
- Figure 8: North America Self-Guided Vehicles Volume (K), by Types 2025 & 2033
- Figure 9: North America Self-Guided Vehicles Revenue Share (%), by Types 2025 & 2033
- Figure 10: North America Self-Guided Vehicles Volume Share (%), by Types 2025 & 2033
- Figure 11: North America Self-Guided Vehicles Revenue (million), by Country 2025 & 2033
- Figure 12: North America Self-Guided Vehicles Volume (K), by Country 2025 & 2033
- Figure 13: North America Self-Guided Vehicles Revenue Share (%), by Country 2025 & 2033
- Figure 14: North America Self-Guided Vehicles Volume Share (%), by Country 2025 & 2033
- Figure 15: South America Self-Guided Vehicles Revenue (million), by Application 2025 & 2033
- Figure 16: South America Self-Guided Vehicles Volume (K), by Application 2025 & 2033
- Figure 17: South America Self-Guided Vehicles Revenue Share (%), by Application 2025 & 2033
- Figure 18: South America Self-Guided Vehicles Volume Share (%), by Application 2025 & 2033
- Figure 19: South America Self-Guided Vehicles Revenue (million), by Types 2025 & 2033
- Figure 20: South America Self-Guided Vehicles Volume (K), by Types 2025 & 2033
- Figure 21: South America Self-Guided Vehicles Revenue Share (%), by Types 2025 & 2033
- Figure 22: South America Self-Guided Vehicles Volume Share (%), by Types 2025 & 2033
- Figure 23: South America Self-Guided Vehicles Revenue (million), by Country 2025 & 2033
- Figure 24: South America Self-Guided Vehicles Volume (K), by Country 2025 & 2033
- Figure 25: South America Self-Guided Vehicles Revenue Share (%), by Country 2025 & 2033
- Figure 26: South America Self-Guided Vehicles Volume Share (%), by Country 2025 & 2033
- Figure 27: Europe Self-Guided Vehicles Revenue (million), by Application 2025 & 2033
- Figure 28: Europe Self-Guided Vehicles Volume (K), by Application 2025 & 2033
- Figure 29: Europe Self-Guided Vehicles Revenue Share (%), by Application 2025 & 2033
- Figure 30: Europe Self-Guided Vehicles Volume Share (%), by Application 2025 & 2033
- Figure 31: Europe Self-Guided Vehicles Revenue (million), by Types 2025 & 2033
- Figure 32: Europe Self-Guided Vehicles Volume (K), by Types 2025 & 2033
- Figure 33: Europe Self-Guided Vehicles Revenue Share (%), by Types 2025 & 2033
- Figure 34: Europe Self-Guided Vehicles Volume Share (%), by Types 2025 & 2033
- Figure 35: Europe Self-Guided Vehicles Revenue (million), by Country 2025 & 2033
- Figure 36: Europe Self-Guided Vehicles Volume (K), by Country 2025 & 2033
- Figure 37: Europe Self-Guided Vehicles Revenue Share (%), by Country 2025 & 2033
- Figure 38: Europe Self-Guided Vehicles Volume Share (%), by Country 2025 & 2033
- Figure 39: Middle East & Africa Self-Guided Vehicles Revenue (million), by Application 2025 & 2033
- Figure 40: Middle East & Africa Self-Guided Vehicles Volume (K), by Application 2025 & 2033
- Figure 41: Middle East & Africa Self-Guided Vehicles Revenue Share (%), by Application 2025 & 2033
- Figure 42: Middle East & Africa Self-Guided Vehicles Volume Share (%), by Application 2025 & 2033
- Figure 43: Middle East & Africa Self-Guided Vehicles Revenue (million), by Types 2025 & 2033
- Figure 44: Middle East & Africa Self-Guided Vehicles Volume (K), by Types 2025 & 2033
- Figure 45: Middle East & Africa Self-Guided Vehicles Revenue Share (%), by Types 2025 & 2033
- Figure 46: Middle East & Africa Self-Guided Vehicles Volume Share (%), by Types 2025 & 2033
- Figure 47: Middle East & Africa Self-Guided Vehicles Revenue (million), by Country 2025 & 2033
- Figure 48: Middle East & Africa Self-Guided Vehicles Volume (K), by Country 2025 & 2033
- Figure 49: Middle East & Africa Self-Guided Vehicles Revenue Share (%), by Country 2025 & 2033
- Figure 50: Middle East & Africa Self-Guided Vehicles Volume Share (%), by Country 2025 & 2033
- Figure 51: Asia Pacific Self-Guided Vehicles Revenue (million), by Application 2025 & 2033
- Figure 52: Asia Pacific Self-Guided Vehicles Volume (K), by Application 2025 & 2033
- Figure 53: Asia Pacific Self-Guided Vehicles Revenue Share (%), by Application 2025 & 2033
- Figure 54: Asia Pacific Self-Guided Vehicles Volume Share (%), by Application 2025 & 2033
- Figure 55: Asia Pacific Self-Guided Vehicles Revenue (million), by Types 2025 & 2033
- Figure 56: Asia Pacific Self-Guided Vehicles Volume (K), by Types 2025 & 2033
- Figure 57: Asia Pacific Self-Guided Vehicles Revenue Share (%), by Types 2025 & 2033
- Figure 58: Asia Pacific Self-Guided Vehicles Volume Share (%), by Types 2025 & 2033
- Figure 59: Asia Pacific Self-Guided Vehicles Revenue (million), by Country 2025 & 2033
- Figure 60: Asia Pacific Self-Guided Vehicles Volume (K), by Country 2025 & 2033
- Figure 61: Asia Pacific Self-Guided Vehicles Revenue Share (%), by Country 2025 & 2033
- Figure 62: Asia Pacific Self-Guided Vehicles Volume Share (%), by Country 2025 & 2033
List of Tables
- Table 1: Global Self-Guided Vehicles Revenue million Forecast, by Application 2020 & 2033
- Table 2: Global Self-Guided Vehicles Volume K Forecast, by Application 2020 & 2033
- Table 3: Global Self-Guided Vehicles Revenue million Forecast, by Types 2020 & 2033
- Table 4: Global Self-Guided Vehicles Volume K Forecast, by Types 2020 & 2033
- Table 5: Global Self-Guided Vehicles Revenue million Forecast, by Region 2020 & 2033
- Table 6: Global Self-Guided Vehicles Volume K Forecast, by Region 2020 & 2033
- Table 7: Global Self-Guided Vehicles Revenue million Forecast, by Application 2020 & 2033
- Table 8: Global Self-Guided Vehicles Volume K Forecast, by Application 2020 & 2033
- Table 9: Global Self-Guided Vehicles Revenue million Forecast, by Types 2020 & 2033
- Table 10: Global Self-Guided Vehicles Volume K Forecast, by Types 2020 & 2033
- Table 11: Global Self-Guided Vehicles Revenue million Forecast, by Country 2020 & 2033
- Table 12: Global Self-Guided Vehicles Volume K Forecast, by Country 2020 & 2033
- Table 13: United States Self-Guided Vehicles Revenue (million) Forecast, by Application 2020 & 2033
- Table 14: United States Self-Guided Vehicles Volume (K) Forecast, by Application 2020 & 2033
- Table 15: Canada Self-Guided Vehicles Revenue (million) Forecast, by Application 2020 & 2033
- Table 16: Canada Self-Guided Vehicles Volume (K) Forecast, by Application 2020 & 2033
- Table 17: Mexico Self-Guided Vehicles Revenue (million) Forecast, by Application 2020 & 2033
- Table 18: Mexico Self-Guided Vehicles Volume (K) Forecast, by Application 2020 & 2033
- Table 19: Global Self-Guided Vehicles Revenue million Forecast, by Application 2020 & 2033
- Table 20: Global Self-Guided Vehicles Volume K Forecast, by Application 2020 & 2033
- Table 21: Global Self-Guided Vehicles Revenue million Forecast, by Types 2020 & 2033
- Table 22: Global Self-Guided Vehicles Volume K Forecast, by Types 2020 & 2033
- Table 23: Global Self-Guided Vehicles Revenue million Forecast, by Country 2020 & 2033
- Table 24: Global Self-Guided Vehicles Volume K Forecast, by Country 2020 & 2033
- Table 25: Brazil Self-Guided Vehicles Revenue (million) Forecast, by Application 2020 & 2033
- Table 26: Brazil Self-Guided Vehicles Volume (K) Forecast, by Application 2020 & 2033
- Table 27: Argentina Self-Guided Vehicles Revenue (million) Forecast, by Application 2020 & 2033
- Table 28: Argentina Self-Guided Vehicles Volume (K) Forecast, by Application 2020 & 2033
- Table 29: Rest of South America Self-Guided Vehicles Revenue (million) Forecast, by Application 2020 & 2033
- Table 30: Rest of South America Self-Guided Vehicles Volume (K) Forecast, by Application 2020 & 2033
- Table 31: Global Self-Guided Vehicles Revenue million Forecast, by Application 2020 & 2033
- Table 32: Global Self-Guided Vehicles Volume K Forecast, by Application 2020 & 2033
- Table 33: Global Self-Guided Vehicles Revenue million Forecast, by Types 2020 & 2033
- Table 34: Global Self-Guided Vehicles Volume K Forecast, by Types 2020 & 2033
- Table 35: Global Self-Guided Vehicles Revenue million Forecast, by Country 2020 & 2033
- Table 36: Global Self-Guided Vehicles Volume K Forecast, by Country 2020 & 2033
- Table 37: United Kingdom Self-Guided Vehicles Revenue (million) Forecast, by Application 2020 & 2033
- Table 38: United Kingdom Self-Guided Vehicles Volume (K) Forecast, by Application 2020 & 2033
- Table 39: Germany Self-Guided Vehicles Revenue (million) Forecast, by Application 2020 & 2033
- Table 40: Germany Self-Guided Vehicles Volume (K) Forecast, by Application 2020 & 2033
- Table 41: France Self-Guided Vehicles Revenue (million) Forecast, by Application 2020 & 2033
- Table 42: France Self-Guided Vehicles Volume (K) Forecast, by Application 2020 & 2033
- Table 43: Italy Self-Guided Vehicles Revenue (million) Forecast, by Application 2020 & 2033
- Table 44: Italy Self-Guided Vehicles Volume (K) Forecast, by Application 2020 & 2033
- Table 45: Spain Self-Guided Vehicles Revenue (million) Forecast, by Application 2020 & 2033
- Table 46: Spain Self-Guided Vehicles Volume (K) Forecast, by Application 2020 & 2033
- Table 47: Russia Self-Guided Vehicles Revenue (million) Forecast, by Application 2020 & 2033
- Table 48: Russia Self-Guided Vehicles Volume (K) Forecast, by Application 2020 & 2033
- Table 49: Benelux Self-Guided Vehicles Revenue (million) Forecast, by Application 2020 & 2033
- Table 50: Benelux Self-Guided Vehicles Volume (K) Forecast, by Application 2020 & 2033
- Table 51: Nordics Self-Guided Vehicles Revenue (million) Forecast, by Application 2020 & 2033
- Table 52: Nordics Self-Guided Vehicles Volume (K) Forecast, by Application 2020 & 2033
- Table 53: Rest of Europe Self-Guided Vehicles Revenue (million) Forecast, by Application 2020 & 2033
- Table 54: Rest of Europe Self-Guided Vehicles Volume (K) Forecast, by Application 2020 & 2033
- Table 55: Global Self-Guided Vehicles Revenue million Forecast, by Application 2020 & 2033
- Table 56: Global Self-Guided Vehicles Volume K Forecast, by Application 2020 & 2033
- Table 57: Global Self-Guided Vehicles Revenue million Forecast, by Types 2020 & 2033
- Table 58: Global Self-Guided Vehicles Volume K Forecast, by Types 2020 & 2033
- Table 59: Global Self-Guided Vehicles Revenue million Forecast, by Country 2020 & 2033
- Table 60: Global Self-Guided Vehicles Volume K Forecast, by Country 2020 & 2033
- Table 61: Turkey Self-Guided Vehicles Revenue (million) Forecast, by Application 2020 & 2033
- Table 62: Turkey Self-Guided Vehicles Volume (K) Forecast, by Application 2020 & 2033
- Table 63: Israel Self-Guided Vehicles Revenue (million) Forecast, by Application 2020 & 2033
- Table 64: Israel Self-Guided Vehicles Volume (K) Forecast, by Application 2020 & 2033
- Table 65: GCC Self-Guided Vehicles Revenue (million) Forecast, by Application 2020 & 2033
- Table 66: GCC Self-Guided Vehicles Volume (K) Forecast, by Application 2020 & 2033
- Table 67: North Africa Self-Guided Vehicles Revenue (million) Forecast, by Application 2020 & 2033
- Table 68: North Africa Self-Guided Vehicles Volume (K) Forecast, by Application 2020 & 2033
- Table 69: South Africa Self-Guided Vehicles Revenue (million) Forecast, by Application 2020 & 2033
- Table 70: South Africa Self-Guided Vehicles Volume (K) Forecast, by Application 2020 & 2033
- Table 71: Rest of Middle East & Africa Self-Guided Vehicles Revenue (million) Forecast, by Application 2020 & 2033
- Table 72: Rest of Middle East & Africa Self-Guided Vehicles Volume (K) Forecast, by Application 2020 & 2033
- Table 73: Global Self-Guided Vehicles Revenue million Forecast, by Application 2020 & 2033
- Table 74: Global Self-Guided Vehicles Volume K Forecast, by Application 2020 & 2033
- Table 75: Global Self-Guided Vehicles Revenue million Forecast, by Types 2020 & 2033
- Table 76: Global Self-Guided Vehicles Volume K Forecast, by Types 2020 & 2033
- Table 77: Global Self-Guided Vehicles Revenue million Forecast, by Country 2020 & 2033
- Table 78: Global Self-Guided Vehicles Volume K Forecast, by Country 2020 & 2033
- Table 79: China Self-Guided Vehicles Revenue (million) Forecast, by Application 2020 & 2033
- Table 80: China Self-Guided Vehicles Volume (K) Forecast, by Application 2020 & 2033
- Table 81: India Self-Guided Vehicles Revenue (million) Forecast, by Application 2020 & 2033
- Table 82: India Self-Guided Vehicles Volume (K) Forecast, by Application 2020 & 2033
- Table 83: Japan Self-Guided Vehicles Revenue (million) Forecast, by Application 2020 & 2033
- Table 84: Japan Self-Guided Vehicles Volume (K) Forecast, by Application 2020 & 2033
- Table 85: South Korea Self-Guided Vehicles Revenue (million) Forecast, by Application 2020 & 2033
- Table 86: South Korea Self-Guided Vehicles Volume (K) Forecast, by Application 2020 & 2033
- Table 87: ASEAN Self-Guided Vehicles Revenue (million) Forecast, by Application 2020 & 2033
- Table 88: ASEAN Self-Guided Vehicles Volume (K) Forecast, by Application 2020 & 2033
- Table 89: Oceania Self-Guided Vehicles Revenue (million) Forecast, by Application 2020 & 2033
- Table 90: Oceania Self-Guided Vehicles Volume (K) Forecast, by Application 2020 & 2033
- Table 91: Rest of Asia Pacific Self-Guided Vehicles Revenue (million) Forecast, by Application 2020 & 2033
- Table 92: Rest of Asia Pacific Self-Guided Vehicles Volume (K) Forecast, by Application 2020 & 2033
Frequently Asked Questions
1. What is the projected Compound Annual Growth Rate (CAGR) of the Self-Guided Vehicles?
The projected CAGR is approximately XX%.
2. Which companies are prominent players in the Self-Guided Vehicles?
Key companies in the market include Daifuku, Atab, Meidensha, Rocla, Dematic, Dematic, Swisslog, Aichikikai, JBT, DS Automotion.
3. What are the main segments of the Self-Guided Vehicles?
The market segments include Application, Types.
4. Can you provide details about the market size?
The market size is estimated to be USD XXX million as of 2022.
5. What are some drivers contributing to market growth?
N/A
6. What are the notable trends driving market growth?
N/A
7. Are there any restraints impacting market growth?
N/A
8. Can you provide examples of recent developments in the market?
N/A
9. What pricing options are available for accessing the report?
Pricing options include single-user, multi-user, and enterprise licenses priced at USD 3350.00, USD 5025.00, and USD 6700.00 respectively.
10. Is the market size provided in terms of value or volume?
The market size is provided in terms of value, measured in million and volume, measured in K.
11. Are there any specific market keywords associated with the report?
Yes, the market keyword associated with the report is "Self-Guided Vehicles," which aids in identifying and referencing the specific market segment covered.
12. How do I determine which pricing option suits my needs best?
The pricing options vary based on user requirements and access needs. Individual users may opt for single-user licenses, while businesses requiring broader access may choose multi-user or enterprise licenses for cost-effective access to the report.
13. Are there any additional resources or data provided in the Self-Guided Vehicles report?
While the report offers comprehensive insights, it's advisable to review the specific contents or supplementary materials provided to ascertain if additional resources or data are available.
14. How can I stay updated on further developments or reports in the Self-Guided Vehicles?
To stay informed about further developments, trends, and reports in the Self-Guided Vehicles, consider subscribing to industry newsletters, following relevant companies and organizations, or regularly checking reputable industry news sources and publications.
Methodology
Step 1 - Identification of Relevant Samples Size from Population Database


Step 2 - Approaches for Defining Global Market Size (Value, Volume* & Price*)

Note*: In applicable scenarios
Step 3 - Data Sources
Primary Research
- Web Analytics
- Survey Reports
- Research Institute
- Latest Research Reports
- Opinion Leaders
Secondary Research
- Annual Reports
- White Paper
- Latest Press Release
- Industry Association
- Paid Database
- Investor Presentations

Step 4 - Data Triangulation
Involves using different sources of information in order to increase the validity of a study
These sources are likely to be stakeholders in a program - participants, other researchers, program staff, other community members, and so on.
Then we put all data in single framework & apply various statistical tools to find out the dynamic on the market.
During the analysis stage, feedback from the stakeholder groups would be compared to determine areas of agreement as well as areas of divergence