

Key Insights
The global shoulder-fired missiles market is projected for significant expansion, reaching an estimated valuation of $13.81 billion by 2025, with a projected Compound Annual Growth Rate (CAGR) of 10.99% between 2025 and 2033. This growth is propelled by escalating geopolitical instability and regional conflicts, driving demand for advanced anti-tank and anti-aircraft solutions. Defense modernization initiatives worldwide, emphasizing lightweight and sophisticated systems, also contribute to market expansion. Technological advancements in guidance systems, enhancing accuracy and range, are pivotal factors. The market is segmented by range, assembly type, and technology, with guided missiles expected to lead due to superior precision. North America and Europe currently dominate the market, supported by substantial defense budgets, while the Asia-Pacific region is anticipated to exhibit robust growth driven by increased defense investments.
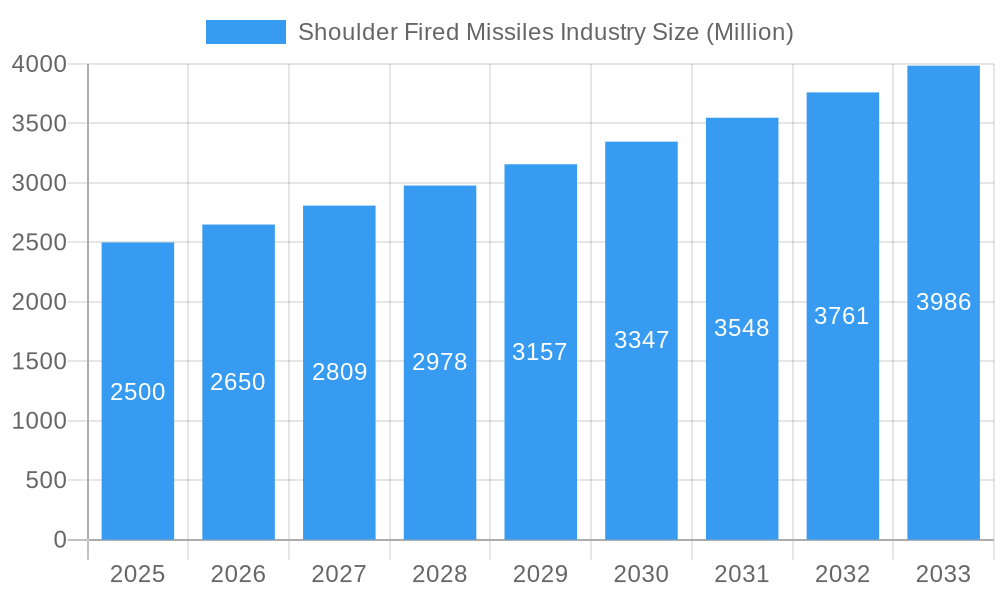
Shoulder Fired Missiles Industry Market Size (In Billion)
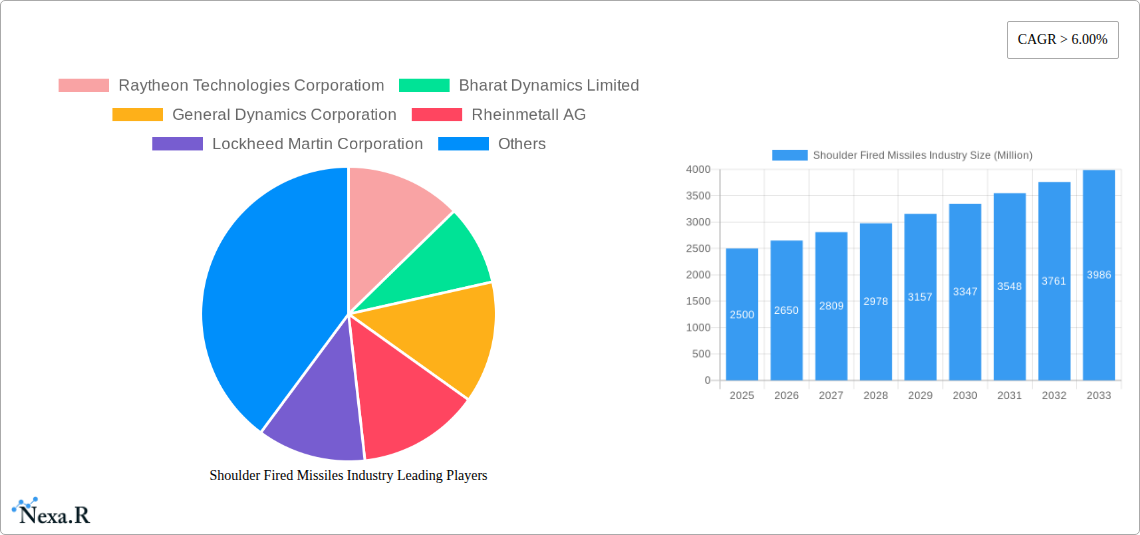
Key market restraints include stringent export controls and high production costs. Despite these challenges, the long-term outlook remains optimistic. Continuous development of advanced missile systems, integration of AI and improved seeker technologies, and the persistent demand for asymmetric warfare capabilities will sustain market growth. Leading industry players, including Raytheon Technologies, Bharat Dynamics Limited, General Dynamics, Rheinmetall, Lockheed Martin, MBDA, Rafael Advanced Defense Systems, AirTronic USA, BAE Systems, Saab, and ROKETSAN, are actively investing in research and development and expanding their offerings. Intense competition fuels innovation in performance, reliability, and cost-effectiveness, suggesting potential market consolidation through mergers and acquisitions.
Shoulder Fired Missiles Industry Company Market Share
Shoulder Fired Missiles Industry Market Report: 2019-2033
This comprehensive report provides a detailed analysis of the Shoulder Fired Missiles industry, encompassing market dynamics, growth trends, regional dominance, product landscape, key players, and future outlook. The study period covers 2019-2033, with 2025 as the base and estimated year. The forecast period is 2025-2033, and the historical period is 2019-2024. The report segments the market by range (short, medium, long), assembly type (projectile, launcher), and technology (guided, unguided). The total market size in 2025 is estimated at xx Million units.
Shoulder Fired Missiles Industry Market Dynamics & Structure
The shoulder-fired missiles market is characterized by a moderately concentrated landscape, with key players holding significant market share. Technological innovation, driven by advancements in guidance systems and propulsion technology, is a crucial factor. Stringent regulatory frameworks governing the production, export, and use of these weapons significantly impact market dynamics. Competition from alternative weapon systems, such as drones and precision-guided munitions, presents a challenge. End-user demographics, primarily comprising military forces and special operations units globally, dictate demand. M&A activity within the industry has been moderate, with a focus on enhancing technological capabilities and expanding geographical reach.
- Market Concentration: Moderate, with top 5 players holding approximately xx% market share in 2025.
- Technological Innovation Drivers: Miniaturization, improved accuracy, and extended range capabilities.
- Regulatory Frameworks: Strict export controls and end-use restrictions influence market access.
- Competitive Product Substitutes: Drones, precision-guided artillery, and advanced mortar systems.
- End-User Demographics: Primarily military forces and special operations units, with varying demand based on geopolitical factors.
- M&A Trends: Strategic acquisitions to enhance technology portfolios and market penetration. xx M&A deals recorded between 2019-2024.
Shoulder Fired Missiles Industry Growth Trends & Insights
The shoulder-fired missiles market experienced a xx% CAGR during the historical period (2019-2024). This growth is attributed to increasing defense budgets globally, rising geopolitical tensions, and the adoption of advanced guided missile technologies. Technological disruptions, such as the integration of AI and improved seeker heads, have further fueled market expansion. Consumer behavior, characterized by a preference for lightweight, highly accurate, and easily deployable systems, has also driven demand. The market is projected to maintain a CAGR of xx% during the forecast period (2025-2033), reaching an estimated xx Million units by 2033. Market penetration in key regions is expected to increase significantly.
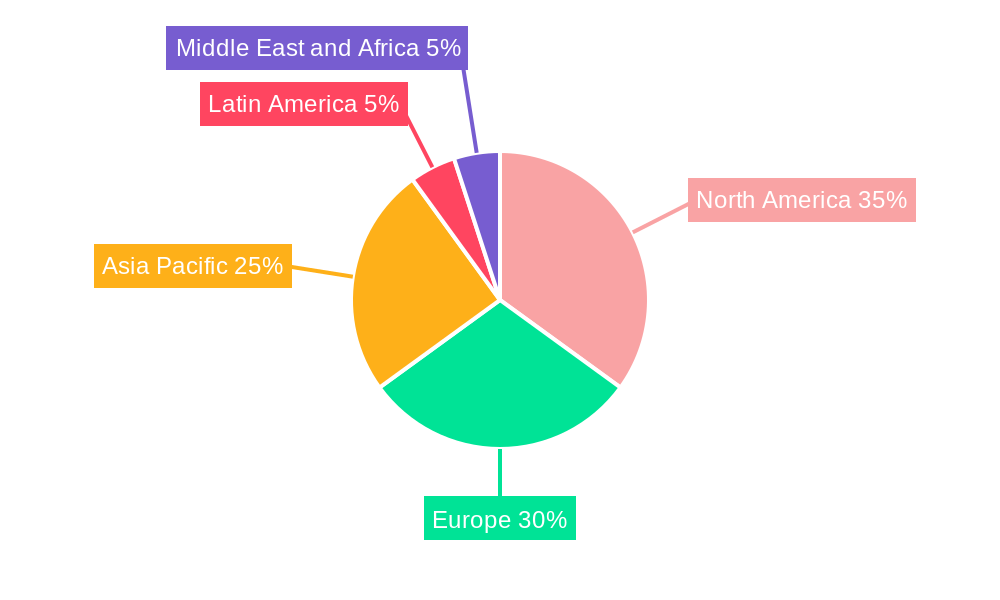
Dominant Regions, Countries, or Segments in Shoulder Fired Missiles Industry
The North American region currently holds the largest market share due to high defense spending and technological advancements. However, the Asia-Pacific region is exhibiting the fastest growth rate, driven by rising defense budgets and increasing regional conflicts. Within segments, the guided missile technology segment dominates due to its superior accuracy and effectiveness. The medium-range segment holds a significant share and is anticipated to witness substantial growth due to its versatility. The projectile assembly type segment commands a larger share, reflecting the prevalence of this simpler design.
- Key Drivers in North America: High defense expenditure, strong technological base, and robust R&D investments.
- Key Drivers in Asia-Pacific: Rising defense budgets, increasing geopolitical tensions, and modernization of armed forces.
- Guided Missile Technology: Superior accuracy and effectiveness contribute to its dominant position.
- Medium-Range Segment: Versatility and cost-effectiveness drive its growth potential.
- Projectile Assembly Type: Simpler design and lower manufacturing costs contribute to its market share.
Shoulder Fired Missiles Industry Product Landscape
Recent innovations in shoulder-fired missiles focus on enhancing accuracy, range, and lethality. This includes the development of advanced seeker heads, improved propulsion systems, and lighter weight materials. These advancements have resulted in more effective and user-friendly weapons systems. Unique selling propositions include improved target acquisition, reduced collateral damage, and enhanced portability. Technological advancements such as miniaturization and the incorporation of smart munitions are shaping the future of the product landscape.
Key Drivers, Barriers & Challenges in Shoulder Fired Missiles Industry
Key Drivers: Increased defense budgets globally, geopolitical instability, advancements in guidance systems, and the need for lightweight, easily deployable weapons.
Challenges: Stringent export controls, high manufacturing costs, competition from alternative weapon systems, and concerns regarding the proliferation of these weapons. Supply chain disruptions can impact production and availability; this impact is estimated at xx% in 2025.
Emerging Opportunities in Shoulder Fired Missiles Industry
Emerging opportunities lie in the development of more precise and intelligent missiles with reduced collateral damage. Untapped markets in developing nations present growth potential. Innovations in material science could lead to lighter, more durable systems. The integration of advanced technologies, such as AI and machine learning, offers significant opportunities for improvement in targeting and guidance.
Growth Accelerators in the Shoulder Fired Missiles Industry Industry
Technological breakthroughs in propulsion and guidance systems are expected to drive significant growth. Strategic partnerships between defense contractors and technology companies can accelerate innovation. Expanding into new markets and diversifying product offerings are key strategies for long-term growth.
Key Players Shaping the Shoulder Fired Missiles Market
- Raytheon Technologies Corporation
- Bharat Dynamics Limited
- General Dynamics Corporation
- Rheinmetall AG
- Lockheed Martin Corporation
- MBDA
- Rafael Advanced Defense Systems Ltd
- AirTronic USA LL
- BAE Systems plc
- Saab AB
- ROKETSAN
Notable Milestones in Shoulder Fired Missiles Industry Sector
- 2020: Successful testing of a new generation of guided shoulder-fired missile by Raytheon Technologies.
- 2021: MBDA unveils upgraded shoulder-fired missile with improved range and accuracy.
- 2022: Lockheed Martin announces a strategic partnership to co-develop a new lightweight shoulder-fired missile.
- 2023: Significant investment in R&D by Rheinmetall focused on next-generation missile technology.
- 2024: Bharat Dynamics Limited secures a major contract for the supply of shoulder-fired missiles.
In-Depth Shoulder Fired Missiles Industry Market Outlook
The shoulder-fired missiles market is poised for robust growth over the forecast period, driven by continuous technological advancements, increasing defense budgets, and the ongoing need for effective and deployable weapons systems. Strategic partnerships and market expansion into emerging economies will play a crucial role in shaping the future of the industry. The integration of AI and other emerging technologies presents exciting opportunities for enhanced capabilities and improved accuracy. The market's future is promising, with substantial opportunities for innovation and expansion.
Shoulder Fired Missiles Industry Segmentation
- 1. Production Analysis
- 2. Consumption Analysis
- 3. Import Market Analysis (Value & Volume)
- 4. Export Market Analysis (Value & Volume)
- 5. Price Trend Analysis
Shoulder Fired Missiles Industry Segmentation By Geography
-
1. North America
- 1.1. United States
- 1.2. Canada
- 1.3. Mexico
-
2. South America
- 2.1. Brazil
- 2.2. Argentina
- 2.3. Rest of South America
-
3. Europe
- 3.1. United Kingdom
- 3.2. Germany
- 3.3. France
- 3.4. Italy
- 3.5. Spain
- 3.6. Russia
- 3.7. Benelux
- 3.8. Nordics
- 3.9. Rest of Europe
-
4. Middle East & Africa
- 4.1. Turkey
- 4.2. Israel
- 4.3. GCC
- 4.4. North Africa
- 4.5. South Africa
- 4.6. Rest of Middle East & Africa
-
5. Asia Pacific
- 5.1. China
- 5.2. India
- 5.3. Japan
- 5.4. South Korea
- 5.5. ASEAN
- 5.6. Oceania
- 5.7. Rest of Asia Pacific
Shoulder Fired Missiles Industry Regional Market Share
Geographic Coverage of Shoulder Fired Missiles Industry
Shoulder Fired Missiles Industry REPORT HIGHLIGHTS
| Aspects | Details |
|---|---|
| Study Period | 2020-2034 |
| Base Year | 2025 |
| Estimated Year | 2026 |
| Forecast Period | 2026-2034 |
| Historical Period | 2020-2025 |
| Growth Rate | CAGR of 10.9899999999999% from 2020-2034 |
| Segmentation |
|
Table of Contents
- 1. Introduction
- 1.1. Research Scope
- 1.2. Market Segmentation
- 1.3. Research Objective
- 1.4. Definitions and Assumptions
- 2. Executive Summary
- 2.1. Market Snapshot
- 3. Market Dynamics
- 3.1. Market Drivers
- 3.2. Market Restrains
- 3.3. Market Trends
- 3.4. Market Opportunities
- 4. Market Factor Analysis
- 4.1. Porters Five Forces
- 4.1.1. Bargaining Power of Suppliers
- 4.1.2. Bargaining Power of Buyers
- 4.1.3. Threat of New Entrants
- 4.1.4. Threat of Substitutes
- 4.1.5. Competitive Rivalry
- 4.2. PESTEL analysis
- 4.3. BCG Analysis
- 4.3.1. Stars (High Growth, High Market Share)
- 4.3.2. Cash Cows (Low Growth, High Market Share)
- 4.3.3. Question Mark (High Growth, Low Market Share)
- 4.3.4. Dogs (Low Growth, Low Market Share)
- 4.4. Ansoff Matrix Analysis
- 4.5. Supply Chain Analysis
- 4.6. Regulatory Landscape
- 4.7. Current Market Potential and Opportunity Assessment (TAM–SAM–SOM Framework)
- 4.8. NRP Analyst Note
- 4.1. Porters Five Forces
- 5. Market Analysis, Insights and Forecast 2021-2033
- 5.1. Market Analysis, Insights and Forecast - by Production Analysis
- 5.2. Market Analysis, Insights and Forecast - by Consumption Analysis
- 5.3. Market Analysis, Insights and Forecast - by Import Market Analysis (Value & Volume)
- 5.4. Market Analysis, Insights and Forecast - by Export Market Analysis (Value & Volume)
- 5.5. Market Analysis, Insights and Forecast - by Price Trend Analysis
- 5.6. Market Analysis, Insights and Forecast - by Region
- 5.6.1. North America
- 5.6.2. South America
- 5.6.3. Europe
- 5.6.4. Middle East & Africa
- 5.6.5. Asia Pacific
- 6. Global Shoulder Fired Missiles Industry Analysis, Insights and Forecast, 2021-2033
- 6.1. Market Analysis, Insights and Forecast - by Production Analysis
- 6.2. Market Analysis, Insights and Forecast - by Consumption Analysis
- 6.3. Market Analysis, Insights and Forecast - by Import Market Analysis (Value & Volume)
- 6.4. Market Analysis, Insights and Forecast - by Export Market Analysis (Value & Volume)
- 6.5. Market Analysis, Insights and Forecast - by Price Trend Analysis
- 7. North America Shoulder Fired Missiles Industry Analysis, Insights and Forecast, 2020-2032
- 7.1. Market Analysis, Insights and Forecast - by Production Analysis
- 7.2. Market Analysis, Insights and Forecast - by Consumption Analysis
- 7.3. Market Analysis, Insights and Forecast - by Import Market Analysis (Value & Volume)
- 7.4. Market Analysis, Insights and Forecast - by Export Market Analysis (Value & Volume)
- 7.5. Market Analysis, Insights and Forecast - by Price Trend Analysis
- 8. South America Shoulder Fired Missiles Industry Analysis, Insights and Forecast, 2020-2032
- 8.1. Market Analysis, Insights and Forecast - by Production Analysis
- 8.2. Market Analysis, Insights and Forecast - by Consumption Analysis
- 8.3. Market Analysis, Insights and Forecast - by Import Market Analysis (Value & Volume)
- 8.4. Market Analysis, Insights and Forecast - by Export Market Analysis (Value & Volume)
- 8.5. Market Analysis, Insights and Forecast - by Price Trend Analysis
- 9. Europe Shoulder Fired Missiles Industry Analysis, Insights and Forecast, 2020-2032
- 9.1. Market Analysis, Insights and Forecast - by Production Analysis
- 9.2. Market Analysis, Insights and Forecast - by Consumption Analysis
- 9.3. Market Analysis, Insights and Forecast - by Import Market Analysis (Value & Volume)
- 9.4. Market Analysis, Insights and Forecast - by Export Market Analysis (Value & Volume)
- 9.5. Market Analysis, Insights and Forecast - by Price Trend Analysis
- 10. Middle East & Africa Shoulder Fired Missiles Industry Analysis, Insights and Forecast, 2020-2032
- 10.1. Market Analysis, Insights and Forecast - by Production Analysis
- 10.2. Market Analysis, Insights and Forecast - by Consumption Analysis
- 10.3. Market Analysis, Insights and Forecast - by Import Market Analysis (Value & Volume)
- 10.4. Market Analysis, Insights and Forecast - by Export Market Analysis (Value & Volume)
- 10.5. Market Analysis, Insights and Forecast - by Price Trend Analysis
- 11. Asia Pacific Shoulder Fired Missiles Industry Analysis, Insights and Forecast, 2020-2032
- 11.1. Market Analysis, Insights and Forecast - by Production Analysis
- 11.2. Market Analysis, Insights and Forecast - by Consumption Analysis
- 11.3. Market Analysis, Insights and Forecast - by Import Market Analysis (Value & Volume)
- 11.4. Market Analysis, Insights and Forecast - by Export Market Analysis (Value & Volume)
- 11.5. Market Analysis, Insights and Forecast - by Price Trend Analysis
- 12. Competitive Analysis
- 12.1. Company Profiles
- 12.1.1 Raytheon Technologies Corporatiom
- 12.1.1.1. Company Overview
- 12.1.1.2. Products
- 12.1.1.3. Company Financials
- 12.1.1.4. SWOT Analysis
- 12.1.2 Bharat Dynamics Limited
- 12.1.2.1. Company Overview
- 12.1.2.2. Products
- 12.1.2.3. Company Financials
- 12.1.2.4. SWOT Analysis
- 12.1.3 General Dynamics Corporation
- 12.1.3.1. Company Overview
- 12.1.3.2. Products
- 12.1.3.3. Company Financials
- 12.1.3.4. SWOT Analysis
- 12.1.4 Rheinmetall AG
- 12.1.4.1. Company Overview
- 12.1.4.2. Products
- 12.1.4.3. Company Financials
- 12.1.4.4. SWOT Analysis
- 12.1.5 Lockheed Martin Corporation
- 12.1.5.1. Company Overview
- 12.1.5.2. Products
- 12.1.5.3. Company Financials
- 12.1.5.4. SWOT Analysis
- 12.1.6 MBDA
- 12.1.6.1. Company Overview
- 12.1.6.2. Products
- 12.1.6.3. Company Financials
- 12.1.6.4. SWOT Analysis
- 12.1.7 Rafael Advanced Defense Systems Ltd
- 12.1.7.1. Company Overview
- 12.1.7.2. Products
- 12.1.7.3. Company Financials
- 12.1.7.4. SWOT Analysis
- 12.1.8 AirTronic USA LL
- 12.1.8.1. Company Overview
- 12.1.8.2. Products
- 12.1.8.3. Company Financials
- 12.1.8.4. SWOT Analysis
- 12.1.9 BAE Systems plc
- 12.1.9.1. Company Overview
- 12.1.9.2. Products
- 12.1.9.3. Company Financials
- 12.1.9.4. SWOT Analysis
- 12.1.10 Saab AB
- 12.1.10.1. Company Overview
- 12.1.10.2. Products
- 12.1.10.3. Company Financials
- 12.1.10.4. SWOT Analysis
- 12.1.11 ROKETSAN
- 12.1.11.1. Company Overview
- 12.1.11.2. Products
- 12.1.11.3. Company Financials
- 12.1.11.4. SWOT Analysis
- 12.1.1 Raytheon Technologies Corporatiom
- 12.2. Market Entropy
- 12.2.1 Company's Key Areas Served
- 12.2.2 Recent Developments
- 12.3. Company Market Share Analysis 2025
- 12.3.1 Top 5 Companies Market Share Analysis
- 12.3.2 Top 3 Companies Market Share Analysis
- 12.4. List of Potential Customers
- 13. Research Methodology
List of Figures
- Figure 1: Global Shoulder Fired Missiles Industry Revenue Breakdown (billion, %) by Region 2025 & 2033
- Figure 2: North America Shoulder Fired Missiles Industry Revenue (billion), by Production Analysis 2025 & 2033
- Figure 3: North America Shoulder Fired Missiles Industry Revenue Share (%), by Production Analysis 2025 & 2033
- Figure 4: North America Shoulder Fired Missiles Industry Revenue (billion), by Consumption Analysis 2025 & 2033
- Figure 5: North America Shoulder Fired Missiles Industry Revenue Share (%), by Consumption Analysis 2025 & 2033
- Figure 6: North America Shoulder Fired Missiles Industry Revenue (billion), by Import Market Analysis (Value & Volume) 2025 & 2033
- Figure 7: North America Shoulder Fired Missiles Industry Revenue Share (%), by Import Market Analysis (Value & Volume) 2025 & 2033
- Figure 8: North America Shoulder Fired Missiles Industry Revenue (billion), by Export Market Analysis (Value & Volume) 2025 & 2033
- Figure 9: North America Shoulder Fired Missiles Industry Revenue Share (%), by Export Market Analysis (Value & Volume) 2025 & 2033
- Figure 10: North America Shoulder Fired Missiles Industry Revenue (billion), by Price Trend Analysis 2025 & 2033
- Figure 11: North America Shoulder Fired Missiles Industry Revenue Share (%), by Price Trend Analysis 2025 & 2033
- Figure 12: North America Shoulder Fired Missiles Industry Revenue (billion), by Country 2025 & 2033
- Figure 13: North America Shoulder Fired Missiles Industry Revenue Share (%), by Country 2025 & 2033
- Figure 14: South America Shoulder Fired Missiles Industry Revenue (billion), by Production Analysis 2025 & 2033
- Figure 15: South America Shoulder Fired Missiles Industry Revenue Share (%), by Production Analysis 2025 & 2033
- Figure 16: South America Shoulder Fired Missiles Industry Revenue (billion), by Consumption Analysis 2025 & 2033
- Figure 17: South America Shoulder Fired Missiles Industry Revenue Share (%), by Consumption Analysis 2025 & 2033
- Figure 18: South America Shoulder Fired Missiles Industry Revenue (billion), by Import Market Analysis (Value & Volume) 2025 & 2033
- Figure 19: South America Shoulder Fired Missiles Industry Revenue Share (%), by Import Market Analysis (Value & Volume) 2025 & 2033
- Figure 20: South America Shoulder Fired Missiles Industry Revenue (billion), by Export Market Analysis (Value & Volume) 2025 & 2033
- Figure 21: South America Shoulder Fired Missiles Industry Revenue Share (%), by Export Market Analysis (Value & Volume) 2025 & 2033
- Figure 22: South America Shoulder Fired Missiles Industry Revenue (billion), by Price Trend Analysis 2025 & 2033
- Figure 23: South America Shoulder Fired Missiles Industry Revenue Share (%), by Price Trend Analysis 2025 & 2033
- Figure 24: South America Shoulder Fired Missiles Industry Revenue (billion), by Country 2025 & 2033
- Figure 25: South America Shoulder Fired Missiles Industry Revenue Share (%), by Country 2025 & 2033
- Figure 26: Europe Shoulder Fired Missiles Industry Revenue (billion), by Production Analysis 2025 & 2033
- Figure 27: Europe Shoulder Fired Missiles Industry Revenue Share (%), by Production Analysis 2025 & 2033
- Figure 28: Europe Shoulder Fired Missiles Industry Revenue (billion), by Consumption Analysis 2025 & 2033
- Figure 29: Europe Shoulder Fired Missiles Industry Revenue Share (%), by Consumption Analysis 2025 & 2033
- Figure 30: Europe Shoulder Fired Missiles Industry Revenue (billion), by Import Market Analysis (Value & Volume) 2025 & 2033
- Figure 31: Europe Shoulder Fired Missiles Industry Revenue Share (%), by Import Market Analysis (Value & Volume) 2025 & 2033
- Figure 32: Europe Shoulder Fired Missiles Industry Revenue (billion), by Export Market Analysis (Value & Volume) 2025 & 2033
- Figure 33: Europe Shoulder Fired Missiles Industry Revenue Share (%), by Export Market Analysis (Value & Volume) 2025 & 2033
- Figure 34: Europe Shoulder Fired Missiles Industry Revenue (billion), by Price Trend Analysis 2025 & 2033
- Figure 35: Europe Shoulder Fired Missiles Industry Revenue Share (%), by Price Trend Analysis 2025 & 2033
- Figure 36: Europe Shoulder Fired Missiles Industry Revenue (billion), by Country 2025 & 2033
- Figure 37: Europe Shoulder Fired Missiles Industry Revenue Share (%), by Country 2025 & 2033
- Figure 38: Middle East & Africa Shoulder Fired Missiles Industry Revenue (billion), by Production Analysis 2025 & 2033
- Figure 39: Middle East & Africa Shoulder Fired Missiles Industry Revenue Share (%), by Production Analysis 2025 & 2033
- Figure 40: Middle East & Africa Shoulder Fired Missiles Industry Revenue (billion), by Consumption Analysis 2025 & 2033
- Figure 41: Middle East & Africa Shoulder Fired Missiles Industry Revenue Share (%), by Consumption Analysis 2025 & 2033
- Figure 42: Middle East & Africa Shoulder Fired Missiles Industry Revenue (billion), by Import Market Analysis (Value & Volume) 2025 & 2033
- Figure 43: Middle East & Africa Shoulder Fired Missiles Industry Revenue Share (%), by Import Market Analysis (Value & Volume) 2025 & 2033
- Figure 44: Middle East & Africa Shoulder Fired Missiles Industry Revenue (billion), by Export Market Analysis (Value & Volume) 2025 & 2033
- Figure 45: Middle East & Africa Shoulder Fired Missiles Industry Revenue Share (%), by Export Market Analysis (Value & Volume) 2025 & 2033
- Figure 46: Middle East & Africa Shoulder Fired Missiles Industry Revenue (billion), by Price Trend Analysis 2025 & 2033
- Figure 47: Middle East & Africa Shoulder Fired Missiles Industry Revenue Share (%), by Price Trend Analysis 2025 & 2033
- Figure 48: Middle East & Africa Shoulder Fired Missiles Industry Revenue (billion), by Country 2025 & 2033
- Figure 49: Middle East & Africa Shoulder Fired Missiles Industry Revenue Share (%), by Country 2025 & 2033
- Figure 50: Asia Pacific Shoulder Fired Missiles Industry Revenue (billion), by Production Analysis 2025 & 2033
- Figure 51: Asia Pacific Shoulder Fired Missiles Industry Revenue Share (%), by Production Analysis 2025 & 2033
- Figure 52: Asia Pacific Shoulder Fired Missiles Industry Revenue (billion), by Consumption Analysis 2025 & 2033
- Figure 53: Asia Pacific Shoulder Fired Missiles Industry Revenue Share (%), by Consumption Analysis 2025 & 2033
- Figure 54: Asia Pacific Shoulder Fired Missiles Industry Revenue (billion), by Import Market Analysis (Value & Volume) 2025 & 2033
- Figure 55: Asia Pacific Shoulder Fired Missiles Industry Revenue Share (%), by Import Market Analysis (Value & Volume) 2025 & 2033
- Figure 56: Asia Pacific Shoulder Fired Missiles Industry Revenue (billion), by Export Market Analysis (Value & Volume) 2025 & 2033
- Figure 57: Asia Pacific Shoulder Fired Missiles Industry Revenue Share (%), by Export Market Analysis (Value & Volume) 2025 & 2033
- Figure 58: Asia Pacific Shoulder Fired Missiles Industry Revenue (billion), by Price Trend Analysis 2025 & 2033
- Figure 59: Asia Pacific Shoulder Fired Missiles Industry Revenue Share (%), by Price Trend Analysis 2025 & 2033
- Figure 60: Asia Pacific Shoulder Fired Missiles Industry Revenue (billion), by Country 2025 & 2033
- Figure 61: Asia Pacific Shoulder Fired Missiles Industry Revenue Share (%), by Country 2025 & 2033
List of Tables
- Table 1: Global Shoulder Fired Missiles Industry Revenue billion Forecast, by Production Analysis 2020 & 2033
- Table 2: Global Shoulder Fired Missiles Industry Revenue billion Forecast, by Consumption Analysis 2020 & 2033
- Table 3: Global Shoulder Fired Missiles Industry Revenue billion Forecast, by Import Market Analysis (Value & Volume) 2020 & 2033
- Table 4: Global Shoulder Fired Missiles Industry Revenue billion Forecast, by Export Market Analysis (Value & Volume) 2020 & 2033
- Table 5: Global Shoulder Fired Missiles Industry Revenue billion Forecast, by Price Trend Analysis 2020 & 2033
- Table 6: Global Shoulder Fired Missiles Industry Revenue billion Forecast, by Region 2020 & 2033
- Table 7: Global Shoulder Fired Missiles Industry Revenue billion Forecast, by Production Analysis 2020 & 2033
- Table 8: Global Shoulder Fired Missiles Industry Revenue billion Forecast, by Consumption Analysis 2020 & 2033
- Table 9: Global Shoulder Fired Missiles Industry Revenue billion Forecast, by Import Market Analysis (Value & Volume) 2020 & 2033
- Table 10: Global Shoulder Fired Missiles Industry Revenue billion Forecast, by Export Market Analysis (Value & Volume) 2020 & 2033
- Table 11: Global Shoulder Fired Missiles Industry Revenue billion Forecast, by Price Trend Analysis 2020 & 2033
- Table 12: Global Shoulder Fired Missiles Industry Revenue billion Forecast, by Country 2020 & 2033
- Table 13: United States Shoulder Fired Missiles Industry Revenue (billion) Forecast, by Application 2020 & 2033
- Table 14: Canada Shoulder Fired Missiles Industry Revenue (billion) Forecast, by Application 2020 & 2033
- Table 15: Mexico Shoulder Fired Missiles Industry Revenue (billion) Forecast, by Application 2020 & 2033
- Table 16: Global Shoulder Fired Missiles Industry Revenue billion Forecast, by Production Analysis 2020 & 2033
- Table 17: Global Shoulder Fired Missiles Industry Revenue billion Forecast, by Consumption Analysis 2020 & 2033
- Table 18: Global Shoulder Fired Missiles Industry Revenue billion Forecast, by Import Market Analysis (Value & Volume) 2020 & 2033
- Table 19: Global Shoulder Fired Missiles Industry Revenue billion Forecast, by Export Market Analysis (Value & Volume) 2020 & 2033
- Table 20: Global Shoulder Fired Missiles Industry Revenue billion Forecast, by Price Trend Analysis 2020 & 2033
- Table 21: Global Shoulder Fired Missiles Industry Revenue billion Forecast, by Country 2020 & 2033
- Table 22: Brazil Shoulder Fired Missiles Industry Revenue (billion) Forecast, by Application 2020 & 2033
- Table 23: Argentina Shoulder Fired Missiles Industry Revenue (billion) Forecast, by Application 2020 & 2033
- Table 24: Rest of South America Shoulder Fired Missiles Industry Revenue (billion) Forecast, by Application 2020 & 2033
- Table 25: Global Shoulder Fired Missiles Industry Revenue billion Forecast, by Production Analysis 2020 & 2033
- Table 26: Global Shoulder Fired Missiles Industry Revenue billion Forecast, by Consumption Analysis 2020 & 2033
- Table 27: Global Shoulder Fired Missiles Industry Revenue billion Forecast, by Import Market Analysis (Value & Volume) 2020 & 2033
- Table 28: Global Shoulder Fired Missiles Industry Revenue billion Forecast, by Export Market Analysis (Value & Volume) 2020 & 2033
- Table 29: Global Shoulder Fired Missiles Industry Revenue billion Forecast, by Price Trend Analysis 2020 & 2033
- Table 30: Global Shoulder Fired Missiles Industry Revenue billion Forecast, by Country 2020 & 2033
- Table 31: United Kingdom Shoulder Fired Missiles Industry Revenue (billion) Forecast, by Application 2020 & 2033
- Table 32: Germany Shoulder Fired Missiles Industry Revenue (billion) Forecast, by Application 2020 & 2033
- Table 33: France Shoulder Fired Missiles Industry Revenue (billion) Forecast, by Application 2020 & 2033
- Table 34: Italy Shoulder Fired Missiles Industry Revenue (billion) Forecast, by Application 2020 & 2033
- Table 35: Spain Shoulder Fired Missiles Industry Revenue (billion) Forecast, by Application 2020 & 2033
- Table 36: Russia Shoulder Fired Missiles Industry Revenue (billion) Forecast, by Application 2020 & 2033
- Table 37: Benelux Shoulder Fired Missiles Industry Revenue (billion) Forecast, by Application 2020 & 2033
- Table 38: Nordics Shoulder Fired Missiles Industry Revenue (billion) Forecast, by Application 2020 & 2033
- Table 39: Rest of Europe Shoulder Fired Missiles Industry Revenue (billion) Forecast, by Application 2020 & 2033
- Table 40: Global Shoulder Fired Missiles Industry Revenue billion Forecast, by Production Analysis 2020 & 2033
- Table 41: Global Shoulder Fired Missiles Industry Revenue billion Forecast, by Consumption Analysis 2020 & 2033
- Table 42: Global Shoulder Fired Missiles Industry Revenue billion Forecast, by Import Market Analysis (Value & Volume) 2020 & 2033
- Table 43: Global Shoulder Fired Missiles Industry Revenue billion Forecast, by Export Market Analysis (Value & Volume) 2020 & 2033
- Table 44: Global Shoulder Fired Missiles Industry Revenue billion Forecast, by Price Trend Analysis 2020 & 2033
- Table 45: Global Shoulder Fired Missiles Industry Revenue billion Forecast, by Country 2020 & 2033
- Table 46: Turkey Shoulder Fired Missiles Industry Revenue (billion) Forecast, by Application 2020 & 2033
- Table 47: Israel Shoulder Fired Missiles Industry Revenue (billion) Forecast, by Application 2020 & 2033
- Table 48: GCC Shoulder Fired Missiles Industry Revenue (billion) Forecast, by Application 2020 & 2033
- Table 49: North Africa Shoulder Fired Missiles Industry Revenue (billion) Forecast, by Application 2020 & 2033
- Table 50: South Africa Shoulder Fired Missiles Industry Revenue (billion) Forecast, by Application 2020 & 2033
- Table 51: Rest of Middle East & Africa Shoulder Fired Missiles Industry Revenue (billion) Forecast, by Application 2020 & 2033
- Table 52: Global Shoulder Fired Missiles Industry Revenue billion Forecast, by Production Analysis 2020 & 2033
- Table 53: Global Shoulder Fired Missiles Industry Revenue billion Forecast, by Consumption Analysis 2020 & 2033
- Table 54: Global Shoulder Fired Missiles Industry Revenue billion Forecast, by Import Market Analysis (Value & Volume) 2020 & 2033
- Table 55: Global Shoulder Fired Missiles Industry Revenue billion Forecast, by Export Market Analysis (Value & Volume) 2020 & 2033
- Table 56: Global Shoulder Fired Missiles Industry Revenue billion Forecast, by Price Trend Analysis 2020 & 2033
- Table 57: Global Shoulder Fired Missiles Industry Revenue billion Forecast, by Country 2020 & 2033
- Table 58: China Shoulder Fired Missiles Industry Revenue (billion) Forecast, by Application 2020 & 2033
- Table 59: India Shoulder Fired Missiles Industry Revenue (billion) Forecast, by Application 2020 & 2033
- Table 60: Japan Shoulder Fired Missiles Industry Revenue (billion) Forecast, by Application 2020 & 2033
- Table 61: South Korea Shoulder Fired Missiles Industry Revenue (billion) Forecast, by Application 2020 & 2033
- Table 62: ASEAN Shoulder Fired Missiles Industry Revenue (billion) Forecast, by Application 2020 & 2033
- Table 63: Oceania Shoulder Fired Missiles Industry Revenue (billion) Forecast, by Application 2020 & 2033
- Table 64: Rest of Asia Pacific Shoulder Fired Missiles Industry Revenue (billion) Forecast, by Application 2020 & 2033
Frequently Asked Questions
1. What is the projected Compound Annual Growth Rate (CAGR) of the Shoulder Fired Missiles Industry?
The projected CAGR is approximately 10.9899999999999%.
2. Which companies are prominent players in the Shoulder Fired Missiles Industry?
Key companies in the market include Raytheon Technologies Corporatiom, Bharat Dynamics Limited, General Dynamics Corporation, Rheinmetall AG, Lockheed Martin Corporation, MBDA, Rafael Advanced Defense Systems Ltd, AirTronic USA LL, BAE Systems plc, Saab AB, ROKETSAN.
3. What are the main segments of the Shoulder Fired Missiles Industry?
The market segments include Production Analysis, Consumption Analysis, Import Market Analysis (Value & Volume), Export Market Analysis (Value & Volume), Price Trend Analysis.
4. Can you provide details about the market size?
The market size is estimated to be USD 13.81 billion as of 2022.
5. What are some drivers contributing to market growth?
; Increased Seaborne Threats And Ambiguous Maritime Security Policies; Increasing Adoption Of Security Technologies In Bric Countries.
6. What are the notable trends driving market growth?
Rise in the Demand for MANPATS and MANPADS.
7. Are there any restraints impacting market growth?
; High Risk Rate In Ungoverned Zones; Unstructured Security Standards And Technologies.
8. Can you provide examples of recent developments in the market?
N/A
9. What pricing options are available for accessing the report?
Pricing options include single-user, multi-user, and enterprise licenses priced at USD 4750, USD 5250, and USD 8750 respectively.
10. Is the market size provided in terms of value or volume?
The market size is provided in terms of value, measured in billion.
11. Are there any specific market keywords associated with the report?
Yes, the market keyword associated with the report is "Shoulder Fired Missiles Industry," which aids in identifying and referencing the specific market segment covered.
12. How do I determine which pricing option suits my needs best?
The pricing options vary based on user requirements and access needs. Individual users may opt for single-user licenses, while businesses requiring broader access may choose multi-user or enterprise licenses for cost-effective access to the report.
13. Are there any additional resources or data provided in the Shoulder Fired Missiles Industry report?
While the report offers comprehensive insights, it's advisable to review the specific contents or supplementary materials provided to ascertain if additional resources or data are available.
14. How can I stay updated on further developments or reports in the Shoulder Fired Missiles Industry?
To stay informed about further developments, trends, and reports in the Shoulder Fired Missiles Industry, consider subscribing to industry newsletters, following relevant companies and organizations, or regularly checking reputable industry news sources and publications.
Methodology
Step 1 - Identification of Relevant Samples Size from Population Database


Step 2 - Approaches for Defining Global Market Size (Value, Volume* & Price*)

Note*: In applicable scenarios
Step 3 - Data Sources
Primary Research
- Web Analytics
- Survey Reports
- Research Institute
- Latest Research Reports
- Opinion Leaders
Secondary Research
- Annual Reports
- White Paper
- Latest Press Release
- Industry Association
- Paid Database
- Investor Presentations

Step 4 - Data Triangulation
Involves using different sources of information in order to increase the validity of a study
These sources are likely to be stakeholders in a program - participants, other researchers, program staff, other community members, and so on.
Then we put all data in single framework & apply various statistical tools to find out the dynamic on the market.
During the analysis stage, feedback from the stakeholder groups would be compared to determine areas of agreement as well as areas of divergence