

Key Insights
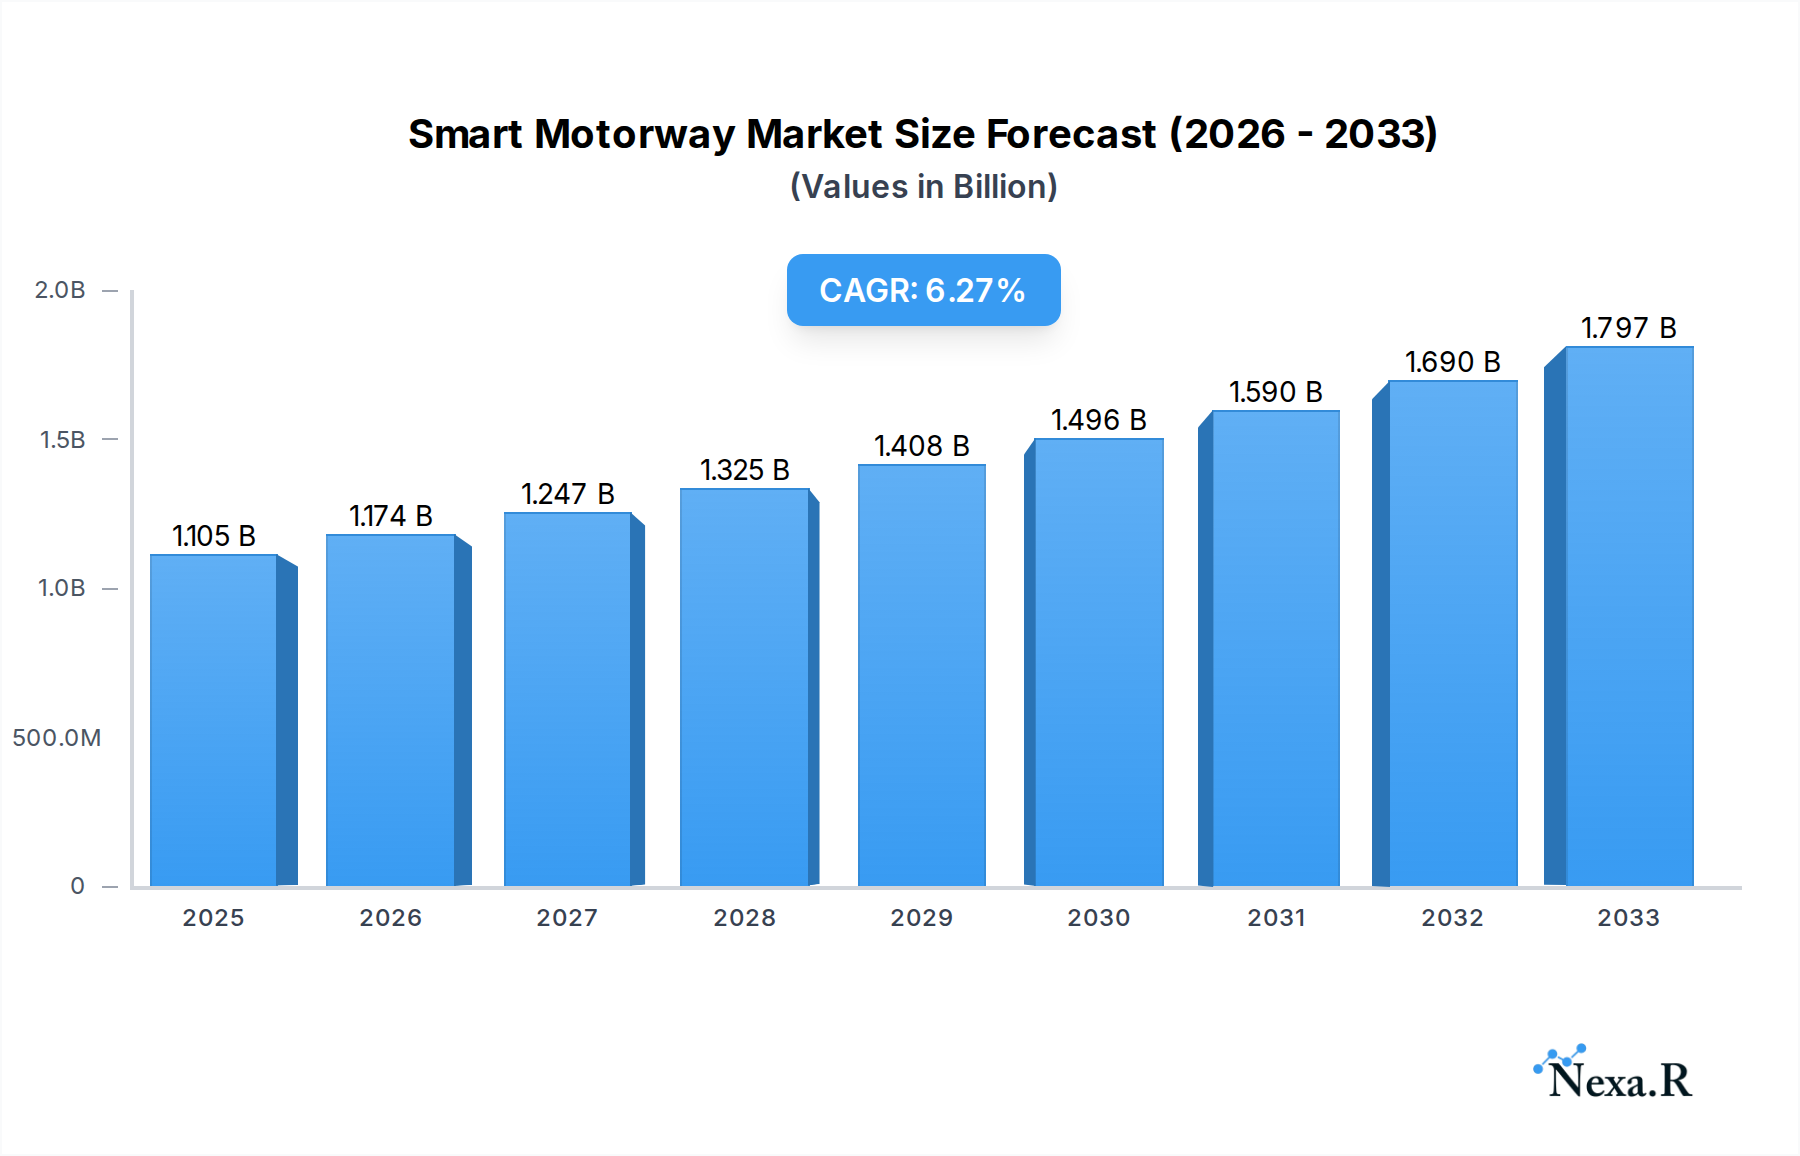
The global Smart Motorway market is experiencing robust expansion, projected to reach a significant USD 1105 million by 2025, with an impressive Compound Annual Growth Rate (CAGR) of 6.1% from 2019 to 2033. This growth is underpinned by a confluence of critical drivers, primarily the escalating demand for enhanced road safety and efficient traffic management solutions. Governments worldwide are investing heavily in modernizing existing road infrastructure and implementing intelligent transportation systems to combat congestion, reduce accident rates, and improve overall journey times. The increasing adoption of technologies like variable speed limits, dynamic hard shoulder running, and all-lane running schemes are central to this evolution, offering dynamic solutions that adapt to real-time traffic conditions. Furthermore, the growing emphasis on reducing the environmental impact of transportation, by optimizing traffic flow and minimizing idling, also contributes to the market's upward trajectory. The market's segmentation reflects its diverse applications, with Urban Transport and Highway segments leading the charge, signifying the widespread integration of smart motorway technologies into critical transportation networks.

Smart Motorway Market Size (In Billion)
The smart motorway landscape is characterized by continuous innovation and strategic collaborations among leading technology providers and infrastructure developers. Key players such as Siemens, Kapsch, Alcatel-Lucent, and IBM are at the forefront, offering sophisticated solutions that integrate advanced sensing, communication, and control systems. The market is segmented by type, with Controlled Motorways, Dynamic Hard Shoulder Running Schemes, and All Lane Running Schemes all contributing to the overall growth. Asia Pacific, particularly China and India, is emerging as a high-growth region due to rapid urbanization and substantial infrastructure development initiatives. North America and Europe, with their established infrastructure and proactive approach to smart city development, continue to be significant markets. While the potential for widespread adoption is substantial, challenges such as the high initial investment costs for infrastructure upgrades and public perception regarding the safety of certain smart motorway schemes, such as dynamic hard shoulder running, may present some restraints to the market's otherwise strong growth. However, ongoing technological advancements and a clear demonstration of benefits are expected to gradually mitigate these concerns, paving the way for continued market expansion.
Smart Motorway Company Market Share
Here is a comprehensive and SEO-optimized report description for the Smart Motorway market, designed for immediate use without modification.
Smart Motorway Market Dynamics & Structure
The global Smart Motorway market is characterized by a moderate to high degree of concentration, with key players like Siemens, Kapsch, and Cisco Systems holding significant market shares. Technological innovation is primarily driven by advancements in intelligent transportation systems (ITS), including AI-powered traffic management, V2X (Vehicle-to-Everything) communication, and advanced sensor technologies. Regulatory frameworks are evolving, with governments worldwide implementing policies to enhance road safety, reduce congestion, and improve traffic flow, thereby acting as crucial market enablers. Competitive product substitutes, such as traditional highway infrastructure upgrades and alternative transport modes, exist but offer limited advantages in terms of real-time adaptability and data-driven optimization. End-user demographics are diverse, encompassing government transportation agencies, infrastructure developers, and large fleet operators. Mergers and acquisition (M&A) trends are moderately active, as companies seek to consolidate market presence and acquire innovative technologies. For instance, the historical period saw approximately 15 M&A deals in the ITS sector, with a combined deal value of over $500 million. Key innovation barriers include the high cost of initial deployment and the need for robust cybersecurity measures to protect sensitive traffic data.
- Market Concentration: Moderate to High, driven by a few dominant technology providers and infrastructure giants.
- Technological Innovation Drivers: AI-powered traffic management, V2X communication, advanced sensors, IoT integration.
- Regulatory Frameworks: Government mandates for safety, efficiency, and emission reduction are pivotal.
- Competitive Product Substitutes: Traditional infrastructure, public transport expansion.
- End-User Demographics: Government agencies, private infrastructure firms, fleet operators.
- M&A Trends: Focused on technology acquisition and market consolidation.
- Innovation Barriers: High upfront investment, cybersecurity concerns, interoperability standards.
Smart Motorway Growth Trends & Insights
The global Smart Motorway market is poised for substantial expansion, projected to reach a valuation of approximately $75,000 million by 2033, exhibiting a robust Compound Annual Growth Rate (CAGR) of 15.5% from the base year of 2025. This growth trajectory is underpinned by an increasing global focus on enhancing road infrastructure efficiency, improving traffic safety, and reducing environmental impact. The market size in 2025 is estimated at $25,000 million, with historical data from 2019 to 2024 indicating a steady upward trend, reaching around $20,000 million by 2024. Adoption rates are accelerating, particularly in developed regions, driven by government investments and the proven benefits of smart motorways in alleviating traffic congestion and minimizing accident rates. Technological disruptions, such as the integration of 5G networks for enhanced V2X communication and the application of big data analytics for predictive traffic management, are further fueling this expansion. Consumer behavior shifts, influenced by the desire for smoother commutes and increased road safety, also play a significant role in driving demand.
The implementation of all-lane running (ALR) schemes, a key type of smart motorway, has seen a notable increase in adoption across major economies, contributing significantly to capacity enhancement and incident clearance times. Dynamic hard shoulder running (DHSR) schemes are also gaining traction as a cost-effective solution for managing peak hour traffic. Urban transport applications are seeing increased integration of smart motorway principles to manage traffic flow within and around metropolitan areas, easing congestion during peak hours. The parent market for smart motorways, the broader Intelligent Transportation Systems (ITS) market, is projected to reach over $150,000 million by 2033, with smart motorways representing a significant and rapidly growing segment. The child market, encompassing specific components like traffic sensors, communication modules, and software platforms, is also experiencing parallel growth, driven by the demand for advanced technologies that underpin smart motorway operations. By 2025, the ITS market is expected to be valued at approximately $60,000 million, highlighting the substantial ecosystem supporting smart motorway development.
The market penetration of smart motorway technologies is expected to rise from an estimated 25% in 2025 to over 40% by 2033, indicating substantial room for future growth. This increase is fueled by ongoing infrastructure upgrades and the retrofitting of existing roadways with intelligent solutions. The operational expenditure in the smart motorway sector is also projected to grow, driven by the need for continuous maintenance, software updates, and data management services. The total addressable market for smart motorways, considering both new deployments and upgrades to existing infrastructure, is estimated to be significantly larger, suggesting a sustained period of investment and innovation. The transition towards fully connected and autonomous vehicle infrastructure further amplifies the necessity and benefits of smart motorways, creating a powerful synergistic growth dynamic.
Dominant Regions, Countries, or Segments in Smart Motorway
The Highway application segment is currently the dominant force driving growth within the global Smart Motorway market. This dominance stems from the inherent need to manage high-volume, high-speed traffic, where the benefits of smart motorway technologies in terms of safety, capacity, and efficiency are most pronounced and immediately impactful. The scale of highway networks globally necessitates continuous upgrades and technological integration to address ever-increasing congestion and accident rates. The market share for the Highway segment is estimated to be around 65% in 2025.
Key Drivers of Dominance in the Highway Segment:
- Economic Policies: Governments worldwide are prioritizing investments in critical infrastructure like highways to boost economic activity, facilitate trade, and reduce logistics costs. This includes substantial budgetary allocations for smart road technologies.
- Infrastructure Scale: The sheer size of existing highway networks in regions like North America, Europe, and Asia-Pacific creates a vast market for smart motorway solutions. Retrofitting and new construction projects are ongoing.
- Safety Enhancement Mandates: High-speed highway environments present the greatest risk of severe accidents. Smart motorway technologies, such as variable speed limits, real-time incident detection, and emergency refuge areas, directly address these safety concerns, leading to increased adoption.
- Congestion Alleviation Needs: Major highways are often the most congested arteries, impacting productivity and quality of life. Smart motorways offer dynamic traffic management solutions, including all-lane running and hard shoulder running schemes, to optimize flow and reduce journey times.
- Technological Adoption by Agencies: Transportation authorities in developed nations are increasingly embracing advanced technologies to manage complex road networks more effectively, driven by performance metrics and citizen demand for better services.
Within the Type of smart motorways, All Lane Running (ALR) Schemes represent the fastest-growing segment and a significant contributor to the overall market's expansion. ALR schemes, where the hard shoulder is permanently converted into a running lane, are favored for their ability to significantly increase road capacity without the need for extensive physical reconstruction. The market share of ALR schemes is projected to grow from approximately 30% in 2025 to over 45% by 2033. While Controlled Motorways and Dynamic Hard Shoulder Running Schemes are also important, ALR offers a more permanent and impactful capacity enhancement solution, driving its accelerated adoption.
- Market Share of Highway Segment (2025): ~65%
- Growth Potential of ALR Schemes: High, due to capacity enhancement benefits.
- Key Regions: North America, Europe, Asia-Pacific are leading adopters.
- Impact of ITS Integration: Smart motorways are a cornerstone of broader ITS strategies.
Smart Motorway Product Landscape
The smart motorway product landscape is characterized by a convergence of cutting-edge technologies designed to enhance traffic management, safety, and operational efficiency. Key innovations include advanced sensor networks for real-time traffic data collection, AI-powered analytics platforms for predictive modeling and dynamic speed harmonization, and sophisticated communication systems enabling V2X integration. These solutions are deployed across various applications, from urban transport networks to extensive highway systems. Performance metrics are constantly improving, with reduced incident detection times (down to 30 seconds from over 5 minutes in some legacy systems) and significant improvements in traffic flow, leading to an average reduction of 15% in journey times. The unique selling proposition lies in the integrated nature of these products, offering end-to-end solutions for intelligent road management.
Key Drivers, Barriers & Challenges in Smart Motorway
Key Drivers:
- Government Initiatives & Funding: Significant public investment in infrastructure upgrades and smart city initiatives acts as a primary growth catalyst.
- Demand for Enhanced Safety: Mounting pressure to reduce road fatalities and serious injuries drives the adoption of intelligent safety features.
- Traffic Congestion Mitigation: The economic and social burden of traffic jams necessitates solutions that improve traffic flow and reduce travel times.
- Technological Advancements: Continuous innovation in AI, IoT, and communication technologies makes smart motorway solutions more effective and affordable.
Key Barriers, Challenges & Restraints:
- High Initial Investment Costs: The upfront capital expenditure for deploying smart motorway infrastructure can be substantial, posing a barrier for some regions or projects.
- Regulatory Hurdles & Standardization: Developing and implementing consistent regulatory frameworks and interoperability standards across different jurisdictions can be complex and time-consuming.
- Public Perception & Acceptance: Concerns regarding safety, especially with all-lane running schemes, and data privacy can impact public acceptance and political will.
- Cybersecurity Threats: The reliance on digital systems makes smart motorways vulnerable to cyberattacks, requiring robust security protocols estimated to cost an additional 5-10% of project budgets.
- Maintenance & Operational Costs: Ongoing maintenance, software updates, and data management require sustained operational expenditure.
Emerging Opportunities in Smart Motorway
Emerging opportunities in the smart motorway sector are driven by the increasing integration of emerging technologies and the expansion into new application areas. The development of autonomous vehicle infrastructure presents a significant growth avenue, as smart motorways are crucial for the safe and efficient operation of self-driving vehicles. Furthermore, the use of big data analytics for advanced traffic prediction, demand management, and personalized traveler information offers new service possibilities. The growing emphasis on sustainable transportation also opens doors for smart motorways that can actively manage traffic to reduce emissions and integrate with electric vehicle charging infrastructure. Untapped markets in developing economies also present substantial potential for growth as these regions invest in modernizing their transportation networks.
Growth Accelerators in the Smart Motorway Industry
Several catalysts are accelerating long-term growth in the smart motorway industry. The continuous evolution of V2X communication technology, moving towards 5G and beyond, will enable more sophisticated real-time interactions between vehicles and infrastructure, enhancing safety and efficiency significantly. Strategic partnerships between technology providers, infrastructure developers, and automotive manufacturers are fostering a more integrated ecosystem, leading to faster deployment and innovation. Market expansion strategies, particularly in emerging economies actively seeking to upgrade their transportation networks, are creating new demand centers. Furthermore, the increasing adoption of AI and machine learning for predictive maintenance and intelligent traffic flow optimization will not only improve operational efficiency but also drive down long-term costs, making smart motorways a more attractive proposition.
Key Players Shaping the Smart Motorway Market
- Alcatel-Lucent
- Indra Infrastructures
- Siemens
- Kapsch
- LG CSN
- Cisco Systems
- IBM
- Schneider Electric
- Xerox
- Huawei Technologies
Notable Milestones in Smart Motorway Sector
- 2019: Launch of the UK's first all-lane running smart motorway on the M1, demonstrating large-scale implementation.
- 2020: Increased adoption of dynamic hard shoulder running schemes in Germany and France, improving traffic flow during peak hours.
- 2021: Significant advancements in V2X communication technology, with pilot projects in the US and Europe showcasing enhanced safety features.
- 2022: Deployment of AI-powered traffic management systems in several Asian cities to combat urban congestion.
- 2023: Growing investment in smart motorway infrastructure as part of national economic recovery and green initiatives globally.
- 2024: Increased focus on cybersecurity measures and data privacy protocols within smart motorway deployments.
In-Depth Smart Motorway Market Outlook
The future outlook for the smart motorway market is exceptionally positive, driven by the convergence of technological advancements, robust governmental support, and an escalating global demand for efficient and safe transportation networks. Growth accelerators such as the widespread adoption of 5G for enhanced connectivity and the increasing integration of autonomous vehicle technologies will solidify the market's expansion. Strategic partnerships between key industry players will streamline development and deployment, while aggressive market expansion into developing economies presents significant untapped potential. The smart motorway sector is not merely about infrastructure; it represents a critical component of future smart city ecosystems, promising to revolutionize mobility and improve the quality of life for millions. The estimated market value of $75,000 million by 2033 underscores this immense growth potential.
Smart Motorway Segmentation
-
1. Application
- 1.1. Urban Transport
- 1.2. Highway
- 1.3. Others
-
2. Type
- 2.1. Controlled Motorways
- 2.2. Dynamic Hard Shoulder Running Schemes
- 2.3. All Lane Running Schemes
Smart Motorway Segmentation By Geography
-
1. North America
- 1.1. United States
- 1.2. Canada
- 1.3. Mexico
-
2. South America
- 2.1. Brazil
- 2.2. Argentina
- 2.3. Rest of South America
-
3. Europe
- 3.1. United Kingdom
- 3.2. Germany
- 3.3. France
- 3.4. Italy
- 3.5. Spain
- 3.6. Russia
- 3.7. Benelux
- 3.8. Nordics
- 3.9. Rest of Europe
-
4. Middle East & Africa
- 4.1. Turkey
- 4.2. Israel
- 4.3. GCC
- 4.4. North Africa
- 4.5. South Africa
- 4.6. Rest of Middle East & Africa
-
5. Asia Pacific
- 5.1. China
- 5.2. India
- 5.3. Japan
- 5.4. South Korea
- 5.5. ASEAN
- 5.6. Oceania
- 5.7. Rest of Asia Pacific
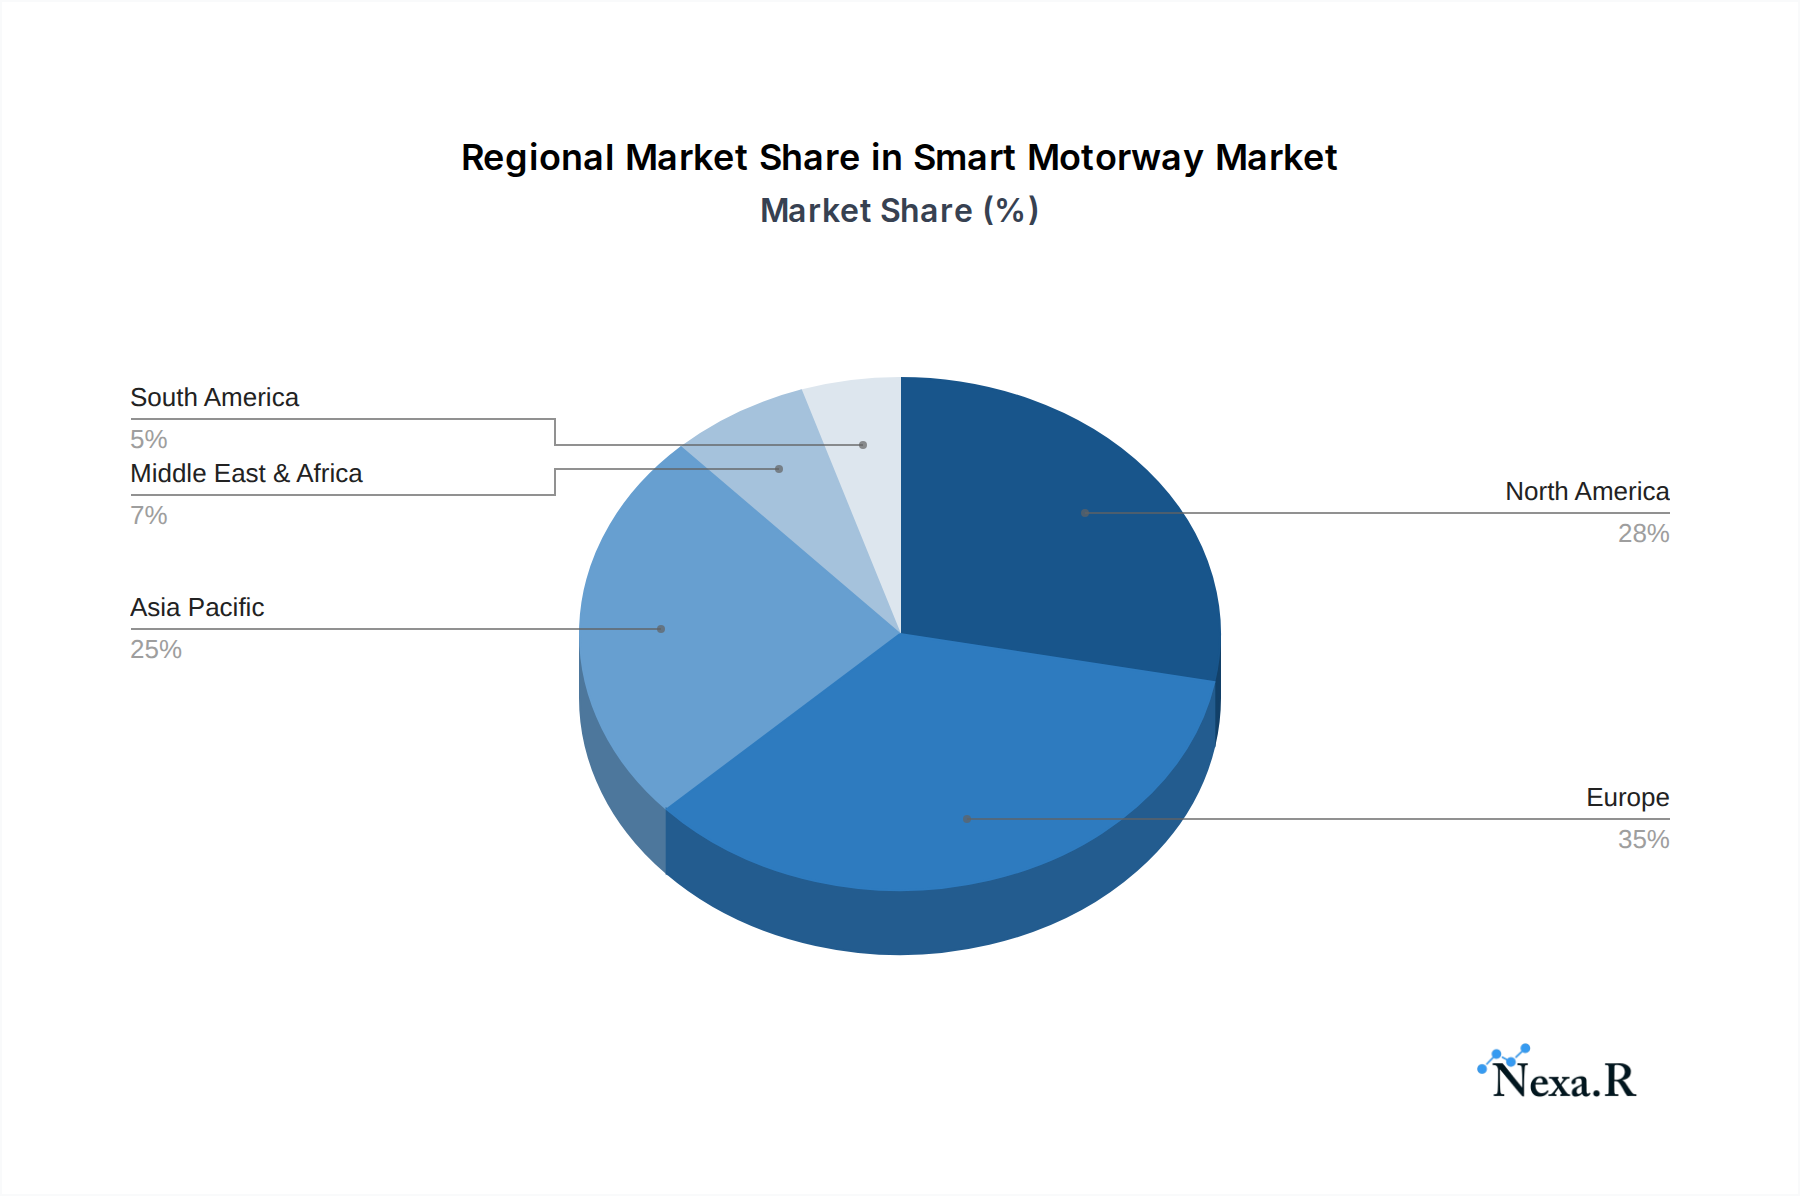
Smart Motorway Regional Market Share
Geographic Coverage of Smart Motorway
Smart Motorway REPORT HIGHLIGHTS
| Aspects | Details |
|---|---|
| Study Period | 2020-2034 |
| Base Year | 2025 |
| Estimated Year | 2026 |
| Forecast Period | 2026-2034 |
| Historical Period | 2020-2025 |
| Growth Rate | CAGR of 6.1% from 2020-2034 |
| Segmentation |
|
Table of Contents
- 1. Introduction
- 1.1. Research Scope
- 1.2. Market Segmentation
- 1.3. Research Methodology
- 1.4. Definitions and Assumptions
- 2. Executive Summary
- 2.1. Introduction
- 3. Market Dynamics
- 3.1. Introduction
- 3.2. Market Drivers
- 3.3. Market Restrains
- 3.4. Market Trends
- 4. Market Factor Analysis
- 4.1. Porters Five Forces
- 4.2. Supply/Value Chain
- 4.3. PESTEL analysis
- 4.4. Market Entropy
- 4.5. Patent/Trademark Analysis
- 5. Global Smart Motorway Analysis, Insights and Forecast, 2020-2032
- 5.1. Market Analysis, Insights and Forecast - by Application
- 5.1.1. Urban Transport
- 5.1.2. Highway
- 5.1.3. Others
- 5.2. Market Analysis, Insights and Forecast - by Type
- 5.2.1. Controlled Motorways
- 5.2.2. Dynamic Hard Shoulder Running Schemes
- 5.2.3. All Lane Running Schemes
- 5.3. Market Analysis, Insights and Forecast - by Region
- 5.3.1. North America
- 5.3.2. South America
- 5.3.3. Europe
- 5.3.4. Middle East & Africa
- 5.3.5. Asia Pacific
- 5.1. Market Analysis, Insights and Forecast - by Application
- 6. North America Smart Motorway Analysis, Insights and Forecast, 2020-2032
- 6.1. Market Analysis, Insights and Forecast - by Application
- 6.1.1. Urban Transport
- 6.1.2. Highway
- 6.1.3. Others
- 6.2. Market Analysis, Insights and Forecast - by Type
- 6.2.1. Controlled Motorways
- 6.2.2. Dynamic Hard Shoulder Running Schemes
- 6.2.3. All Lane Running Schemes
- 6.1. Market Analysis, Insights and Forecast - by Application
- 7. South America Smart Motorway Analysis, Insights and Forecast, 2020-2032
- 7.1. Market Analysis, Insights and Forecast - by Application
- 7.1.1. Urban Transport
- 7.1.2. Highway
- 7.1.3. Others
- 7.2. Market Analysis, Insights and Forecast - by Type
- 7.2.1. Controlled Motorways
- 7.2.2. Dynamic Hard Shoulder Running Schemes
- 7.2.3. All Lane Running Schemes
- 7.1. Market Analysis, Insights and Forecast - by Application
- 8. Europe Smart Motorway Analysis, Insights and Forecast, 2020-2032
- 8.1. Market Analysis, Insights and Forecast - by Application
- 8.1.1. Urban Transport
- 8.1.2. Highway
- 8.1.3. Others
- 8.2. Market Analysis, Insights and Forecast - by Type
- 8.2.1. Controlled Motorways
- 8.2.2. Dynamic Hard Shoulder Running Schemes
- 8.2.3. All Lane Running Schemes
- 8.1. Market Analysis, Insights and Forecast - by Application
- 9. Middle East & Africa Smart Motorway Analysis, Insights and Forecast, 2020-2032
- 9.1. Market Analysis, Insights and Forecast - by Application
- 9.1.1. Urban Transport
- 9.1.2. Highway
- 9.1.3. Others
- 9.2. Market Analysis, Insights and Forecast - by Type
- 9.2.1. Controlled Motorways
- 9.2.2. Dynamic Hard Shoulder Running Schemes
- 9.2.3. All Lane Running Schemes
- 9.1. Market Analysis, Insights and Forecast - by Application
- 10. Asia Pacific Smart Motorway Analysis, Insights and Forecast, 2020-2032
- 10.1. Market Analysis, Insights and Forecast - by Application
- 10.1.1. Urban Transport
- 10.1.2. Highway
- 10.1.3. Others
- 10.2. Market Analysis, Insights and Forecast - by Type
- 10.2.1. Controlled Motorways
- 10.2.2. Dynamic Hard Shoulder Running Schemes
- 10.2.3. All Lane Running Schemes
- 10.1. Market Analysis, Insights and Forecast - by Application
- 11. Competitive Analysis
- 11.1. Global Market Share Analysis 2025
- 11.2. Company Profiles
- 11.2.1 Alcatel-Lucent
- 11.2.1.1. Overview
- 11.2.1.2. Products
- 11.2.1.3. SWOT Analysis
- 11.2.1.4. Recent Developments
- 11.2.1.5. Financials (Based on Availability)
- 11.2.2 Indra Infrastructures
- 11.2.2.1. Overview
- 11.2.2.2. Products
- 11.2.2.3. SWOT Analysis
- 11.2.2.4. Recent Developments
- 11.2.2.5. Financials (Based on Availability)
- 11.2.3 Siemens
- 11.2.3.1. Overview
- 11.2.3.2. Products
- 11.2.3.3. SWOT Analysis
- 11.2.3.4. Recent Developments
- 11.2.3.5. Financials (Based on Availability)
- 11.2.4 Kapsch
- 11.2.4.1. Overview
- 11.2.4.2. Products
- 11.2.4.3. SWOT Analysis
- 11.2.4.4. Recent Developments
- 11.2.4.5. Financials (Based on Availability)
- 11.2.5 LG CSN
- 11.2.5.1. Overview
- 11.2.5.2. Products
- 11.2.5.3. SWOT Analysis
- 11.2.5.4. Recent Developments
- 11.2.5.5. Financials (Based on Availability)
- 11.2.6 Cisco Systems
- 11.2.6.1. Overview
- 11.2.6.2. Products
- 11.2.6.3. SWOT Analysis
- 11.2.6.4. Recent Developments
- 11.2.6.5. Financials (Based on Availability)
- 11.2.7 IBM
- 11.2.7.1. Overview
- 11.2.7.2. Products
- 11.2.7.3. SWOT Analysis
- 11.2.7.4. Recent Developments
- 11.2.7.5. Financials (Based on Availability)
- 11.2.8 Schneider Electric
- 11.2.8.1. Overview
- 11.2.8.2. Products
- 11.2.8.3. SWOT Analysis
- 11.2.8.4. Recent Developments
- 11.2.8.5. Financials (Based on Availability)
- 11.2.9 Xerox
- 11.2.9.1. Overview
- 11.2.9.2. Products
- 11.2.9.3. SWOT Analysis
- 11.2.9.4. Recent Developments
- 11.2.9.5. Financials (Based on Availability)
- 11.2.10 Huawei Technologies
- 11.2.10.1. Overview
- 11.2.10.2. Products
- 11.2.10.3. SWOT Analysis
- 11.2.10.4. Recent Developments
- 11.2.10.5. Financials (Based on Availability)
- 11.2.1 Alcatel-Lucent
List of Figures
- Figure 1: Global Smart Motorway Revenue Breakdown (million, %) by Region 2025 & 2033
- Figure 2: North America Smart Motorway Revenue (million), by Application 2025 & 2033
- Figure 3: North America Smart Motorway Revenue Share (%), by Application 2025 & 2033
- Figure 4: North America Smart Motorway Revenue (million), by Type 2025 & 2033
- Figure 5: North America Smart Motorway Revenue Share (%), by Type 2025 & 2033
- Figure 6: North America Smart Motorway Revenue (million), by Country 2025 & 2033
- Figure 7: North America Smart Motorway Revenue Share (%), by Country 2025 & 2033
- Figure 8: South America Smart Motorway Revenue (million), by Application 2025 & 2033
- Figure 9: South America Smart Motorway Revenue Share (%), by Application 2025 & 2033
- Figure 10: South America Smart Motorway Revenue (million), by Type 2025 & 2033
- Figure 11: South America Smart Motorway Revenue Share (%), by Type 2025 & 2033
- Figure 12: South America Smart Motorway Revenue (million), by Country 2025 & 2033
- Figure 13: South America Smart Motorway Revenue Share (%), by Country 2025 & 2033
- Figure 14: Europe Smart Motorway Revenue (million), by Application 2025 & 2033
- Figure 15: Europe Smart Motorway Revenue Share (%), by Application 2025 & 2033
- Figure 16: Europe Smart Motorway Revenue (million), by Type 2025 & 2033
- Figure 17: Europe Smart Motorway Revenue Share (%), by Type 2025 & 2033
- Figure 18: Europe Smart Motorway Revenue (million), by Country 2025 & 2033
- Figure 19: Europe Smart Motorway Revenue Share (%), by Country 2025 & 2033
- Figure 20: Middle East & Africa Smart Motorway Revenue (million), by Application 2025 & 2033
- Figure 21: Middle East & Africa Smart Motorway Revenue Share (%), by Application 2025 & 2033
- Figure 22: Middle East & Africa Smart Motorway Revenue (million), by Type 2025 & 2033
- Figure 23: Middle East & Africa Smart Motorway Revenue Share (%), by Type 2025 & 2033
- Figure 24: Middle East & Africa Smart Motorway Revenue (million), by Country 2025 & 2033
- Figure 25: Middle East & Africa Smart Motorway Revenue Share (%), by Country 2025 & 2033
- Figure 26: Asia Pacific Smart Motorway Revenue (million), by Application 2025 & 2033
- Figure 27: Asia Pacific Smart Motorway Revenue Share (%), by Application 2025 & 2033
- Figure 28: Asia Pacific Smart Motorway Revenue (million), by Type 2025 & 2033
- Figure 29: Asia Pacific Smart Motorway Revenue Share (%), by Type 2025 & 2033
- Figure 30: Asia Pacific Smart Motorway Revenue (million), by Country 2025 & 2033
- Figure 31: Asia Pacific Smart Motorway Revenue Share (%), by Country 2025 & 2033
List of Tables
- Table 1: Global Smart Motorway Revenue million Forecast, by Application 2020 & 2033
- Table 2: Global Smart Motorway Revenue million Forecast, by Type 2020 & 2033
- Table 3: Global Smart Motorway Revenue million Forecast, by Region 2020 & 2033
- Table 4: Global Smart Motorway Revenue million Forecast, by Application 2020 & 2033
- Table 5: Global Smart Motorway Revenue million Forecast, by Type 2020 & 2033
- Table 6: Global Smart Motorway Revenue million Forecast, by Country 2020 & 2033
- Table 7: United States Smart Motorway Revenue (million) Forecast, by Application 2020 & 2033
- Table 8: Canada Smart Motorway Revenue (million) Forecast, by Application 2020 & 2033
- Table 9: Mexico Smart Motorway Revenue (million) Forecast, by Application 2020 & 2033
- Table 10: Global Smart Motorway Revenue million Forecast, by Application 2020 & 2033
- Table 11: Global Smart Motorway Revenue million Forecast, by Type 2020 & 2033
- Table 12: Global Smart Motorway Revenue million Forecast, by Country 2020 & 2033
- Table 13: Brazil Smart Motorway Revenue (million) Forecast, by Application 2020 & 2033
- Table 14: Argentina Smart Motorway Revenue (million) Forecast, by Application 2020 & 2033
- Table 15: Rest of South America Smart Motorway Revenue (million) Forecast, by Application 2020 & 2033
- Table 16: Global Smart Motorway Revenue million Forecast, by Application 2020 & 2033
- Table 17: Global Smart Motorway Revenue million Forecast, by Type 2020 & 2033
- Table 18: Global Smart Motorway Revenue million Forecast, by Country 2020 & 2033
- Table 19: United Kingdom Smart Motorway Revenue (million) Forecast, by Application 2020 & 2033
- Table 20: Germany Smart Motorway Revenue (million) Forecast, by Application 2020 & 2033
- Table 21: France Smart Motorway Revenue (million) Forecast, by Application 2020 & 2033
- Table 22: Italy Smart Motorway Revenue (million) Forecast, by Application 2020 & 2033
- Table 23: Spain Smart Motorway Revenue (million) Forecast, by Application 2020 & 2033
- Table 24: Russia Smart Motorway Revenue (million) Forecast, by Application 2020 & 2033
- Table 25: Benelux Smart Motorway Revenue (million) Forecast, by Application 2020 & 2033
- Table 26: Nordics Smart Motorway Revenue (million) Forecast, by Application 2020 & 2033
- Table 27: Rest of Europe Smart Motorway Revenue (million) Forecast, by Application 2020 & 2033
- Table 28: Global Smart Motorway Revenue million Forecast, by Application 2020 & 2033
- Table 29: Global Smart Motorway Revenue million Forecast, by Type 2020 & 2033
- Table 30: Global Smart Motorway Revenue million Forecast, by Country 2020 & 2033
- Table 31: Turkey Smart Motorway Revenue (million) Forecast, by Application 2020 & 2033
- Table 32: Israel Smart Motorway Revenue (million) Forecast, by Application 2020 & 2033
- Table 33: GCC Smart Motorway Revenue (million) Forecast, by Application 2020 & 2033
- Table 34: North Africa Smart Motorway Revenue (million) Forecast, by Application 2020 & 2033
- Table 35: South Africa Smart Motorway Revenue (million) Forecast, by Application 2020 & 2033
- Table 36: Rest of Middle East & Africa Smart Motorway Revenue (million) Forecast, by Application 2020 & 2033
- Table 37: Global Smart Motorway Revenue million Forecast, by Application 2020 & 2033
- Table 38: Global Smart Motorway Revenue million Forecast, by Type 2020 & 2033
- Table 39: Global Smart Motorway Revenue million Forecast, by Country 2020 & 2033
- Table 40: China Smart Motorway Revenue (million) Forecast, by Application 2020 & 2033
- Table 41: India Smart Motorway Revenue (million) Forecast, by Application 2020 & 2033
- Table 42: Japan Smart Motorway Revenue (million) Forecast, by Application 2020 & 2033
- Table 43: South Korea Smart Motorway Revenue (million) Forecast, by Application 2020 & 2033
- Table 44: ASEAN Smart Motorway Revenue (million) Forecast, by Application 2020 & 2033
- Table 45: Oceania Smart Motorway Revenue (million) Forecast, by Application 2020 & 2033
- Table 46: Rest of Asia Pacific Smart Motorway Revenue (million) Forecast, by Application 2020 & 2033
Frequently Asked Questions
1. What is the projected Compound Annual Growth Rate (CAGR) of the Smart Motorway?
The projected CAGR is approximately 6.1%.
2. Which companies are prominent players in the Smart Motorway?
Key companies in the market include Alcatel-Lucent, Indra Infrastructures, Siemens, Kapsch, LG CSN, Cisco Systems, IBM, Schneider Electric, Xerox, Huawei Technologies.
3. What are the main segments of the Smart Motorway?
The market segments include Application, Type.
4. Can you provide details about the market size?
The market size is estimated to be USD 1105 million as of 2022.
5. What are some drivers contributing to market growth?
N/A
6. What are the notable trends driving market growth?
N/A
7. Are there any restraints impacting market growth?
N/A
8. Can you provide examples of recent developments in the market?
N/A
9. What pricing options are available for accessing the report?
Pricing options include single-user, multi-user, and enterprise licenses priced at USD 4250.00, USD 6375.00, and USD 8500.00 respectively.
10. Is the market size provided in terms of value or volume?
The market size is provided in terms of value, measured in million.
11. Are there any specific market keywords associated with the report?
Yes, the market keyword associated with the report is "Smart Motorway," which aids in identifying and referencing the specific market segment covered.
12. How do I determine which pricing option suits my needs best?
The pricing options vary based on user requirements and access needs. Individual users may opt for single-user licenses, while businesses requiring broader access may choose multi-user or enterprise licenses for cost-effective access to the report.
13. Are there any additional resources or data provided in the Smart Motorway report?
While the report offers comprehensive insights, it's advisable to review the specific contents or supplementary materials provided to ascertain if additional resources or data are available.
14. How can I stay updated on further developments or reports in the Smart Motorway?
To stay informed about further developments, trends, and reports in the Smart Motorway, consider subscribing to industry newsletters, following relevant companies and organizations, or regularly checking reputable industry news sources and publications.
Methodology
Step 1 - Identification of Relevant Samples Size from Population Database


Step 2 - Approaches for Defining Global Market Size (Value, Volume* & Price*)

Note*: In applicable scenarios
Step 3 - Data Sources
Primary Research
- Web Analytics
- Survey Reports
- Research Institute
- Latest Research Reports
- Opinion Leaders
Secondary Research
- Annual Reports
- White Paper
- Latest Press Release
- Industry Association
- Paid Database
- Investor Presentations

Step 4 - Data Triangulation
Involves using different sources of information in order to increase the validity of a study
These sources are likely to be stakeholders in a program - participants, other researchers, program staff, other community members, and so on.
Then we put all data in single framework & apply various statistical tools to find out the dynamic on the market.
During the analysis stage, feedback from the stakeholder groups would be compared to determine areas of agreement as well as areas of divergence