
Key Insights
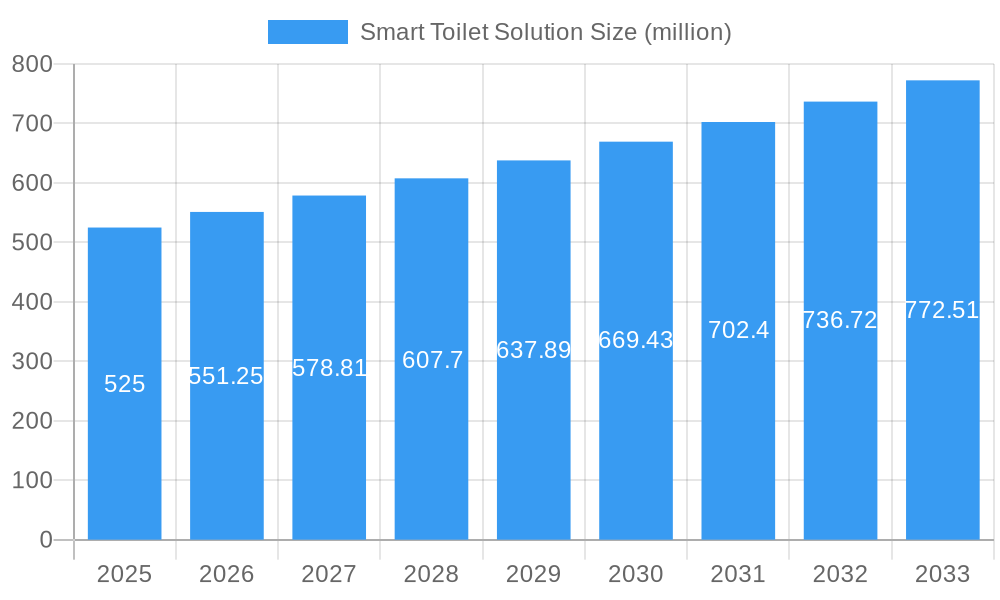
The global smart toilet solution market, currently valued at $525 million in 2025, is projected to experience robust growth, driven by increasing disposable incomes, rising health consciousness, and technological advancements. The Compound Annual Growth Rate (CAGR) of 5% from 2025 to 2033 indicates a steady expansion, with the market expected to reach approximately $740 million by 2033. This growth is fueled by several key factors: the integration of advanced features like automated flushing, heated seats, bidet functionality, and hygiene improvements; the rising adoption of smart home technology, seamlessly integrating smart toilets into existing ecosystems; and increasing awareness of hygiene and sanitation, particularly in developed and developing economies. Furthermore, the market is witnessing innovation in areas such as water conservation and waste management, further boosting demand. While challenges remain, such as high initial investment costs potentially hindering widespread adoption, particularly in price-sensitive markets, and concerns regarding data privacy and security with connected devices, the overall market outlook remains positive. The diverse range of features and functionalities available, coupled with ongoing technological development, suggests continued market expansion over the forecast period.
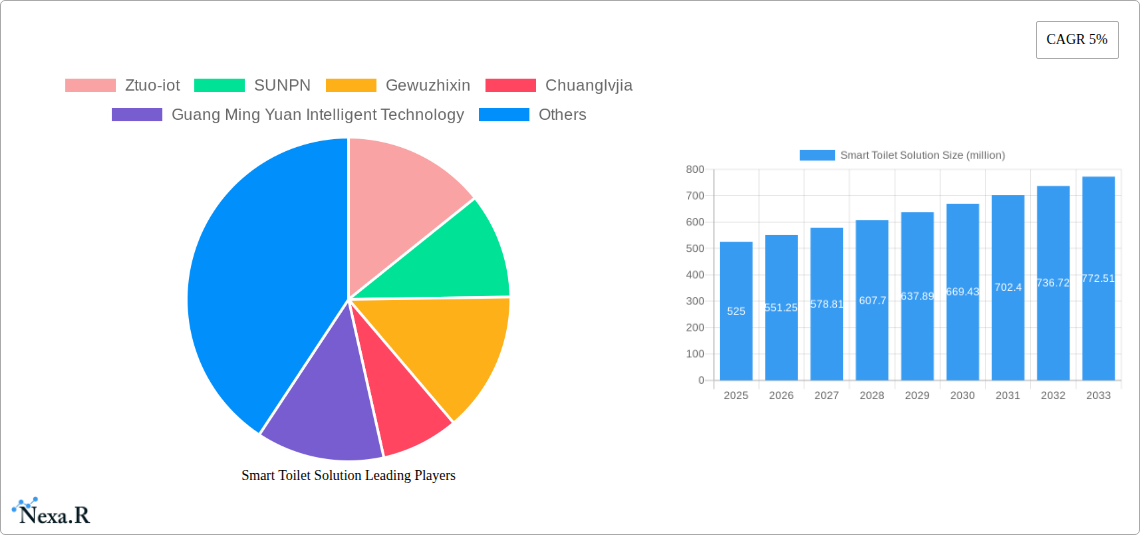
Smart Toilet Solution Market Size (In Million)
The market is segmented based on product type (e.g., electronic bidet toilet seats, integrated smart toilets), functionality (e.g., water heating, air drying, sterilization), and end-user (residential, commercial). Key players like Ztuo-iot, SUNPN, Gewuzhixin, Chuanglvjia, Guang Ming Yuan Intelligent Technology, Tuwei Intelligent, and Zkturing are actively involved in product development and market penetration. Regional variations in market growth are likely, with developed regions showing potentially slower, steadier growth compared to developing regions experiencing faster expansion as disposable income and awareness of hygiene improve. The successful integration of smart toilet solutions into larger smart home ecosystems will play a significant role in accelerating market penetration and driving future growth. Continued innovation in water-saving features and sustainable manufacturing processes will also contribute to long-term market sustainability and appeal.
Smart Toilet Solution Company Market Share
Smart Toilet Solution Market Report: 2019-2033
This comprehensive report provides an in-depth analysis of the global smart toilet solution market, encompassing market dynamics, growth trends, regional segmentation, competitive landscape, and future outlook. With a focus on the parent market of bathroom fixtures and the child market of smart home technology, this report is essential for industry professionals, investors, and strategic decision-makers. The study period covers 2019-2033, with 2025 as the base and estimated year. The forecast period is 2025-2033, and the historical period is 2019-2024. The market size is projected to reach xx million units by 2033.
Smart Toilet Solution Market Dynamics & Structure
The smart toilet solution market is characterized by moderate concentration, with key players like Ztuo-iot, SUNPN, Gewuzhixin, Chuanglvjia, Guang Ming Yuan Intelligent Technology, Tuwei Intelligent, and Zkturing vying for market share. Technological innovation, driven by advancements in sensor technology, AI, and IoT connectivity, is a major driver. Regulatory frameworks concerning water conservation and hygiene standards significantly influence market growth. Competitive substitutes include traditional toilets and less sophisticated electronic toilets. End-user demographics skew towards higher income households with a preference for advanced home technology. M&A activity has been relatively low (xx deals in the historical period), primarily focused on smaller players being acquired by larger entities.
- Market Concentration: Moderately concentrated, with top 5 players holding approximately xx% market share in 2024.
- Technological Innovation: Significant advancements in sensor technology, AI-powered features (e.g., automatic flushing, personalized settings), and improved connectivity are key drivers.
- Regulatory Landscape: Stringent regulations on water efficiency and hygiene standards in developed markets impact product development and adoption.
- Competitive Substitutes: Traditional toilets and basic electronic toilets represent significant competition, especially in price-sensitive markets.
- End-User Demographics: Higher income households in developed countries represent the primary target market.
- M&A Trends: Relatively low M&A activity (xx deals from 2019-2024) with a focus on consolidation within the industry.
Smart Toilet Solution Growth Trends & Insights
The global smart toilet solution market experienced significant growth during the historical period (2019-2024), driven by increasing consumer awareness of hygiene and convenience, rising disposable incomes in emerging economies, and technological advancements. The market size grew from xx million units in 2019 to xx million units in 2024, exhibiting a CAGR of xx%. This upward trajectory is projected to continue, with a projected CAGR of xx% from 2025 to 2033, reaching xx million units by 2033. Market penetration remains relatively low, particularly in developing countries, indicating substantial growth potential. Technological disruptions, such as the integration of voice assistants and advanced health monitoring capabilities, are accelerating market expansion. Consumer behavior shifts towards premium home products and a preference for smart home integration are further catalysts.
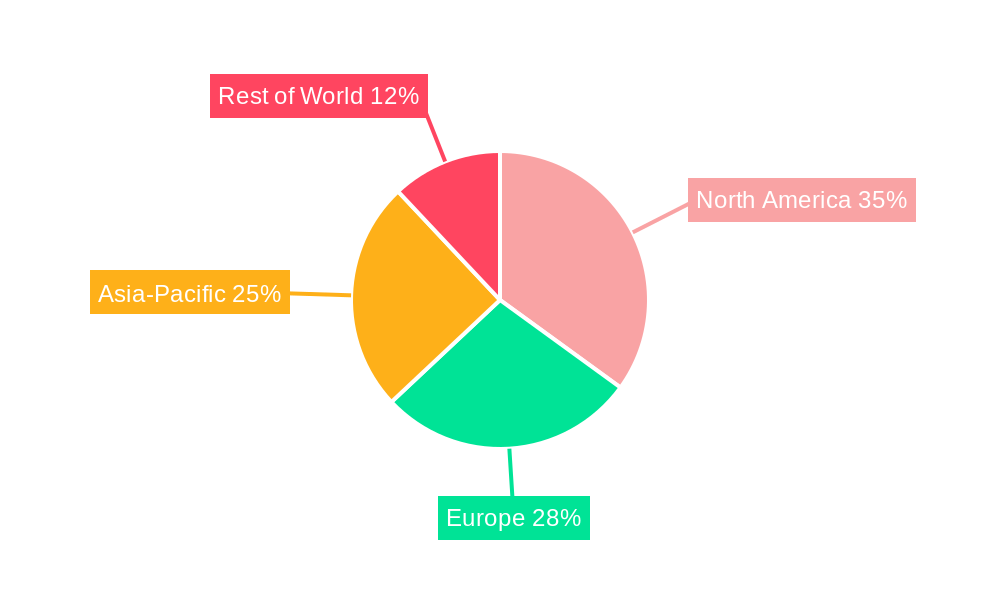
Dominant Regions, Countries, or Segments in Smart Toilet Solution
North America currently holds the largest market share in the smart toilet solution sector, driven by high consumer disposable incomes, early adoption of smart home technologies, and stringent water conservation regulations. However, Asia-Pacific is poised for significant growth, fuelled by rapid urbanization, rising middle-class incomes, and increasing awareness of hygiene. Specific countries like Japan and South Korea have shown high adoption rates due to established technological infrastructure and cultural acceptance of advanced bathroom technology.
- Key Drivers in North America: High disposable incomes, early adoption of smart home technologies, stringent water conservation regulations.
- Key Drivers in Asia-Pacific: Rapid urbanization, rising middle-class incomes, increasing awareness of hygiene, and government initiatives promoting water efficiency.
- Market Share: North America holds approximately xx% of the global market share, while Asia-Pacific is projected to grow to xx% by 2033.
Smart Toilet Solution Product Landscape
Smart toilet solutions encompass a range of products with varying features, including automatic flushing, heated seats, bidet functions, air drying, and integrated hygiene solutions. The integration of smart home ecosystems, personalized settings, and health monitoring capabilities are significant differentiators. Continuous innovation focuses on enhancing user experience, energy efficiency, and water conservation, emphasizing sustainability and hygiene. Unique selling propositions include advanced sensor technology, user-friendly interfaces, and seamless integration with other smart home devices.
Key Drivers, Barriers & Challenges in Smart Toilet Solution
Key Drivers:
- Increasing consumer demand for hygiene and convenience.
- Rising disposable incomes in emerging economies.
- Technological advancements in sensor technology, AI, and IoT connectivity.
- Government initiatives promoting water conservation.
Key Challenges:
- High initial cost compared to traditional toilets.
- Complexity of installation and maintenance.
- Concerns about data privacy and security related to connected features.
- Potential supply chain disruptions affecting component availability. (Quantifiable impact: xx% increase in production costs during supply chain disruptions in 2022)
Emerging Opportunities in Smart Toilet Solution
Emerging opportunities lie in untapped markets in developing countries, the integration of advanced health monitoring capabilities (e.g., urine analysis), and the development of eco-friendly and sustainable smart toilet solutions. Personalized settings catering to individual user preferences and the integration of smart toilet solutions with broader wellness platforms also offer significant growth potential.
Growth Accelerators in the Smart Toilet Solution Industry
Technological breakthroughs in water-saving technologies, AI-powered features, and improved connectivity will continue to drive market expansion. Strategic partnerships between toilet manufacturers, technology providers, and healthcare companies are crucial for integrating advanced features and expanding market reach. Market expansion strategies targeting emerging markets through localized product development and affordable pricing will unlock significant growth potential.
Key Players Shaping the Smart Toilet Solution Market
- Ztuo-iot
- SUNPN
- Gewuzhixin
- Chuanglvjia
- Guang Ming Yuan Intelligent Technology
- Tuwei Intelligent
- Zkturing
Notable Milestones in Smart Toilet Solution Sector
- 2021 Q4: Ztuo-iot launched its flagship smart toilet with integrated health monitoring capabilities.
- 2022 Q2: SUNPN partnered with a major smart home platform to enhance product integration.
- 2023 Q1: Significant investment in R&D across the industry focused on sustainable and energy-efficient smart toilets.
In-Depth Smart Toilet Solution Market Outlook
The future of the smart toilet solution market is promising, driven by continued technological innovation, rising consumer demand, and expansion into new markets. Strategic partnerships, focused R&D, and targeted marketing efforts will be essential for companies to capitalize on the significant growth potential in the coming years. The market is expected to experience sustained growth, driven by advancements in AI, IoT, and health monitoring capabilities.
Smart Toilet Solution Segmentation
-
1. Application
- 1.1. Scenic Spot
- 1.2. Service Area
- 1.3. Municipal
- 1.4. Office Building
- 1.5. Others
-
2. Type
- 2.1. With Purification System
- 2.2. Without Purification System
Smart Toilet Solution Segmentation By Geography
-
1. North America
- 1.1. United States
- 1.2. Canada
- 1.3. Mexico
-
2. South America
- 2.1. Brazil
- 2.2. Argentina
- 2.3. Rest of South America
-
3. Europe
- 3.1. United Kingdom
- 3.2. Germany
- 3.3. France
- 3.4. Italy
- 3.5. Spain
- 3.6. Russia
- 3.7. Benelux
- 3.8. Nordics
- 3.9. Rest of Europe
-
4. Middle East & Africa
- 4.1. Turkey
- 4.2. Israel
- 4.3. GCC
- 4.4. North Africa
- 4.5. South Africa
- 4.6. Rest of Middle East & Africa
-
5. Asia Pacific
- 5.1. China
- 5.2. India
- 5.3. Japan
- 5.4. South Korea
- 5.5. ASEAN
- 5.6. Oceania
- 5.7. Rest of Asia Pacific
Smart Toilet Solution Regional Market Share
Geographic Coverage of Smart Toilet Solution
Smart Toilet Solution REPORT HIGHLIGHTS
| Aspects | Details |
|---|---|
| Study Period | 2020-2034 |
| Base Year | 2025 |
| Estimated Year | 2026 |
| Forecast Period | 2026-2034 |
| Historical Period | 2020-2025 |
| Growth Rate | CAGR of 5% from 2020-2034 |
| Segmentation |
|
Table of Contents
- 1. Introduction
- 1.1. Research Scope
- 1.2. Market Segmentation
- 1.3. Research Methodology
- 1.4. Definitions and Assumptions
- 2. Executive Summary
- 2.1. Introduction
- 3. Market Dynamics
- 3.1. Introduction
- 3.2. Market Drivers
- 3.3. Market Restrains
- 3.4. Market Trends
- 4. Market Factor Analysis
- 4.1. Porters Five Forces
- 4.2. Supply/Value Chain
- 4.3. PESTEL analysis
- 4.4. Market Entropy
- 4.5. Patent/Trademark Analysis
- 5. Global Smart Toilet Solution Analysis, Insights and Forecast, 2020-2032
- 5.1. Market Analysis, Insights and Forecast - by Application
- 5.1.1. Scenic Spot
- 5.1.2. Service Area
- 5.1.3. Municipal
- 5.1.4. Office Building
- 5.1.5. Others
- 5.2. Market Analysis, Insights and Forecast - by Type
- 5.2.1. With Purification System
- 5.2.2. Without Purification System
- 5.3. Market Analysis, Insights and Forecast - by Region
- 5.3.1. North America
- 5.3.2. South America
- 5.3.3. Europe
- 5.3.4. Middle East & Africa
- 5.3.5. Asia Pacific
- 5.1. Market Analysis, Insights and Forecast - by Application
- 6. North America Smart Toilet Solution Analysis, Insights and Forecast, 2020-2032
- 6.1. Market Analysis, Insights and Forecast - by Application
- 6.1.1. Scenic Spot
- 6.1.2. Service Area
- 6.1.3. Municipal
- 6.1.4. Office Building
- 6.1.5. Others
- 6.2. Market Analysis, Insights and Forecast - by Type
- 6.2.1. With Purification System
- 6.2.2. Without Purification System
- 6.1. Market Analysis, Insights and Forecast - by Application
- 7. South America Smart Toilet Solution Analysis, Insights and Forecast, 2020-2032
- 7.1. Market Analysis, Insights and Forecast - by Application
- 7.1.1. Scenic Spot
- 7.1.2. Service Area
- 7.1.3. Municipal
- 7.1.4. Office Building
- 7.1.5. Others
- 7.2. Market Analysis, Insights and Forecast - by Type
- 7.2.1. With Purification System
- 7.2.2. Without Purification System
- 7.1. Market Analysis, Insights and Forecast - by Application
- 8. Europe Smart Toilet Solution Analysis, Insights and Forecast, 2020-2032
- 8.1. Market Analysis, Insights and Forecast - by Application
- 8.1.1. Scenic Spot
- 8.1.2. Service Area
- 8.1.3. Municipal
- 8.1.4. Office Building
- 8.1.5. Others
- 8.2. Market Analysis, Insights and Forecast - by Type
- 8.2.1. With Purification System
- 8.2.2. Without Purification System
- 8.1. Market Analysis, Insights and Forecast - by Application
- 9. Middle East & Africa Smart Toilet Solution Analysis, Insights and Forecast, 2020-2032
- 9.1. Market Analysis, Insights and Forecast - by Application
- 9.1.1. Scenic Spot
- 9.1.2. Service Area
- 9.1.3. Municipal
- 9.1.4. Office Building
- 9.1.5. Others
- 9.2. Market Analysis, Insights and Forecast - by Type
- 9.2.1. With Purification System
- 9.2.2. Without Purification System
- 9.1. Market Analysis, Insights and Forecast - by Application
- 10. Asia Pacific Smart Toilet Solution Analysis, Insights and Forecast, 2020-2032
- 10.1. Market Analysis, Insights and Forecast - by Application
- 10.1.1. Scenic Spot
- 10.1.2. Service Area
- 10.1.3. Municipal
- 10.1.4. Office Building
- 10.1.5. Others
- 10.2. Market Analysis, Insights and Forecast - by Type
- 10.2.1. With Purification System
- 10.2.2. Without Purification System
- 10.1. Market Analysis, Insights and Forecast - by Application
- 11. Competitive Analysis
- 11.1. Global Market Share Analysis 2025
- 11.2. Company Profiles
- 11.2.1 Ztuo-iot
- 11.2.1.1. Overview
- 11.2.1.2. Products
- 11.2.1.3. SWOT Analysis
- 11.2.1.4. Recent Developments
- 11.2.1.5. Financials (Based on Availability)
- 11.2.2 SUNPN
- 11.2.2.1. Overview
- 11.2.2.2. Products
- 11.2.2.3. SWOT Analysis
- 11.2.2.4. Recent Developments
- 11.2.2.5. Financials (Based on Availability)
- 11.2.3 Gewuzhixin
- 11.2.3.1. Overview
- 11.2.3.2. Products
- 11.2.3.3. SWOT Analysis
- 11.2.3.4. Recent Developments
- 11.2.3.5. Financials (Based on Availability)
- 11.2.4 Chuanglvjia
- 11.2.4.1. Overview
- 11.2.4.2. Products
- 11.2.4.3. SWOT Analysis
- 11.2.4.4. Recent Developments
- 11.2.4.5. Financials (Based on Availability)
- 11.2.5 Guang Ming Yuan Intelligent Technology
- 11.2.5.1. Overview
- 11.2.5.2. Products
- 11.2.5.3. SWOT Analysis
- 11.2.5.4. Recent Developments
- 11.2.5.5. Financials (Based on Availability)
- 11.2.6 Tuwei Intelligent
- 11.2.6.1. Overview
- 11.2.6.2. Products
- 11.2.6.3. SWOT Analysis
- 11.2.6.4. Recent Developments
- 11.2.6.5. Financials (Based on Availability)
- 11.2.7 Zkturing
- 11.2.7.1. Overview
- 11.2.7.2. Products
- 11.2.7.3. SWOT Analysis
- 11.2.7.4. Recent Developments
- 11.2.7.5. Financials (Based on Availability)
- 11.2.1 Ztuo-iot
List of Figures
- Figure 1: Global Smart Toilet Solution Revenue Breakdown (million, %) by Region 2025 & 2033
- Figure 2: North America Smart Toilet Solution Revenue (million), by Application 2025 & 2033
- Figure 3: North America Smart Toilet Solution Revenue Share (%), by Application 2025 & 2033
- Figure 4: North America Smart Toilet Solution Revenue (million), by Type 2025 & 2033
- Figure 5: North America Smart Toilet Solution Revenue Share (%), by Type 2025 & 2033
- Figure 6: North America Smart Toilet Solution Revenue (million), by Country 2025 & 2033
- Figure 7: North America Smart Toilet Solution Revenue Share (%), by Country 2025 & 2033
- Figure 8: South America Smart Toilet Solution Revenue (million), by Application 2025 & 2033
- Figure 9: South America Smart Toilet Solution Revenue Share (%), by Application 2025 & 2033
- Figure 10: South America Smart Toilet Solution Revenue (million), by Type 2025 & 2033
- Figure 11: South America Smart Toilet Solution Revenue Share (%), by Type 2025 & 2033
- Figure 12: South America Smart Toilet Solution Revenue (million), by Country 2025 & 2033
- Figure 13: South America Smart Toilet Solution Revenue Share (%), by Country 2025 & 2033
- Figure 14: Europe Smart Toilet Solution Revenue (million), by Application 2025 & 2033
- Figure 15: Europe Smart Toilet Solution Revenue Share (%), by Application 2025 & 2033
- Figure 16: Europe Smart Toilet Solution Revenue (million), by Type 2025 & 2033
- Figure 17: Europe Smart Toilet Solution Revenue Share (%), by Type 2025 & 2033
- Figure 18: Europe Smart Toilet Solution Revenue (million), by Country 2025 & 2033
- Figure 19: Europe Smart Toilet Solution Revenue Share (%), by Country 2025 & 2033
- Figure 20: Middle East & Africa Smart Toilet Solution Revenue (million), by Application 2025 & 2033
- Figure 21: Middle East & Africa Smart Toilet Solution Revenue Share (%), by Application 2025 & 2033
- Figure 22: Middle East & Africa Smart Toilet Solution Revenue (million), by Type 2025 & 2033
- Figure 23: Middle East & Africa Smart Toilet Solution Revenue Share (%), by Type 2025 & 2033
- Figure 24: Middle East & Africa Smart Toilet Solution Revenue (million), by Country 2025 & 2033
- Figure 25: Middle East & Africa Smart Toilet Solution Revenue Share (%), by Country 2025 & 2033
- Figure 26: Asia Pacific Smart Toilet Solution Revenue (million), by Application 2025 & 2033
- Figure 27: Asia Pacific Smart Toilet Solution Revenue Share (%), by Application 2025 & 2033
- Figure 28: Asia Pacific Smart Toilet Solution Revenue (million), by Type 2025 & 2033
- Figure 29: Asia Pacific Smart Toilet Solution Revenue Share (%), by Type 2025 & 2033
- Figure 30: Asia Pacific Smart Toilet Solution Revenue (million), by Country 2025 & 2033
- Figure 31: Asia Pacific Smart Toilet Solution Revenue Share (%), by Country 2025 & 2033
List of Tables
- Table 1: Global Smart Toilet Solution Revenue million Forecast, by Application 2020 & 2033
- Table 2: Global Smart Toilet Solution Revenue million Forecast, by Type 2020 & 2033
- Table 3: Global Smart Toilet Solution Revenue million Forecast, by Region 2020 & 2033
- Table 4: Global Smart Toilet Solution Revenue million Forecast, by Application 2020 & 2033
- Table 5: Global Smart Toilet Solution Revenue million Forecast, by Type 2020 & 2033
- Table 6: Global Smart Toilet Solution Revenue million Forecast, by Country 2020 & 2033
- Table 7: United States Smart Toilet Solution Revenue (million) Forecast, by Application 2020 & 2033
- Table 8: Canada Smart Toilet Solution Revenue (million) Forecast, by Application 2020 & 2033
- Table 9: Mexico Smart Toilet Solution Revenue (million) Forecast, by Application 2020 & 2033
- Table 10: Global Smart Toilet Solution Revenue million Forecast, by Application 2020 & 2033
- Table 11: Global Smart Toilet Solution Revenue million Forecast, by Type 2020 & 2033
- Table 12: Global Smart Toilet Solution Revenue million Forecast, by Country 2020 & 2033
- Table 13: Brazil Smart Toilet Solution Revenue (million) Forecast, by Application 2020 & 2033
- Table 14: Argentina Smart Toilet Solution Revenue (million) Forecast, by Application 2020 & 2033
- Table 15: Rest of South America Smart Toilet Solution Revenue (million) Forecast, by Application 2020 & 2033
- Table 16: Global Smart Toilet Solution Revenue million Forecast, by Application 2020 & 2033
- Table 17: Global Smart Toilet Solution Revenue million Forecast, by Type 2020 & 2033
- Table 18: Global Smart Toilet Solution Revenue million Forecast, by Country 2020 & 2033
- Table 19: United Kingdom Smart Toilet Solution Revenue (million) Forecast, by Application 2020 & 2033
- Table 20: Germany Smart Toilet Solution Revenue (million) Forecast, by Application 2020 & 2033
- Table 21: France Smart Toilet Solution Revenue (million) Forecast, by Application 2020 & 2033
- Table 22: Italy Smart Toilet Solution Revenue (million) Forecast, by Application 2020 & 2033
- Table 23: Spain Smart Toilet Solution Revenue (million) Forecast, by Application 2020 & 2033
- Table 24: Russia Smart Toilet Solution Revenue (million) Forecast, by Application 2020 & 2033
- Table 25: Benelux Smart Toilet Solution Revenue (million) Forecast, by Application 2020 & 2033
- Table 26: Nordics Smart Toilet Solution Revenue (million) Forecast, by Application 2020 & 2033
- Table 27: Rest of Europe Smart Toilet Solution Revenue (million) Forecast, by Application 2020 & 2033
- Table 28: Global Smart Toilet Solution Revenue million Forecast, by Application 2020 & 2033
- Table 29: Global Smart Toilet Solution Revenue million Forecast, by Type 2020 & 2033
- Table 30: Global Smart Toilet Solution Revenue million Forecast, by Country 2020 & 2033
- Table 31: Turkey Smart Toilet Solution Revenue (million) Forecast, by Application 2020 & 2033
- Table 32: Israel Smart Toilet Solution Revenue (million) Forecast, by Application 2020 & 2033
- Table 33: GCC Smart Toilet Solution Revenue (million) Forecast, by Application 2020 & 2033
- Table 34: North Africa Smart Toilet Solution Revenue (million) Forecast, by Application 2020 & 2033
- Table 35: South Africa Smart Toilet Solution Revenue (million) Forecast, by Application 2020 & 2033
- Table 36: Rest of Middle East & Africa Smart Toilet Solution Revenue (million) Forecast, by Application 2020 & 2033
- Table 37: Global Smart Toilet Solution Revenue million Forecast, by Application 2020 & 2033
- Table 38: Global Smart Toilet Solution Revenue million Forecast, by Type 2020 & 2033
- Table 39: Global Smart Toilet Solution Revenue million Forecast, by Country 2020 & 2033
- Table 40: China Smart Toilet Solution Revenue (million) Forecast, by Application 2020 & 2033
- Table 41: India Smart Toilet Solution Revenue (million) Forecast, by Application 2020 & 2033
- Table 42: Japan Smart Toilet Solution Revenue (million) Forecast, by Application 2020 & 2033
- Table 43: South Korea Smart Toilet Solution Revenue (million) Forecast, by Application 2020 & 2033
- Table 44: ASEAN Smart Toilet Solution Revenue (million) Forecast, by Application 2020 & 2033
- Table 45: Oceania Smart Toilet Solution Revenue (million) Forecast, by Application 2020 & 2033
- Table 46: Rest of Asia Pacific Smart Toilet Solution Revenue (million) Forecast, by Application 2020 & 2033
Frequently Asked Questions
1. What is the projected Compound Annual Growth Rate (CAGR) of the Smart Toilet Solution?
The projected CAGR is approximately 5%.
2. Which companies are prominent players in the Smart Toilet Solution?
Key companies in the market include Ztuo-iot, SUNPN, Gewuzhixin, Chuanglvjia, Guang Ming Yuan Intelligent Technology, Tuwei Intelligent, Zkturing.
3. What are the main segments of the Smart Toilet Solution?
The market segments include Application, Type.
4. Can you provide details about the market size?
The market size is estimated to be USD 525 million as of 2022.
5. What are some drivers contributing to market growth?
N/A
6. What are the notable trends driving market growth?
N/A
7. Are there any restraints impacting market growth?
N/A
8. Can you provide examples of recent developments in the market?
N/A
9. What pricing options are available for accessing the report?
Pricing options include single-user, multi-user, and enterprise licenses priced at USD 2900.00, USD 4350.00, and USD 5800.00 respectively.
10. Is the market size provided in terms of value or volume?
The market size is provided in terms of value, measured in million.
11. Are there any specific market keywords associated with the report?
Yes, the market keyword associated with the report is "Smart Toilet Solution," which aids in identifying and referencing the specific market segment covered.
12. How do I determine which pricing option suits my needs best?
The pricing options vary based on user requirements and access needs. Individual users may opt for single-user licenses, while businesses requiring broader access may choose multi-user or enterprise licenses for cost-effective access to the report.
13. Are there any additional resources or data provided in the Smart Toilet Solution report?
While the report offers comprehensive insights, it's advisable to review the specific contents or supplementary materials provided to ascertain if additional resources or data are available.
14. How can I stay updated on further developments or reports in the Smart Toilet Solution?
To stay informed about further developments, trends, and reports in the Smart Toilet Solution, consider subscribing to industry newsletters, following relevant companies and organizations, or regularly checking reputable industry news sources and publications.
Methodology
Step 1 - Identification of Relevant Samples Size from Population Database


Step 2 - Approaches for Defining Global Market Size (Value, Volume* & Price*)

Note*: In applicable scenarios
Step 3 - Data Sources
Primary Research
- Web Analytics
- Survey Reports
- Research Institute
- Latest Research Reports
- Opinion Leaders
Secondary Research
- Annual Reports
- White Paper
- Latest Press Release
- Industry Association
- Paid Database
- Investor Presentations

Step 4 - Data Triangulation
Involves using different sources of information in order to increase the validity of a study
These sources are likely to be stakeholders in a program - participants, other researchers, program staff, other community members, and so on.
Then we put all data in single framework & apply various statistical tools to find out the dynamic on the market.
During the analysis stage, feedback from the stakeholder groups would be compared to determine areas of agreement as well as areas of divergence
