

Key Insights
The Software Vulnerability Assessment (SVA) service market is experiencing robust growth, driven by the escalating frequency and sophistication of cyberattacks targeting businesses globally. The increasing adoption of cloud computing, the Internet of Things (IoT), and digital transformation initiatives across various industries necessitates proactive vulnerability management. This market is segmented by deployment (cloud, on-premise), service type (managed, professional), organization size (SMEs, large enterprises), and industry vertical (BFSI, healthcare, retail, etc.). The rising demand for regulatory compliance (e.g., GDPR, HIPAA) and the need to protect sensitive customer data are significant factors fueling market expansion. We project a substantial market size of $15 billion in 2025, growing at a Compound Annual Growth Rate (CAGR) of 12% from 2025 to 2033, driven by increasing adoption of DevSecOps methodologies and the expanding attack surface across organizations. Competition is intense, with a mix of large established players like Oracle and AWS, alongside specialized security firms and smaller consultancies. The market is witnessing innovation in areas such as automated vulnerability scanning, AI-powered threat detection, and vulnerability prioritization based on risk assessment. Challenges remain in addressing the skills gap in cybersecurity professionals and the ongoing evolution of attack vectors, requiring continuous adaptation and investment in SVA solutions.
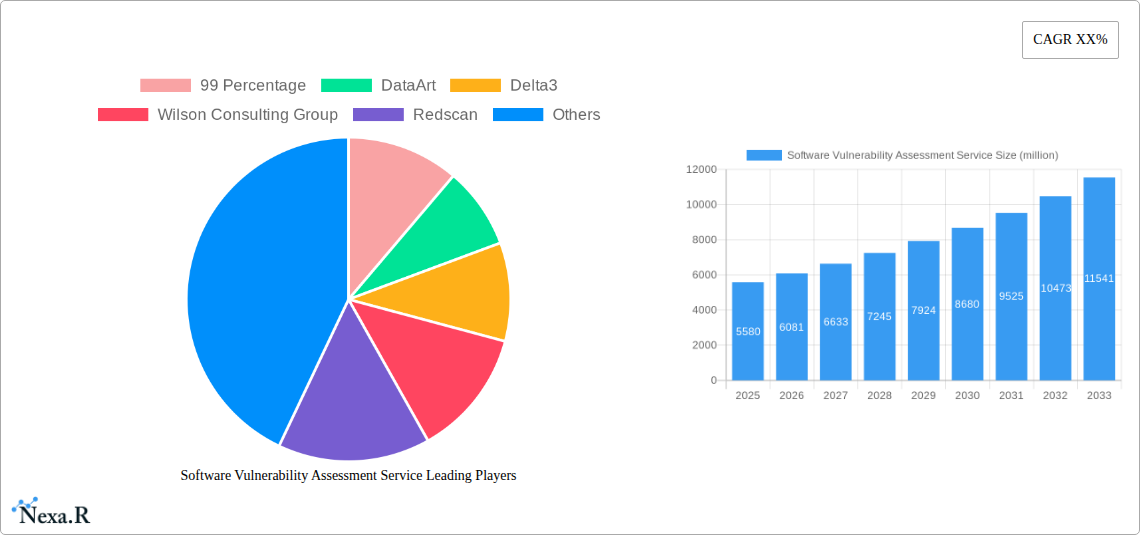
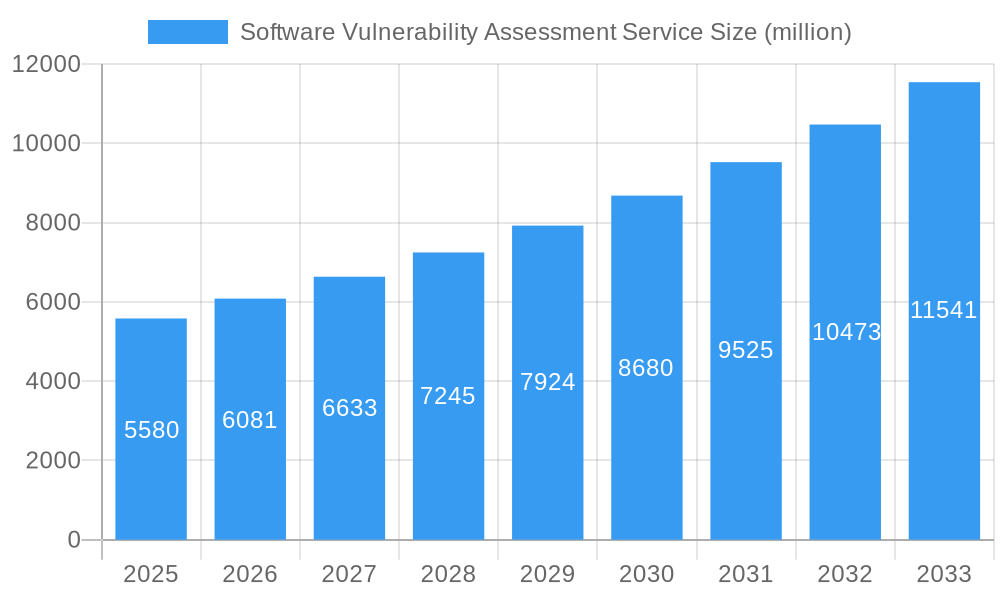
Software Vulnerability Assessment Service Market Size (In Billion)
The competitive landscape is dynamic, with both established players and emerging companies vying for market share. Strategic partnerships, mergers and acquisitions, and the development of advanced SVA capabilities are shaping the market dynamics. While the market benefits from increased awareness of cybersecurity risks, constraints include the high cost of implementation, complex integration with existing security infrastructure, and the need for ongoing maintenance and updates to keep pace with evolving threats. Successful vendors are differentiating themselves by offering comprehensive solutions that incorporate vulnerability assessment, penetration testing, and security awareness training. Future growth will be significantly influenced by the development and adoption of advanced technologies, like AI and machine learning, to automate vulnerability detection and remediation processes. The continued proliferation of IoT devices and edge computing will further accelerate the market growth in the coming years.
Software Vulnerability Assessment Service Company Market Share
Software Vulnerability Assessment Service Market Report: 2019-2033
This comprehensive report provides a detailed analysis of the Software Vulnerability Assessment Service market, offering invaluable insights for industry professionals, investors, and strategic decision-makers. The study covers the period from 2019 to 2033, with a focus on the estimated year 2025 and a forecast period spanning 2025-2033. The report segments the market by various factors and analyzes key players, emerging trends, and future growth potential. The total market size in 2025 is estimated at $XX billion.
Software Vulnerability Assessment Service Market Dynamics & Structure
The Software Vulnerability Assessment Service market is experiencing robust growth, driven by increasing cyber threats and stringent regulatory compliance mandates. Market concentration is moderate, with several key players holding significant market share, but a substantial number of smaller firms actively competing. The market is characterized by continuous technological innovation, particularly in AI-powered vulnerability detection and automated remediation. Regulatory frameworks like GDPR and CCPA are significantly influencing market demand, compelling organizations to proactively manage their security posture. The market also witnesses competitive product substitutes, such as penetration testing and security audits.
- Market Concentration: Moderate, with the top 5 players holding approximately 40% market share in 2025.
- Technological Innovation: AI/ML-driven vulnerability detection, automated remediation tools, and cloud-based solutions are key drivers.
- Regulatory Frameworks: GDPR, CCPA, and industry-specific compliance standards are pushing market growth.
- M&A Activity: An estimated XX M&A deals occurred in the historical period (2019-2024), with a predicted increase to XX in the forecast period (2025-2033).
- End-User Demographics: Primarily large enterprises and government organizations, followed by SMBs gradually increasing adoption.
Software Vulnerability Assessment Service Growth Trends & Insights
The Software Vulnerability Assessment Service market exhibited a CAGR of XX% during the historical period (2019-2024), and is projected to maintain a CAGR of XX% throughout the forecast period (2025-2033). Market penetration remains relatively low, particularly among SMBs, indicating significant growth potential. Technological disruptions, such as the shift to cloud computing and the rise of IoT, are driving demand for advanced vulnerability assessment solutions. Consumer behavior shifts towards greater security awareness and proactive risk management further contribute to market growth. Market size is expected to reach $XX billion by 2033. The increasing adoption of DevSecOps methodologies is further propelling the market expansion.
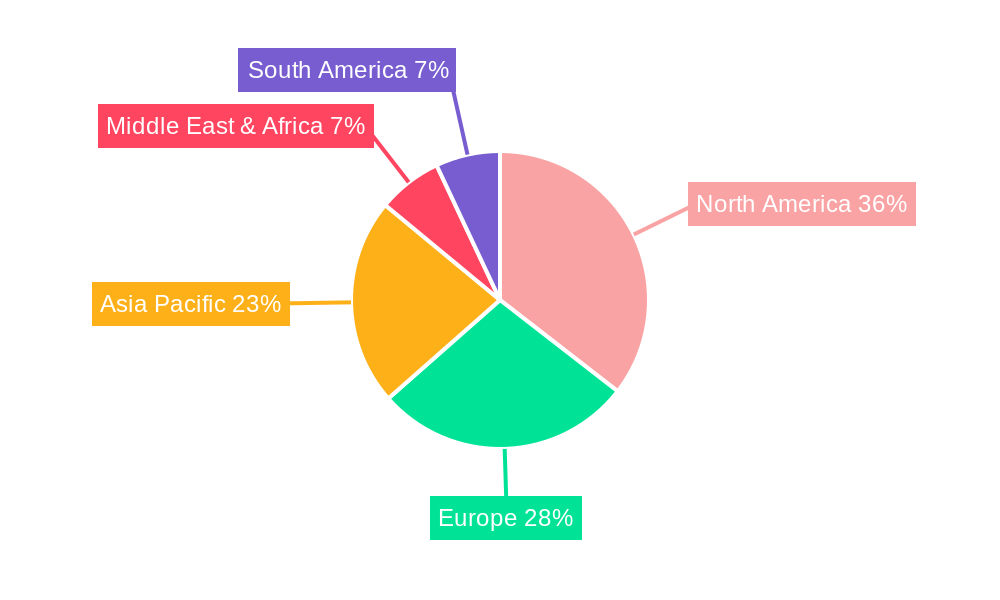
Dominant Regions, Countries, or Segments in Software Vulnerability Assessment Service
North America currently dominates the Software Vulnerability Assessment Service market, accounting for approximately 45% of the global market share in 2025. This dominance is fueled by strong regulatory frameworks, high technological adoption rates, and a mature cybersecurity infrastructure. Europe follows closely, driven by GDPR compliance requirements and a growing awareness of cyber threats. The Asia-Pacific region is projected to experience the fastest growth rate during the forecast period due to rapid economic expansion, increasing digitalization, and government initiatives to bolster cybersecurity.
- North America: High regulatory compliance standards, strong cybersecurity investments, and established technological infrastructure.
- Europe: GDPR compliance mandates drive adoption, coupled with increasing cyberattacks and awareness.
- Asia-Pacific: Rapid digital transformation, economic growth, and rising government investments in cybersecurity.
Software Vulnerability Assessment Service Product Landscape
The product landscape is characterized by diverse offerings, including vulnerability scanners, penetration testing services, and risk management platforms. Cloud-based solutions are gaining popularity due to scalability and cost-effectiveness. AI-powered tools that automate vulnerability detection and remediation are transforming the market, improving efficiency and accuracy. Unique selling propositions often revolve around specialized industry expertise, comprehensive reporting, and integration capabilities.
Key Drivers, Barriers & Challenges in Software Vulnerability Assessment Service
Key Drivers:
- Increasing cyberattacks and data breaches.
- Stringent regulatory compliance requirements (e.g., GDPR, CCPA).
- Growing adoption of cloud computing and IoT.
- Rising awareness of cybersecurity risks among organizations.
Challenges & Restraints:
- High initial investment costs for advanced solutions.
- Skill shortage in cybersecurity professionals.
- Difficulty in integrating vulnerability assessment tools into existing security infrastructure.
- The evolving nature of cyber threats necessitates continuous updates and adaptations. This presents a challenge for maintaining cost-effectiveness and the necessity for constant upskilling.
Emerging Opportunities in Software Vulnerability Assessment Service
- Expanding into untapped markets like SMBs and specific industry verticals (e.g., healthcare, finance).
- Development of AI-powered solutions for proactive threat detection and automated remediation.
- Integration of vulnerability assessment with other security tools to create comprehensive security platforms.
Growth Accelerators in the Software Vulnerability Assessment Service Industry
Technological advancements, particularly in AI and machine learning, are key catalysts driving long-term growth. Strategic partnerships between vulnerability assessment providers and other cybersecurity firms are also accelerating market expansion. Furthermore, the increasing adoption of DevSecOps methodologies is fostering proactive security practices and boosting demand for vulnerability assessment services.
Key Players Shaping the Software Vulnerability Assessment Service Market
- 99 Percentage
- DataArt
- Delta3
- Wilson Consulting Group
- Redscan
- eSec Forte Technologies
- CSI
- Cyberkov
- Rackspace
- Onapsis
- Rapid7
- TECTICIAN
- SourcetekIT
- Optiv
- A-LIGN
- Netragard
- Oracle
- intiGrow
- Khipu Networks
- CIPHER Security
- TECH LOCK
- Amazon Web Services
- Mindtree
- Sentek Global
- Superior Consulting
- Shearwater
- Conquest Security
- N.B. Service
- CHASSasia
Notable Milestones in Software Vulnerability Assessment Service Sector
- 2021-Q3: Launch of AI-powered vulnerability scanner by Rapid7.
- 2022-Q1: Acquisition of smaller vulnerability assessment firm by Onapsis.
- 2023-Q2: Release of a new cloud-based vulnerability management platform by Oracle. (Further milestones could be added based on available data)
In-Depth Software Vulnerability Assessment Service Market Outlook
The Software Vulnerability Assessment Service market is poised for continued robust growth, driven by persistent cyber threats, evolving regulatory landscapes, and technological advancements. Significant opportunities exist for companies that can offer innovative solutions, address the skill gap in cybersecurity professionals, and effectively cater to the unique needs of diverse industry verticals. Strategic partnerships, expansion into untapped markets, and the development of AI-powered tools will be key differentiators for success in this dynamic market.
Software Vulnerability Assessment Service Segmentation
-
1. Application
- 1.1. Large Enterprises
- 1.2. Small and Medium-sized Enterprises (SMEs)
-
2. Type
- 2.1. Web App
- 2.2. Mobile App
Software Vulnerability Assessment Service Segmentation By Geography
-
1. North America
- 1.1. United States
- 1.2. Canada
- 1.3. Mexico
-
2. South America
- 2.1. Brazil
- 2.2. Argentina
- 2.3. Rest of South America
-
3. Europe
- 3.1. United Kingdom
- 3.2. Germany
- 3.3. France
- 3.4. Italy
- 3.5. Spain
- 3.6. Russia
- 3.7. Benelux
- 3.8. Nordics
- 3.9. Rest of Europe
-
4. Middle East & Africa
- 4.1. Turkey
- 4.2. Israel
- 4.3. GCC
- 4.4. North Africa
- 4.5. South Africa
- 4.6. Rest of Middle East & Africa
-
5. Asia Pacific
- 5.1. China
- 5.2. India
- 5.3. Japan
- 5.4. South Korea
- 5.5. ASEAN
- 5.6. Oceania
- 5.7. Rest of Asia Pacific
Software Vulnerability Assessment Service Regional Market Share
Geographic Coverage of Software Vulnerability Assessment Service
Software Vulnerability Assessment Service REPORT HIGHLIGHTS
| Aspects | Details |
|---|---|
| Study Period | 2020-2034 |
| Base Year | 2025 |
| Estimated Year | 2026 |
| Forecast Period | 2026-2034 |
| Historical Period | 2020-2025 |
| Growth Rate | CAGR of 10.93% from 2020-2034 |
| Segmentation |
|
Table of Contents
- 1. Introduction
- 1.1. Research Scope
- 1.2. Market Segmentation
- 1.3. Research Methodology
- 1.4. Definitions and Assumptions
- 2. Executive Summary
- 2.1. Introduction
- 3. Market Dynamics
- 3.1. Introduction
- 3.2. Market Drivers
- 3.3. Market Restrains
- 3.4. Market Trends
- 4. Market Factor Analysis
- 4.1. Porters Five Forces
- 4.2. Supply/Value Chain
- 4.3. PESTEL analysis
- 4.4. Market Entropy
- 4.5. Patent/Trademark Analysis
- 5. Global Software Vulnerability Assessment Service Analysis, Insights and Forecast, 2020-2032
- 5.1. Market Analysis, Insights and Forecast - by Application
- 5.1.1. Large Enterprises
- 5.1.2. Small and Medium-sized Enterprises (SMEs)
- 5.2. Market Analysis, Insights and Forecast - by Type
- 5.2.1. Web App
- 5.2.2. Mobile App
- 5.3. Market Analysis, Insights and Forecast - by Region
- 5.3.1. North America
- 5.3.2. South America
- 5.3.3. Europe
- 5.3.4. Middle East & Africa
- 5.3.5. Asia Pacific
- 5.1. Market Analysis, Insights and Forecast - by Application
- 6. North America Software Vulnerability Assessment Service Analysis, Insights and Forecast, 2020-2032
- 6.1. Market Analysis, Insights and Forecast - by Application
- 6.1.1. Large Enterprises
- 6.1.2. Small and Medium-sized Enterprises (SMEs)
- 6.2. Market Analysis, Insights and Forecast - by Type
- 6.2.1. Web App
- 6.2.2. Mobile App
- 6.1. Market Analysis, Insights and Forecast - by Application
- 7. South America Software Vulnerability Assessment Service Analysis, Insights and Forecast, 2020-2032
- 7.1. Market Analysis, Insights and Forecast - by Application
- 7.1.1. Large Enterprises
- 7.1.2. Small and Medium-sized Enterprises (SMEs)
- 7.2. Market Analysis, Insights and Forecast - by Type
- 7.2.1. Web App
- 7.2.2. Mobile App
- 7.1. Market Analysis, Insights and Forecast - by Application
- 8. Europe Software Vulnerability Assessment Service Analysis, Insights and Forecast, 2020-2032
- 8.1. Market Analysis, Insights and Forecast - by Application
- 8.1.1. Large Enterprises
- 8.1.2. Small and Medium-sized Enterprises (SMEs)
- 8.2. Market Analysis, Insights and Forecast - by Type
- 8.2.1. Web App
- 8.2.2. Mobile App
- 8.1. Market Analysis, Insights and Forecast - by Application
- 9. Middle East & Africa Software Vulnerability Assessment Service Analysis, Insights and Forecast, 2020-2032
- 9.1. Market Analysis, Insights and Forecast - by Application
- 9.1.1. Large Enterprises
- 9.1.2. Small and Medium-sized Enterprises (SMEs)
- 9.2. Market Analysis, Insights and Forecast - by Type
- 9.2.1. Web App
- 9.2.2. Mobile App
- 9.1. Market Analysis, Insights and Forecast - by Application
- 10. Asia Pacific Software Vulnerability Assessment Service Analysis, Insights and Forecast, 2020-2032
- 10.1. Market Analysis, Insights and Forecast - by Application
- 10.1.1. Large Enterprises
- 10.1.2. Small and Medium-sized Enterprises (SMEs)
- 10.2. Market Analysis, Insights and Forecast - by Type
- 10.2.1. Web App
- 10.2.2. Mobile App
- 10.1. Market Analysis, Insights and Forecast - by Application
- 11. Competitive Analysis
- 11.1. Global Market Share Analysis 2025
- 11.2. Company Profiles
- 11.2.1 99 Percentage
- 11.2.1.1. Overview
- 11.2.1.2. Products
- 11.2.1.3. SWOT Analysis
- 11.2.1.4. Recent Developments
- 11.2.1.5. Financials (Based on Availability)
- 11.2.2 DataArt
- 11.2.2.1. Overview
- 11.2.2.2. Products
- 11.2.2.3. SWOT Analysis
- 11.2.2.4. Recent Developments
- 11.2.2.5. Financials (Based on Availability)
- 11.2.3 Delta3
- 11.2.3.1. Overview
- 11.2.3.2. Products
- 11.2.3.3. SWOT Analysis
- 11.2.3.4. Recent Developments
- 11.2.3.5. Financials (Based on Availability)
- 11.2.4 Wilson Consulting Group
- 11.2.4.1. Overview
- 11.2.4.2. Products
- 11.2.4.3. SWOT Analysis
- 11.2.4.4. Recent Developments
- 11.2.4.5. Financials (Based on Availability)
- 11.2.5 Redscan
- 11.2.5.1. Overview
- 11.2.5.2. Products
- 11.2.5.3. SWOT Analysis
- 11.2.5.4. Recent Developments
- 11.2.5.5. Financials (Based on Availability)
- 11.2.6 eSec Forte Technologies
- 11.2.6.1. Overview
- 11.2.6.2. Products
- 11.2.6.3. SWOT Analysis
- 11.2.6.4. Recent Developments
- 11.2.6.5. Financials (Based on Availability)
- 11.2.7 CSI
- 11.2.7.1. Overview
- 11.2.7.2. Products
- 11.2.7.3. SWOT Analysis
- 11.2.7.4. Recent Developments
- 11.2.7.5. Financials (Based on Availability)
- 11.2.8 Cyberkov
- 11.2.8.1. Overview
- 11.2.8.2. Products
- 11.2.8.3. SWOT Analysis
- 11.2.8.4. Recent Developments
- 11.2.8.5. Financials (Based on Availability)
- 11.2.9 Rackspace
- 11.2.9.1. Overview
- 11.2.9.2. Products
- 11.2.9.3. SWOT Analysis
- 11.2.9.4. Recent Developments
- 11.2.9.5. Financials (Based on Availability)
- 11.2.10 Onapsis
- 11.2.10.1. Overview
- 11.2.10.2. Products
- 11.2.10.3. SWOT Analysis
- 11.2.10.4. Recent Developments
- 11.2.10.5. Financials (Based on Availability)
- 11.2.11 Rapid7
- 11.2.11.1. Overview
- 11.2.11.2. Products
- 11.2.11.3. SWOT Analysis
- 11.2.11.4. Recent Developments
- 11.2.11.5. Financials (Based on Availability)
- 11.2.12 TECTICIAN
- 11.2.12.1. Overview
- 11.2.12.2. Products
- 11.2.12.3. SWOT Analysis
- 11.2.12.4. Recent Developments
- 11.2.12.5. Financials (Based on Availability)
- 11.2.13 SourcetekIT
- 11.2.13.1. Overview
- 11.2.13.2. Products
- 11.2.13.3. SWOT Analysis
- 11.2.13.4. Recent Developments
- 11.2.13.5. Financials (Based on Availability)
- 11.2.14 Optiv
- 11.2.14.1. Overview
- 11.2.14.2. Products
- 11.2.14.3. SWOT Analysis
- 11.2.14.4. Recent Developments
- 11.2.14.5. Financials (Based on Availability)
- 11.2.15 A-LIGN
- 11.2.15.1. Overview
- 11.2.15.2. Products
- 11.2.15.3. SWOT Analysis
- 11.2.15.4. Recent Developments
- 11.2.15.5. Financials (Based on Availability)
- 11.2.16 Netragard
- 11.2.16.1. Overview
- 11.2.16.2. Products
- 11.2.16.3. SWOT Analysis
- 11.2.16.4. Recent Developments
- 11.2.16.5. Financials (Based on Availability)
- 11.2.17 Oracle
- 11.2.17.1. Overview
- 11.2.17.2. Products
- 11.2.17.3. SWOT Analysis
- 11.2.17.4. Recent Developments
- 11.2.17.5. Financials (Based on Availability)
- 11.2.18 intiGrow
- 11.2.18.1. Overview
- 11.2.18.2. Products
- 11.2.18.3. SWOT Analysis
- 11.2.18.4. Recent Developments
- 11.2.18.5. Financials (Based on Availability)
- 11.2.19 Khipu Networks
- 11.2.19.1. Overview
- 11.2.19.2. Products
- 11.2.19.3. SWOT Analysis
- 11.2.19.4. Recent Developments
- 11.2.19.5. Financials (Based on Availability)
- 11.2.20 CIPHER Security
- 11.2.20.1. Overview
- 11.2.20.2. Products
- 11.2.20.3. SWOT Analysis
- 11.2.20.4. Recent Developments
- 11.2.20.5. Financials (Based on Availability)
- 11.2.21 TECH LOCK
- 11.2.21.1. Overview
- 11.2.21.2. Products
- 11.2.21.3. SWOT Analysis
- 11.2.21.4. Recent Developments
- 11.2.21.5. Financials (Based on Availability)
- 11.2.22 Amazon Web Services
- 11.2.22.1. Overview
- 11.2.22.2. Products
- 11.2.22.3. SWOT Analysis
- 11.2.22.4. Recent Developments
- 11.2.22.5. Financials (Based on Availability)
- 11.2.23 Mindtree
- 11.2.23.1. Overview
- 11.2.23.2. Products
- 11.2.23.3. SWOT Analysis
- 11.2.23.4. Recent Developments
- 11.2.23.5. Financials (Based on Availability)
- 11.2.24 Sentek Global
- 11.2.24.1. Overview
- 11.2.24.2. Products
- 11.2.24.3. SWOT Analysis
- 11.2.24.4. Recent Developments
- 11.2.24.5. Financials (Based on Availability)
- 11.2.25 Superior Consulting
- 11.2.25.1. Overview
- 11.2.25.2. Products
- 11.2.25.3. SWOT Analysis
- 11.2.25.4. Recent Developments
- 11.2.25.5. Financials (Based on Availability)
- 11.2.26 Shearwater
- 11.2.26.1. Overview
- 11.2.26.2. Products
- 11.2.26.3. SWOT Analysis
- 11.2.26.4. Recent Developments
- 11.2.26.5. Financials (Based on Availability)
- 11.2.27 Conquest Security
- 11.2.27.1. Overview
- 11.2.27.2. Products
- 11.2.27.3. SWOT Analysis
- 11.2.27.4. Recent Developments
- 11.2.27.5. Financials (Based on Availability)
- 11.2.28 N.B. Service
- 11.2.28.1. Overview
- 11.2.28.2. Products
- 11.2.28.3. SWOT Analysis
- 11.2.28.4. Recent Developments
- 11.2.28.5. Financials (Based on Availability)
- 11.2.29 CHASSasia
- 11.2.29.1. Overview
- 11.2.29.2. Products
- 11.2.29.3. SWOT Analysis
- 11.2.29.4. Recent Developments
- 11.2.29.5. Financials (Based on Availability)
- 11.2.1 99 Percentage
List of Figures
- Figure 1: Global Software Vulnerability Assessment Service Revenue Breakdown (undefined, %) by Region 2025 & 2033
- Figure 2: North America Software Vulnerability Assessment Service Revenue (undefined), by Application 2025 & 2033
- Figure 3: North America Software Vulnerability Assessment Service Revenue Share (%), by Application 2025 & 2033
- Figure 4: North America Software Vulnerability Assessment Service Revenue (undefined), by Type 2025 & 2033
- Figure 5: North America Software Vulnerability Assessment Service Revenue Share (%), by Type 2025 & 2033
- Figure 6: North America Software Vulnerability Assessment Service Revenue (undefined), by Country 2025 & 2033
- Figure 7: North America Software Vulnerability Assessment Service Revenue Share (%), by Country 2025 & 2033
- Figure 8: South America Software Vulnerability Assessment Service Revenue (undefined), by Application 2025 & 2033
- Figure 9: South America Software Vulnerability Assessment Service Revenue Share (%), by Application 2025 & 2033
- Figure 10: South America Software Vulnerability Assessment Service Revenue (undefined), by Type 2025 & 2033
- Figure 11: South America Software Vulnerability Assessment Service Revenue Share (%), by Type 2025 & 2033
- Figure 12: South America Software Vulnerability Assessment Service Revenue (undefined), by Country 2025 & 2033
- Figure 13: South America Software Vulnerability Assessment Service Revenue Share (%), by Country 2025 & 2033
- Figure 14: Europe Software Vulnerability Assessment Service Revenue (undefined), by Application 2025 & 2033
- Figure 15: Europe Software Vulnerability Assessment Service Revenue Share (%), by Application 2025 & 2033
- Figure 16: Europe Software Vulnerability Assessment Service Revenue (undefined), by Type 2025 & 2033
- Figure 17: Europe Software Vulnerability Assessment Service Revenue Share (%), by Type 2025 & 2033
- Figure 18: Europe Software Vulnerability Assessment Service Revenue (undefined), by Country 2025 & 2033
- Figure 19: Europe Software Vulnerability Assessment Service Revenue Share (%), by Country 2025 & 2033
- Figure 20: Middle East & Africa Software Vulnerability Assessment Service Revenue (undefined), by Application 2025 & 2033
- Figure 21: Middle East & Africa Software Vulnerability Assessment Service Revenue Share (%), by Application 2025 & 2033
- Figure 22: Middle East & Africa Software Vulnerability Assessment Service Revenue (undefined), by Type 2025 & 2033
- Figure 23: Middle East & Africa Software Vulnerability Assessment Service Revenue Share (%), by Type 2025 & 2033
- Figure 24: Middle East & Africa Software Vulnerability Assessment Service Revenue (undefined), by Country 2025 & 2033
- Figure 25: Middle East & Africa Software Vulnerability Assessment Service Revenue Share (%), by Country 2025 & 2033
- Figure 26: Asia Pacific Software Vulnerability Assessment Service Revenue (undefined), by Application 2025 & 2033
- Figure 27: Asia Pacific Software Vulnerability Assessment Service Revenue Share (%), by Application 2025 & 2033
- Figure 28: Asia Pacific Software Vulnerability Assessment Service Revenue (undefined), by Type 2025 & 2033
- Figure 29: Asia Pacific Software Vulnerability Assessment Service Revenue Share (%), by Type 2025 & 2033
- Figure 30: Asia Pacific Software Vulnerability Assessment Service Revenue (undefined), by Country 2025 & 2033
- Figure 31: Asia Pacific Software Vulnerability Assessment Service Revenue Share (%), by Country 2025 & 2033
List of Tables
- Table 1: Global Software Vulnerability Assessment Service Revenue undefined Forecast, by Application 2020 & 2033
- Table 2: Global Software Vulnerability Assessment Service Revenue undefined Forecast, by Type 2020 & 2033
- Table 3: Global Software Vulnerability Assessment Service Revenue undefined Forecast, by Region 2020 & 2033
- Table 4: Global Software Vulnerability Assessment Service Revenue undefined Forecast, by Application 2020 & 2033
- Table 5: Global Software Vulnerability Assessment Service Revenue undefined Forecast, by Type 2020 & 2033
- Table 6: Global Software Vulnerability Assessment Service Revenue undefined Forecast, by Country 2020 & 2033
- Table 7: United States Software Vulnerability Assessment Service Revenue (undefined) Forecast, by Application 2020 & 2033
- Table 8: Canada Software Vulnerability Assessment Service Revenue (undefined) Forecast, by Application 2020 & 2033
- Table 9: Mexico Software Vulnerability Assessment Service Revenue (undefined) Forecast, by Application 2020 & 2033
- Table 10: Global Software Vulnerability Assessment Service Revenue undefined Forecast, by Application 2020 & 2033
- Table 11: Global Software Vulnerability Assessment Service Revenue undefined Forecast, by Type 2020 & 2033
- Table 12: Global Software Vulnerability Assessment Service Revenue undefined Forecast, by Country 2020 & 2033
- Table 13: Brazil Software Vulnerability Assessment Service Revenue (undefined) Forecast, by Application 2020 & 2033
- Table 14: Argentina Software Vulnerability Assessment Service Revenue (undefined) Forecast, by Application 2020 & 2033
- Table 15: Rest of South America Software Vulnerability Assessment Service Revenue (undefined) Forecast, by Application 2020 & 2033
- Table 16: Global Software Vulnerability Assessment Service Revenue undefined Forecast, by Application 2020 & 2033
- Table 17: Global Software Vulnerability Assessment Service Revenue undefined Forecast, by Type 2020 & 2033
- Table 18: Global Software Vulnerability Assessment Service Revenue undefined Forecast, by Country 2020 & 2033
- Table 19: United Kingdom Software Vulnerability Assessment Service Revenue (undefined) Forecast, by Application 2020 & 2033
- Table 20: Germany Software Vulnerability Assessment Service Revenue (undefined) Forecast, by Application 2020 & 2033
- Table 21: France Software Vulnerability Assessment Service Revenue (undefined) Forecast, by Application 2020 & 2033
- Table 22: Italy Software Vulnerability Assessment Service Revenue (undefined) Forecast, by Application 2020 & 2033
- Table 23: Spain Software Vulnerability Assessment Service Revenue (undefined) Forecast, by Application 2020 & 2033
- Table 24: Russia Software Vulnerability Assessment Service Revenue (undefined) Forecast, by Application 2020 & 2033
- Table 25: Benelux Software Vulnerability Assessment Service Revenue (undefined) Forecast, by Application 2020 & 2033
- Table 26: Nordics Software Vulnerability Assessment Service Revenue (undefined) Forecast, by Application 2020 & 2033
- Table 27: Rest of Europe Software Vulnerability Assessment Service Revenue (undefined) Forecast, by Application 2020 & 2033
- Table 28: Global Software Vulnerability Assessment Service Revenue undefined Forecast, by Application 2020 & 2033
- Table 29: Global Software Vulnerability Assessment Service Revenue undefined Forecast, by Type 2020 & 2033
- Table 30: Global Software Vulnerability Assessment Service Revenue undefined Forecast, by Country 2020 & 2033
- Table 31: Turkey Software Vulnerability Assessment Service Revenue (undefined) Forecast, by Application 2020 & 2033
- Table 32: Israel Software Vulnerability Assessment Service Revenue (undefined) Forecast, by Application 2020 & 2033
- Table 33: GCC Software Vulnerability Assessment Service Revenue (undefined) Forecast, by Application 2020 & 2033
- Table 34: North Africa Software Vulnerability Assessment Service Revenue (undefined) Forecast, by Application 2020 & 2033
- Table 35: South Africa Software Vulnerability Assessment Service Revenue (undefined) Forecast, by Application 2020 & 2033
- Table 36: Rest of Middle East & Africa Software Vulnerability Assessment Service Revenue (undefined) Forecast, by Application 2020 & 2033
- Table 37: Global Software Vulnerability Assessment Service Revenue undefined Forecast, by Application 2020 & 2033
- Table 38: Global Software Vulnerability Assessment Service Revenue undefined Forecast, by Type 2020 & 2033
- Table 39: Global Software Vulnerability Assessment Service Revenue undefined Forecast, by Country 2020 & 2033
- Table 40: China Software Vulnerability Assessment Service Revenue (undefined) Forecast, by Application 2020 & 2033
- Table 41: India Software Vulnerability Assessment Service Revenue (undefined) Forecast, by Application 2020 & 2033
- Table 42: Japan Software Vulnerability Assessment Service Revenue (undefined) Forecast, by Application 2020 & 2033
- Table 43: South Korea Software Vulnerability Assessment Service Revenue (undefined) Forecast, by Application 2020 & 2033
- Table 44: ASEAN Software Vulnerability Assessment Service Revenue (undefined) Forecast, by Application 2020 & 2033
- Table 45: Oceania Software Vulnerability Assessment Service Revenue (undefined) Forecast, by Application 2020 & 2033
- Table 46: Rest of Asia Pacific Software Vulnerability Assessment Service Revenue (undefined) Forecast, by Application 2020 & 2033
Frequently Asked Questions
1. What is the projected Compound Annual Growth Rate (CAGR) of the Software Vulnerability Assessment Service?
The projected CAGR is approximately 10.93%.
2. Which companies are prominent players in the Software Vulnerability Assessment Service?
Key companies in the market include 99 Percentage, DataArt, Delta3, Wilson Consulting Group, Redscan, eSec Forte Technologies, CSI, Cyberkov, Rackspace, Onapsis, Rapid7, TECTICIAN, SourcetekIT, Optiv, A-LIGN, Netragard, Oracle, intiGrow, Khipu Networks, CIPHER Security, TECH LOCK, Amazon Web Services, Mindtree, Sentek Global, Superior Consulting, Shearwater, Conquest Security, N.B. Service, CHASSasia.
3. What are the main segments of the Software Vulnerability Assessment Service?
The market segments include Application, Type.
4. Can you provide details about the market size?
The market size is estimated to be USD XXX N/A as of 2022.
5. What are some drivers contributing to market growth?
N/A
6. What are the notable trends driving market growth?
N/A
7. Are there any restraints impacting market growth?
N/A
8. Can you provide examples of recent developments in the market?
N/A
9. What pricing options are available for accessing the report?
Pricing options include single-user, multi-user, and enterprise licenses priced at USD 3950.00, USD 5925.00, and USD 7900.00 respectively.
10. Is the market size provided in terms of value or volume?
The market size is provided in terms of value, measured in N/A.
11. Are there any specific market keywords associated with the report?
Yes, the market keyword associated with the report is "Software Vulnerability Assessment Service," which aids in identifying and referencing the specific market segment covered.
12. How do I determine which pricing option suits my needs best?
The pricing options vary based on user requirements and access needs. Individual users may opt for single-user licenses, while businesses requiring broader access may choose multi-user or enterprise licenses for cost-effective access to the report.
13. Are there any additional resources or data provided in the Software Vulnerability Assessment Service report?
While the report offers comprehensive insights, it's advisable to review the specific contents or supplementary materials provided to ascertain if additional resources or data are available.
14. How can I stay updated on further developments or reports in the Software Vulnerability Assessment Service?
To stay informed about further developments, trends, and reports in the Software Vulnerability Assessment Service, consider subscribing to industry newsletters, following relevant companies and organizations, or regularly checking reputable industry news sources and publications.
Methodology
Step 1 - Identification of Relevant Samples Size from Population Database


Step 2 - Approaches for Defining Global Market Size (Value, Volume* & Price*)

Note*: In applicable scenarios
Step 3 - Data Sources
Primary Research
- Web Analytics
- Survey Reports
- Research Institute
- Latest Research Reports
- Opinion Leaders
Secondary Research
- Annual Reports
- White Paper
- Latest Press Release
- Industry Association
- Paid Database
- Investor Presentations

Step 4 - Data Triangulation
Involves using different sources of information in order to increase the validity of a study
These sources are likely to be stakeholders in a program - participants, other researchers, program staff, other community members, and so on.
Then we put all data in single framework & apply various statistical tools to find out the dynamic on the market.
During the analysis stage, feedback from the stakeholder groups would be compared to determine areas of agreement as well as areas of divergence