

Key Insights
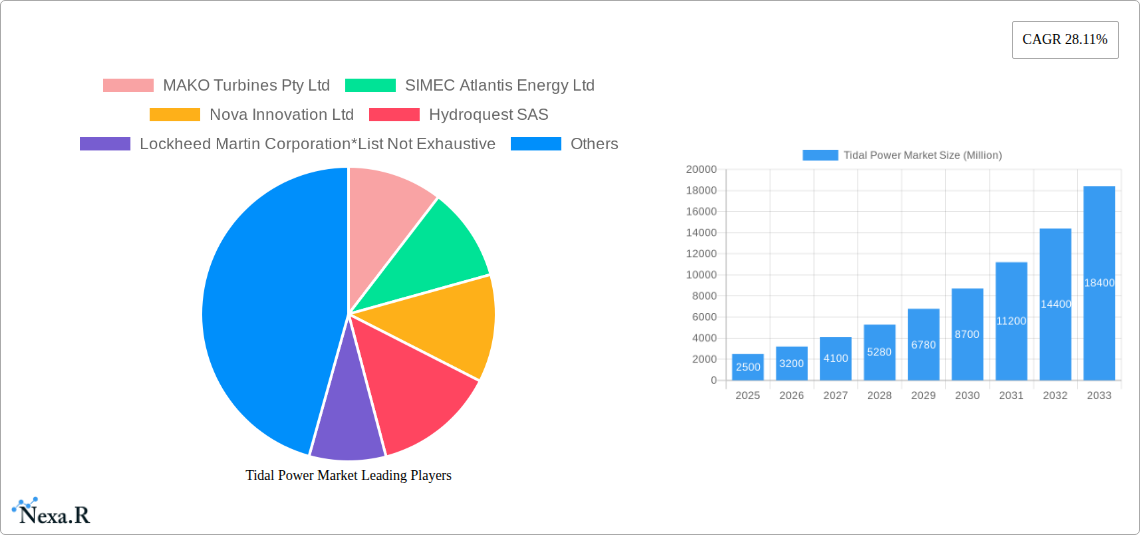
The global tidal power market is experiencing robust growth, projected to reach a substantial size driven by increasing concerns about climate change and the need for sustainable energy sources. The market's Compound Annual Growth Rate (CAGR) of 28.11% from 2019 to 2024 suggests a significant upward trajectory, indicating strong investor interest and technological advancements in tidal energy harnessing. Several factors contribute to this growth. Governments worldwide are increasingly implementing supportive policies and incentives to promote renewable energy adoption, including substantial investments in research and development for tidal power technologies. Furthermore, the declining costs associated with tidal energy technologies, particularly in areas like turbine design and installation, are making tidal power more economically viable compared to traditional fossil fuel-based power generation. The diverse range of technologies available, including tidal barrages, floating platforms, and various turbine designs (horizontal and vertical axis), offers flexibility to suit different geographical and environmental conditions, enhancing the market's potential. While challenges remain, such as the high initial capital investment required and the need for robust infrastructure development in suitable coastal areas, the long-term benefits and environmental advantages of tidal power are likely to overcome these hurdles, ensuring sustained market expansion.
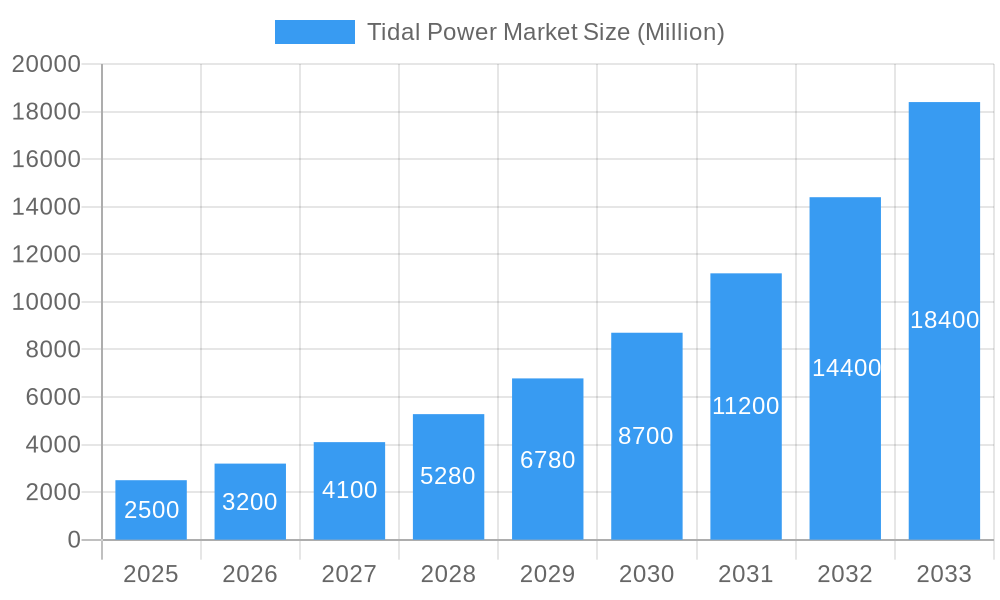
Tidal Power Market Market Size (In Billion)
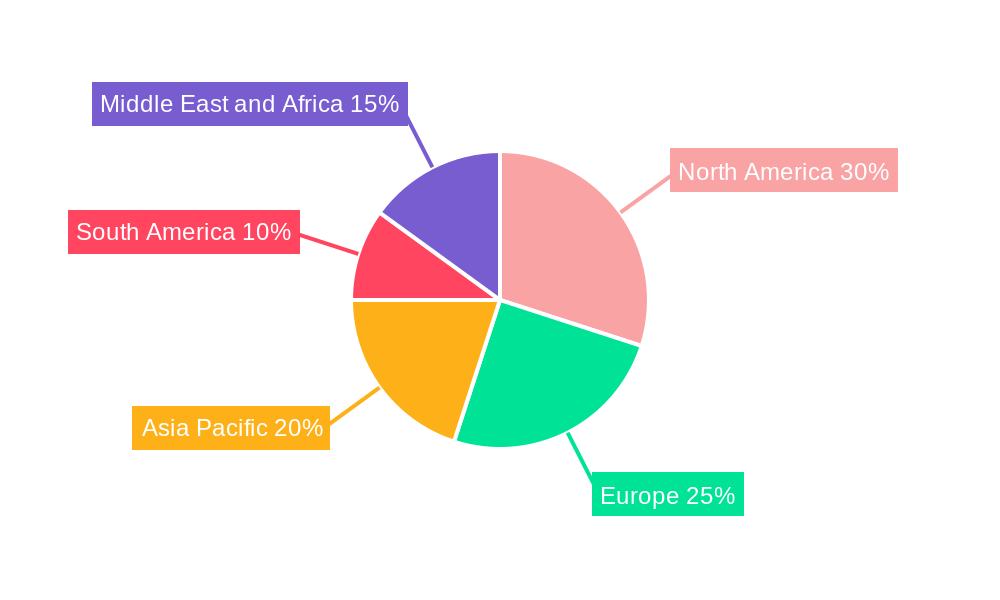
The market segmentation reveals a varied landscape. Tidal stream generation and tidal barrages currently hold significant shares, reflecting their relative maturity and proven track record. However, innovative technologies like floating tidal power platforms and dynamic tidal power systems are gaining traction, promising higher energy conversion efficiencies and greater adaptability to diverse marine environments. The key players in the tidal power market are actively involved in developing and deploying these advancements, fostering competition and further driving innovation. Regional variations exist, with North America and Europe currently holding larger market shares due to early adoption and supportive regulatory frameworks. However, the Asia-Pacific region presents a significant growth opportunity given its vast coastline and increasing energy demands. As technological advancements continue and economies of scale are achieved, the cost-effectiveness of tidal power is expected to improve, making it a more attractive and competitive renewable energy option across a wider geographical reach in the coming years.
Tidal Power Market Company Market Share
Tidal Power Market: A Comprehensive Report (2019-2033)
This in-depth report provides a comprehensive analysis of the global Tidal Power Market, encompassing its dynamics, growth trends, regional segmentation, product landscape, key players, and future outlook. The study period covers 2019-2033, with 2025 as the base and estimated year. The forecast period spans 2025-2033, while the historical period encompasses 2019-2024. This report is essential for industry professionals, investors, and strategists seeking to understand and capitalize on the opportunities within this burgeoning renewable energy sector. The total market size is predicted to reach xx Million by 2033.
Tidal Power Market Market Dynamics & Structure
The tidal power market is characterized by a moderately concentrated structure with a few major players and numerous smaller companies. Technological innovation, particularly in tidal energy converters and power generation methods, is a key driver. Regulatory frameworks, including government incentives and environmental regulations, significantly influence market growth. Competitive substitutes, such as offshore wind and wave energy, pose challenges, while increasing energy demands and a growing focus on renewable energy sources fuel market expansion. Mergers and acquisitions (M&A) activity is expected to increase as larger companies seek to consolidate their market share and gain access to new technologies. The market is segmented by Power Generation Method (Tidal Barrage, Floating Tidal Power Platform, Tidal Stream Generation, Dynamic Tidal Power) and Tidal Energy Converters (Horizontal Axis Turbine, Vertical Axis Turbine, Other Tidal Energy Converters).
- Market Concentration: Moderately concentrated, with a Herfindahl-Hirschman Index (HHI) estimated at xx.
- Technological Innovation: Significant advancements in turbine design, energy storage, and grid integration are driving growth.
- Regulatory Landscape: Government policies supporting renewable energy, coupled with environmental regulations, shape market dynamics.
- M&A Activity: Expected to increase, with xx deals projected between 2025 and 2033.
- Competitive Substitutes: Offshore wind and wave energy present competition, but the unique characteristics of tidal power offer advantages in certain locations.
Tidal Power Market Growth Trends & Insights
The global tidal power market is experiencing robust growth, driven by rising energy demand, increasing environmental concerns, and supportive government policies. The market size has grown from xx Million in 2019 to xx Million in 2024, with a Compound Annual Growth Rate (CAGR) of xx%. This growth is expected to continue, with the market projected to reach xx Million by 2033, exhibiting a CAGR of xx% during the forecast period. Technological disruptions, such as advancements in turbine efficiency and the development of innovative energy storage solutions, are accelerating adoption rates. Consumer behavior is shifting towards greater acceptance of renewable energy sources, further boosting market demand. Market penetration is increasing gradually, with xx% of the renewable energy market share predicted by 2033.
Dominant Regions, Countries, or Segments in Tidal Power Market
The European region currently holds the largest market share in the tidal power market, driven by supportive government policies, substantial investments in research and development, and the availability of suitable geographical locations. Specific countries like the UK and France are prominent players. The Tidal Stream Generation segment dominates the market due to its relatively lower cost and established technology. The Floating Tidal Power Platform segment is showing significant growth potential due to its adaptability to various water depths and its suitability for offshore locations.
- Key Drivers: Favorable government policies, substantial R&D investments, technological advancements.
- Europe: Dominant region due to established infrastructure, substantial investments, and favorable policy environments.
- Tidal Stream Generation: Highest market share due to technological maturity and cost-effectiveness.
- Floating Tidal Power Platform: High growth potential due to adaptability and suitability for offshore locations.
Tidal Power Market Product Landscape
The tidal power market offers a range of products, including different types of turbines (horizontal axis, vertical axis), power generation methods (barrages, platforms, stream generation), and energy storage solutions. Recent innovations focus on improving turbine efficiency, enhancing durability, and reducing the overall cost of energy. Unique selling propositions include reliability, predictability of energy generation, and minimal environmental impact compared to other energy sources. Technological advancements include improved blade designs, advanced control systems, and the integration of smart grid technologies.
Key Drivers, Barriers & Challenges in Tidal Power Market
Key Drivers: Increased demand for renewable energy, supportive government policies, technological advancements leading to improved efficiency and cost-reduction, and the need for energy security.
Challenges: High initial capital costs, technological complexity, environmental concerns related to marine ecosystems, grid integration challenges, and the need for suitable geographical locations with strong tidal currents. These challenges contribute to a slower market growth rate compared to other renewable energy sources. Supply chain issues can lead to project delays and cost overruns. Regulatory hurdles can vary significantly across regions.
Emerging Opportunities in Tidal Power Market
Emerging opportunities include the development of hybrid tidal-wind farms, integration of tidal energy into smart grids, exploration of untapped markets in developing countries with significant tidal resources, and the growth of microgrids and off-grid applications. Innovative applications, such as using tidal energy for desalination and water pumping, also present significant market potential. Evolving consumer preferences toward sustainable energy solutions further enhance market growth prospects.
Growth Accelerators in the Tidal Power Market Industry
Technological breakthroughs in turbine design and energy storage, coupled with strategic partnerships between technology developers, energy companies, and governmental organizations, are key growth accelerators. Market expansion strategies focusing on underserved regions with substantial tidal resources and increased private sector investment are driving the industry’s growth. Cost reductions achieved through economies of scale and technological improvements are also significant factors.
Key Players Shaping the Tidal Power Market Market
- MAKO Turbines Pty Ltd
- SIMEC Atlantis Energy Ltd
- Nova Innovation Ltd
- Hydroquest SAS
- Lockheed Martin Corporation
- Orbital Marine Power Ltd
- Sustainable Marine Energy Ltd
- Andritz AG
Notable Milestones in Tidal Power Market Sector
- March 2023: A grid-independent tidal energy demonstration project commenced in Singapore, marking a first for Southeast Asia. Bluenergy Solutions, with participation from NYK, aims to commercialize tidal energy generation.
- March 2023: Walton Marina assisted BigMoon Power in its tidal energy project in Minas Basin, providing anchor launching facilities for floating machinery.
- September 2022: Sabella (France) partnered with PT PLN (Persero) and PT Meindo Elang Indah (Indonesia) for a feasibility study on creating the world's first tidal energy farm in Indonesia.
In-Depth Tidal Power Market Market Outlook
The tidal power market is poised for significant growth in the coming years, driven by the factors mentioned above. The increasing urgency to transition to renewable energy, technological advancements making the technology more competitive, and supportive government policies will unlock substantial market potential. Strategic partnerships and innovative business models are crucial for overcoming existing challenges and accelerating market penetration, creating a promising outlook for investors and industry stakeholders.
Tidal Power Market Segmentation
-
1. Power Generation Method
- 1.1. Tidal Barrage
- 1.2. Floating Tidal Power Platform
- 1.3. Tidal Stream Generation
- 1.4. Dynamic Tidal Power
-
2. Tidal Energy Converters
- 2.1. Horizontal Axis Turbine
- 2.2. Vertical Axis Turbine
- 2.3. Other Tidal Energy Converters
Tidal Power Market Segmentation By Geography
-
1. North America
- 1.1. United States
- 1.2. Canada
- 1.3. Rest of North America
-
2. Europe
- 2.1. United Kingdom
- 2.2. Denmark
- 2.3. France
- 2.4. Rest of the Europe
-
3. Asia Pacific
- 3.1. China
- 3.2. India
- 3.3. Japan
- 3.4. Rest of the Asia Pacific
-
4. South America
- 4.1. Brazil
- 4.2. Argentina
- 4.3. Rest of South America
-
5. Middle East and Africa
- 5.1. United Arab Emirates
- 5.2. South Africa
- 5.3. Saudi Arabia
- 5.4. Rest of Middle East and Africa
Tidal Power Market Regional Market Share
Geographic Coverage of Tidal Power Market
Tidal Power Market REPORT HIGHLIGHTS
| Aspects | Details |
|---|---|
| Study Period | 2020-2034 |
| Base Year | 2025 |
| Estimated Year | 2026 |
| Forecast Period | 2026-2034 |
| Historical Period | 2020-2025 |
| Growth Rate | CAGR of 11.3% from 2020-2034 |
| Segmentation |
|
Table of Contents
- 1. Introduction
- 1.1. Research Scope
- 1.2. Market Segmentation
- 1.3. Research Methodology
- 1.4. Definitions and Assumptions
- 2. Executive Summary
- 2.1. Introduction
- 3. Market Dynamics
- 3.1. Introduction
- 3.2. Market Drivers
- 3.2.1. 4.; Global Energy Transition Toward Renewables4.; The Rollout of New Technologies in Many Developed Countries
- 3.3. Market Restrains
- 3.3.1. 4.; The Technology's Exorbitant Costs and Environmental Impacts
- 3.4. Market Trends
- 3.4.1. Floating Tidal Power Platform Expected to Witness Significant Growth
- 4. Market Factor Analysis
- 4.1. Porters Five Forces
- 4.2. Supply/Value Chain
- 4.3. PESTEL analysis
- 4.4. Market Entropy
- 4.5. Patent/Trademark Analysis
- 5. Global Tidal Power Market Analysis, Insights and Forecast, 2020-2032
- 5.1. Market Analysis, Insights and Forecast - by Power Generation Method
- 5.1.1. Tidal Barrage
- 5.1.2. Floating Tidal Power Platform
- 5.1.3. Tidal Stream Generation
- 5.1.4. Dynamic Tidal Power
- 5.2. Market Analysis, Insights and Forecast - by Tidal Energy Converters
- 5.2.1. Horizontal Axis Turbine
- 5.2.2. Vertical Axis Turbine
- 5.2.3. Other Tidal Energy Converters
- 5.3. Market Analysis, Insights and Forecast - by Region
- 5.3.1. North America
- 5.3.2. Europe
- 5.3.3. Asia Pacific
- 5.3.4. South America
- 5.3.5. Middle East and Africa
- 5.1. Market Analysis, Insights and Forecast - by Power Generation Method
- 6. North America Tidal Power Market Analysis, Insights and Forecast, 2020-2032
- 6.1. Market Analysis, Insights and Forecast - by Power Generation Method
- 6.1.1. Tidal Barrage
- 6.1.2. Floating Tidal Power Platform
- 6.1.3. Tidal Stream Generation
- 6.1.4. Dynamic Tidal Power
- 6.2. Market Analysis, Insights and Forecast - by Tidal Energy Converters
- 6.2.1. Horizontal Axis Turbine
- 6.2.2. Vertical Axis Turbine
- 6.2.3. Other Tidal Energy Converters
- 6.1. Market Analysis, Insights and Forecast - by Power Generation Method
- 7. Europe Tidal Power Market Analysis, Insights and Forecast, 2020-2032
- 7.1. Market Analysis, Insights and Forecast - by Power Generation Method
- 7.1.1. Tidal Barrage
- 7.1.2. Floating Tidal Power Platform
- 7.1.3. Tidal Stream Generation
- 7.1.4. Dynamic Tidal Power
- 7.2. Market Analysis, Insights and Forecast - by Tidal Energy Converters
- 7.2.1. Horizontal Axis Turbine
- 7.2.2. Vertical Axis Turbine
- 7.2.3. Other Tidal Energy Converters
- 7.1. Market Analysis, Insights and Forecast - by Power Generation Method
- 8. Asia Pacific Tidal Power Market Analysis, Insights and Forecast, 2020-2032
- 8.1. Market Analysis, Insights and Forecast - by Power Generation Method
- 8.1.1. Tidal Barrage
- 8.1.2. Floating Tidal Power Platform
- 8.1.3. Tidal Stream Generation
- 8.1.4. Dynamic Tidal Power
- 8.2. Market Analysis, Insights and Forecast - by Tidal Energy Converters
- 8.2.1. Horizontal Axis Turbine
- 8.2.2. Vertical Axis Turbine
- 8.2.3. Other Tidal Energy Converters
- 8.1. Market Analysis, Insights and Forecast - by Power Generation Method
- 9. South America Tidal Power Market Analysis, Insights and Forecast, 2020-2032
- 9.1. Market Analysis, Insights and Forecast - by Power Generation Method
- 9.1.1. Tidal Barrage
- 9.1.2. Floating Tidal Power Platform
- 9.1.3. Tidal Stream Generation
- 9.1.4. Dynamic Tidal Power
- 9.2. Market Analysis, Insights and Forecast - by Tidal Energy Converters
- 9.2.1. Horizontal Axis Turbine
- 9.2.2. Vertical Axis Turbine
- 9.2.3. Other Tidal Energy Converters
- 9.1. Market Analysis, Insights and Forecast - by Power Generation Method
- 10. Middle East and Africa Tidal Power Market Analysis, Insights and Forecast, 2020-2032
- 10.1. Market Analysis, Insights and Forecast - by Power Generation Method
- 10.1.1. Tidal Barrage
- 10.1.2. Floating Tidal Power Platform
- 10.1.3. Tidal Stream Generation
- 10.1.4. Dynamic Tidal Power
- 10.2. Market Analysis, Insights and Forecast - by Tidal Energy Converters
- 10.2.1. Horizontal Axis Turbine
- 10.2.2. Vertical Axis Turbine
- 10.2.3. Other Tidal Energy Converters
- 10.1. Market Analysis, Insights and Forecast - by Power Generation Method
- 11. Competitive Analysis
- 11.1. Global Market Share Analysis 2025
- 11.2. Company Profiles
- 11.2.1 MAKO Turbines Pty Ltd
- 11.2.1.1. Overview
- 11.2.1.2. Products
- 11.2.1.3. SWOT Analysis
- 11.2.1.4. Recent Developments
- 11.2.1.5. Financials (Based on Availability)
- 11.2.2 SIMEC Atlantis Energy Ltd
- 11.2.2.1. Overview
- 11.2.2.2. Products
- 11.2.2.3. SWOT Analysis
- 11.2.2.4. Recent Developments
- 11.2.2.5. Financials (Based on Availability)
- 11.2.3 Nova Innovation Ltd
- 11.2.3.1. Overview
- 11.2.3.2. Products
- 11.2.3.3. SWOT Analysis
- 11.2.3.4. Recent Developments
- 11.2.3.5. Financials (Based on Availability)
- 11.2.4 Hydroquest SAS
- 11.2.4.1. Overview
- 11.2.4.2. Products
- 11.2.4.3. SWOT Analysis
- 11.2.4.4. Recent Developments
- 11.2.4.5. Financials (Based on Availability)
- 11.2.5 Lockheed Martin Corporation*List Not Exhaustive
- 11.2.5.1. Overview
- 11.2.5.2. Products
- 11.2.5.3. SWOT Analysis
- 11.2.5.4. Recent Developments
- 11.2.5.5. Financials (Based on Availability)
- 11.2.6 Orbital Marine Power Ltd
- 11.2.6.1. Overview
- 11.2.6.2. Products
- 11.2.6.3. SWOT Analysis
- 11.2.6.4. Recent Developments
- 11.2.6.5. Financials (Based on Availability)
- 11.2.7 Sustainable Marine Energy Ltd
- 11.2.7.1. Overview
- 11.2.7.2. Products
- 11.2.7.3. SWOT Analysis
- 11.2.7.4. Recent Developments
- 11.2.7.5. Financials (Based on Availability)
- 11.2.8 Andritz AG
- 11.2.8.1. Overview
- 11.2.8.2. Products
- 11.2.8.3. SWOT Analysis
- 11.2.8.4. Recent Developments
- 11.2.8.5. Financials (Based on Availability)
- 11.2.1 MAKO Turbines Pty Ltd
List of Figures
- Figure 1: Global Tidal Power Market Revenue Breakdown (undefined, %) by Region 2025 & 2033
- Figure 2: Global Tidal Power Market Volume Breakdown (gigawatt, %) by Region 2025 & 2033
- Figure 3: North America Tidal Power Market Revenue (undefined), by Power Generation Method 2025 & 2033
- Figure 4: North America Tidal Power Market Volume (gigawatt), by Power Generation Method 2025 & 2033
- Figure 5: North America Tidal Power Market Revenue Share (%), by Power Generation Method 2025 & 2033
- Figure 6: North America Tidal Power Market Volume Share (%), by Power Generation Method 2025 & 2033
- Figure 7: North America Tidal Power Market Revenue (undefined), by Tidal Energy Converters 2025 & 2033
- Figure 8: North America Tidal Power Market Volume (gigawatt), by Tidal Energy Converters 2025 & 2033
- Figure 9: North America Tidal Power Market Revenue Share (%), by Tidal Energy Converters 2025 & 2033
- Figure 10: North America Tidal Power Market Volume Share (%), by Tidal Energy Converters 2025 & 2033
- Figure 11: North America Tidal Power Market Revenue (undefined), by Country 2025 & 2033
- Figure 12: North America Tidal Power Market Volume (gigawatt), by Country 2025 & 2033
- Figure 13: North America Tidal Power Market Revenue Share (%), by Country 2025 & 2033
- Figure 14: North America Tidal Power Market Volume Share (%), by Country 2025 & 2033
- Figure 15: Europe Tidal Power Market Revenue (undefined), by Power Generation Method 2025 & 2033
- Figure 16: Europe Tidal Power Market Volume (gigawatt), by Power Generation Method 2025 & 2033
- Figure 17: Europe Tidal Power Market Revenue Share (%), by Power Generation Method 2025 & 2033
- Figure 18: Europe Tidal Power Market Volume Share (%), by Power Generation Method 2025 & 2033
- Figure 19: Europe Tidal Power Market Revenue (undefined), by Tidal Energy Converters 2025 & 2033
- Figure 20: Europe Tidal Power Market Volume (gigawatt), by Tidal Energy Converters 2025 & 2033
- Figure 21: Europe Tidal Power Market Revenue Share (%), by Tidal Energy Converters 2025 & 2033
- Figure 22: Europe Tidal Power Market Volume Share (%), by Tidal Energy Converters 2025 & 2033
- Figure 23: Europe Tidal Power Market Revenue (undefined), by Country 2025 & 2033
- Figure 24: Europe Tidal Power Market Volume (gigawatt), by Country 2025 & 2033
- Figure 25: Europe Tidal Power Market Revenue Share (%), by Country 2025 & 2033
- Figure 26: Europe Tidal Power Market Volume Share (%), by Country 2025 & 2033
- Figure 27: Asia Pacific Tidal Power Market Revenue (undefined), by Power Generation Method 2025 & 2033
- Figure 28: Asia Pacific Tidal Power Market Volume (gigawatt), by Power Generation Method 2025 & 2033
- Figure 29: Asia Pacific Tidal Power Market Revenue Share (%), by Power Generation Method 2025 & 2033
- Figure 30: Asia Pacific Tidal Power Market Volume Share (%), by Power Generation Method 2025 & 2033
- Figure 31: Asia Pacific Tidal Power Market Revenue (undefined), by Tidal Energy Converters 2025 & 2033
- Figure 32: Asia Pacific Tidal Power Market Volume (gigawatt), by Tidal Energy Converters 2025 & 2033
- Figure 33: Asia Pacific Tidal Power Market Revenue Share (%), by Tidal Energy Converters 2025 & 2033
- Figure 34: Asia Pacific Tidal Power Market Volume Share (%), by Tidal Energy Converters 2025 & 2033
- Figure 35: Asia Pacific Tidal Power Market Revenue (undefined), by Country 2025 & 2033
- Figure 36: Asia Pacific Tidal Power Market Volume (gigawatt), by Country 2025 & 2033
- Figure 37: Asia Pacific Tidal Power Market Revenue Share (%), by Country 2025 & 2033
- Figure 38: Asia Pacific Tidal Power Market Volume Share (%), by Country 2025 & 2033
- Figure 39: South America Tidal Power Market Revenue (undefined), by Power Generation Method 2025 & 2033
- Figure 40: South America Tidal Power Market Volume (gigawatt), by Power Generation Method 2025 & 2033
- Figure 41: South America Tidal Power Market Revenue Share (%), by Power Generation Method 2025 & 2033
- Figure 42: South America Tidal Power Market Volume Share (%), by Power Generation Method 2025 & 2033
- Figure 43: South America Tidal Power Market Revenue (undefined), by Tidal Energy Converters 2025 & 2033
- Figure 44: South America Tidal Power Market Volume (gigawatt), by Tidal Energy Converters 2025 & 2033
- Figure 45: South America Tidal Power Market Revenue Share (%), by Tidal Energy Converters 2025 & 2033
- Figure 46: South America Tidal Power Market Volume Share (%), by Tidal Energy Converters 2025 & 2033
- Figure 47: South America Tidal Power Market Revenue (undefined), by Country 2025 & 2033
- Figure 48: South America Tidal Power Market Volume (gigawatt), by Country 2025 & 2033
- Figure 49: South America Tidal Power Market Revenue Share (%), by Country 2025 & 2033
- Figure 50: South America Tidal Power Market Volume Share (%), by Country 2025 & 2033
- Figure 51: Middle East and Africa Tidal Power Market Revenue (undefined), by Power Generation Method 2025 & 2033
- Figure 52: Middle East and Africa Tidal Power Market Volume (gigawatt), by Power Generation Method 2025 & 2033
- Figure 53: Middle East and Africa Tidal Power Market Revenue Share (%), by Power Generation Method 2025 & 2033
- Figure 54: Middle East and Africa Tidal Power Market Volume Share (%), by Power Generation Method 2025 & 2033
- Figure 55: Middle East and Africa Tidal Power Market Revenue (undefined), by Tidal Energy Converters 2025 & 2033
- Figure 56: Middle East and Africa Tidal Power Market Volume (gigawatt), by Tidal Energy Converters 2025 & 2033
- Figure 57: Middle East and Africa Tidal Power Market Revenue Share (%), by Tidal Energy Converters 2025 & 2033
- Figure 58: Middle East and Africa Tidal Power Market Volume Share (%), by Tidal Energy Converters 2025 & 2033
- Figure 59: Middle East and Africa Tidal Power Market Revenue (undefined), by Country 2025 & 2033
- Figure 60: Middle East and Africa Tidal Power Market Volume (gigawatt), by Country 2025 & 2033
- Figure 61: Middle East and Africa Tidal Power Market Revenue Share (%), by Country 2025 & 2033
- Figure 62: Middle East and Africa Tidal Power Market Volume Share (%), by Country 2025 & 2033
List of Tables
- Table 1: Global Tidal Power Market Revenue undefined Forecast, by Power Generation Method 2020 & 2033
- Table 2: Global Tidal Power Market Volume gigawatt Forecast, by Power Generation Method 2020 & 2033
- Table 3: Global Tidal Power Market Revenue undefined Forecast, by Tidal Energy Converters 2020 & 2033
- Table 4: Global Tidal Power Market Volume gigawatt Forecast, by Tidal Energy Converters 2020 & 2033
- Table 5: Global Tidal Power Market Revenue undefined Forecast, by Region 2020 & 2033
- Table 6: Global Tidal Power Market Volume gigawatt Forecast, by Region 2020 & 2033
- Table 7: Global Tidal Power Market Revenue undefined Forecast, by Power Generation Method 2020 & 2033
- Table 8: Global Tidal Power Market Volume gigawatt Forecast, by Power Generation Method 2020 & 2033
- Table 9: Global Tidal Power Market Revenue undefined Forecast, by Tidal Energy Converters 2020 & 2033
- Table 10: Global Tidal Power Market Volume gigawatt Forecast, by Tidal Energy Converters 2020 & 2033
- Table 11: Global Tidal Power Market Revenue undefined Forecast, by Country 2020 & 2033
- Table 12: Global Tidal Power Market Volume gigawatt Forecast, by Country 2020 & 2033
- Table 13: United States Tidal Power Market Revenue (undefined) Forecast, by Application 2020 & 2033
- Table 14: United States Tidal Power Market Volume (gigawatt) Forecast, by Application 2020 & 2033
- Table 15: Canada Tidal Power Market Revenue (undefined) Forecast, by Application 2020 & 2033
- Table 16: Canada Tidal Power Market Volume (gigawatt) Forecast, by Application 2020 & 2033
- Table 17: Rest of North America Tidal Power Market Revenue (undefined) Forecast, by Application 2020 & 2033
- Table 18: Rest of North America Tidal Power Market Volume (gigawatt) Forecast, by Application 2020 & 2033
- Table 19: Global Tidal Power Market Revenue undefined Forecast, by Power Generation Method 2020 & 2033
- Table 20: Global Tidal Power Market Volume gigawatt Forecast, by Power Generation Method 2020 & 2033
- Table 21: Global Tidal Power Market Revenue undefined Forecast, by Tidal Energy Converters 2020 & 2033
- Table 22: Global Tidal Power Market Volume gigawatt Forecast, by Tidal Energy Converters 2020 & 2033
- Table 23: Global Tidal Power Market Revenue undefined Forecast, by Country 2020 & 2033
- Table 24: Global Tidal Power Market Volume gigawatt Forecast, by Country 2020 & 2033
- Table 25: United Kingdom Tidal Power Market Revenue (undefined) Forecast, by Application 2020 & 2033
- Table 26: United Kingdom Tidal Power Market Volume (gigawatt) Forecast, by Application 2020 & 2033
- Table 27: Denmark Tidal Power Market Revenue (undefined) Forecast, by Application 2020 & 2033
- Table 28: Denmark Tidal Power Market Volume (gigawatt) Forecast, by Application 2020 & 2033
- Table 29: France Tidal Power Market Revenue (undefined) Forecast, by Application 2020 & 2033
- Table 30: France Tidal Power Market Volume (gigawatt) Forecast, by Application 2020 & 2033
- Table 31: Rest of the Europe Tidal Power Market Revenue (undefined) Forecast, by Application 2020 & 2033
- Table 32: Rest of the Europe Tidal Power Market Volume (gigawatt) Forecast, by Application 2020 & 2033
- Table 33: Global Tidal Power Market Revenue undefined Forecast, by Power Generation Method 2020 & 2033
- Table 34: Global Tidal Power Market Volume gigawatt Forecast, by Power Generation Method 2020 & 2033
- Table 35: Global Tidal Power Market Revenue undefined Forecast, by Tidal Energy Converters 2020 & 2033
- Table 36: Global Tidal Power Market Volume gigawatt Forecast, by Tidal Energy Converters 2020 & 2033
- Table 37: Global Tidal Power Market Revenue undefined Forecast, by Country 2020 & 2033
- Table 38: Global Tidal Power Market Volume gigawatt Forecast, by Country 2020 & 2033
- Table 39: China Tidal Power Market Revenue (undefined) Forecast, by Application 2020 & 2033
- Table 40: China Tidal Power Market Volume (gigawatt) Forecast, by Application 2020 & 2033
- Table 41: India Tidal Power Market Revenue (undefined) Forecast, by Application 2020 & 2033
- Table 42: India Tidal Power Market Volume (gigawatt) Forecast, by Application 2020 & 2033
- Table 43: Japan Tidal Power Market Revenue (undefined) Forecast, by Application 2020 & 2033
- Table 44: Japan Tidal Power Market Volume (gigawatt) Forecast, by Application 2020 & 2033
- Table 45: Rest of the Asia Pacific Tidal Power Market Revenue (undefined) Forecast, by Application 2020 & 2033
- Table 46: Rest of the Asia Pacific Tidal Power Market Volume (gigawatt) Forecast, by Application 2020 & 2033
- Table 47: Global Tidal Power Market Revenue undefined Forecast, by Power Generation Method 2020 & 2033
- Table 48: Global Tidal Power Market Volume gigawatt Forecast, by Power Generation Method 2020 & 2033
- Table 49: Global Tidal Power Market Revenue undefined Forecast, by Tidal Energy Converters 2020 & 2033
- Table 50: Global Tidal Power Market Volume gigawatt Forecast, by Tidal Energy Converters 2020 & 2033
- Table 51: Global Tidal Power Market Revenue undefined Forecast, by Country 2020 & 2033
- Table 52: Global Tidal Power Market Volume gigawatt Forecast, by Country 2020 & 2033
- Table 53: Brazil Tidal Power Market Revenue (undefined) Forecast, by Application 2020 & 2033
- Table 54: Brazil Tidal Power Market Volume (gigawatt) Forecast, by Application 2020 & 2033
- Table 55: Argentina Tidal Power Market Revenue (undefined) Forecast, by Application 2020 & 2033
- Table 56: Argentina Tidal Power Market Volume (gigawatt) Forecast, by Application 2020 & 2033
- Table 57: Rest of South America Tidal Power Market Revenue (undefined) Forecast, by Application 2020 & 2033
- Table 58: Rest of South America Tidal Power Market Volume (gigawatt) Forecast, by Application 2020 & 2033
- Table 59: Global Tidal Power Market Revenue undefined Forecast, by Power Generation Method 2020 & 2033
- Table 60: Global Tidal Power Market Volume gigawatt Forecast, by Power Generation Method 2020 & 2033
- Table 61: Global Tidal Power Market Revenue undefined Forecast, by Tidal Energy Converters 2020 & 2033
- Table 62: Global Tidal Power Market Volume gigawatt Forecast, by Tidal Energy Converters 2020 & 2033
- Table 63: Global Tidal Power Market Revenue undefined Forecast, by Country 2020 & 2033
- Table 64: Global Tidal Power Market Volume gigawatt Forecast, by Country 2020 & 2033
- Table 65: United Arab Emirates Tidal Power Market Revenue (undefined) Forecast, by Application 2020 & 2033
- Table 66: United Arab Emirates Tidal Power Market Volume (gigawatt) Forecast, by Application 2020 & 2033
- Table 67: South Africa Tidal Power Market Revenue (undefined) Forecast, by Application 2020 & 2033
- Table 68: South Africa Tidal Power Market Volume (gigawatt) Forecast, by Application 2020 & 2033
- Table 69: Saudi Arabia Tidal Power Market Revenue (undefined) Forecast, by Application 2020 & 2033
- Table 70: Saudi Arabia Tidal Power Market Volume (gigawatt) Forecast, by Application 2020 & 2033
- Table 71: Rest of Middle East and Africa Tidal Power Market Revenue (undefined) Forecast, by Application 2020 & 2033
- Table 72: Rest of Middle East and Africa Tidal Power Market Volume (gigawatt) Forecast, by Application 2020 & 2033
Frequently Asked Questions
1. What is the projected Compound Annual Growth Rate (CAGR) of the Tidal Power Market?
The projected CAGR is approximately 11.3%.
2. Which companies are prominent players in the Tidal Power Market?
Key companies in the market include MAKO Turbines Pty Ltd, SIMEC Atlantis Energy Ltd, Nova Innovation Ltd, Hydroquest SAS, Lockheed Martin Corporation*List Not Exhaustive, Orbital Marine Power Ltd, Sustainable Marine Energy Ltd, Andritz AG.
3. What are the main segments of the Tidal Power Market?
The market segments include Power Generation Method, Tidal Energy Converters.
4. Can you provide details about the market size?
The market size is estimated to be USD XXX N/A as of 2022.
5. What are some drivers contributing to market growth?
4.; Global Energy Transition Toward Renewables4.; The Rollout of New Technologies in Many Developed Countries.
6. What are the notable trends driving market growth?
Floating Tidal Power Platform Expected to Witness Significant Growth.
7. Are there any restraints impacting market growth?
4.; The Technology's Exorbitant Costs and Environmental Impacts.
8. Can you provide examples of recent developments in the market?
March 2023, for the first time in Southeast Asia, a tidal-energy demonstration outside the grid in Singapore began generating power. NYK participated in this demonstration project, which is being run by Bluenergy Solutions, a marine renewable energy solutions developer, off Raffles Lighthouse on Satumu Island, some 14 kilometers off Singapore's main island. The project's goal is to commercialize tidal energy generation and supply.
9. What pricing options are available for accessing the report?
Pricing options include single-user, multi-user, and enterprise licenses priced at USD 4750, USD 5250, and USD 8750 respectively.
10. Is the market size provided in terms of value or volume?
The market size is provided in terms of value, measured in N/A and volume, measured in gigawatt.
11. Are there any specific market keywords associated with the report?
Yes, the market keyword associated with the report is "Tidal Power Market," which aids in identifying and referencing the specific market segment covered.
12. How do I determine which pricing option suits my needs best?
The pricing options vary based on user requirements and access needs. Individual users may opt for single-user licenses, while businesses requiring broader access may choose multi-user or enterprise licenses for cost-effective access to the report.
13. Are there any additional resources or data provided in the Tidal Power Market report?
While the report offers comprehensive insights, it's advisable to review the specific contents or supplementary materials provided to ascertain if additional resources or data are available.
14. How can I stay updated on further developments or reports in the Tidal Power Market?
To stay informed about further developments, trends, and reports in the Tidal Power Market, consider subscribing to industry newsletters, following relevant companies and organizations, or regularly checking reputable industry news sources and publications.
Methodology
Step 1 - Identification of Relevant Samples Size from Population Database


Step 2 - Approaches for Defining Global Market Size (Value, Volume* & Price*)

Note*: In applicable scenarios
Step 3 - Data Sources
Primary Research
- Web Analytics
- Survey Reports
- Research Institute
- Latest Research Reports
- Opinion Leaders
Secondary Research
- Annual Reports
- White Paper
- Latest Press Release
- Industry Association
- Paid Database
- Investor Presentations

Step 4 - Data Triangulation
Involves using different sources of information in order to increase the validity of a study
These sources are likely to be stakeholders in a program - participants, other researchers, program staff, other community members, and so on.
Then we put all data in single framework & apply various statistical tools to find out the dynamic on the market.
During the analysis stage, feedback from the stakeholder groups would be compared to determine areas of agreement as well as areas of divergence