

Key Insights
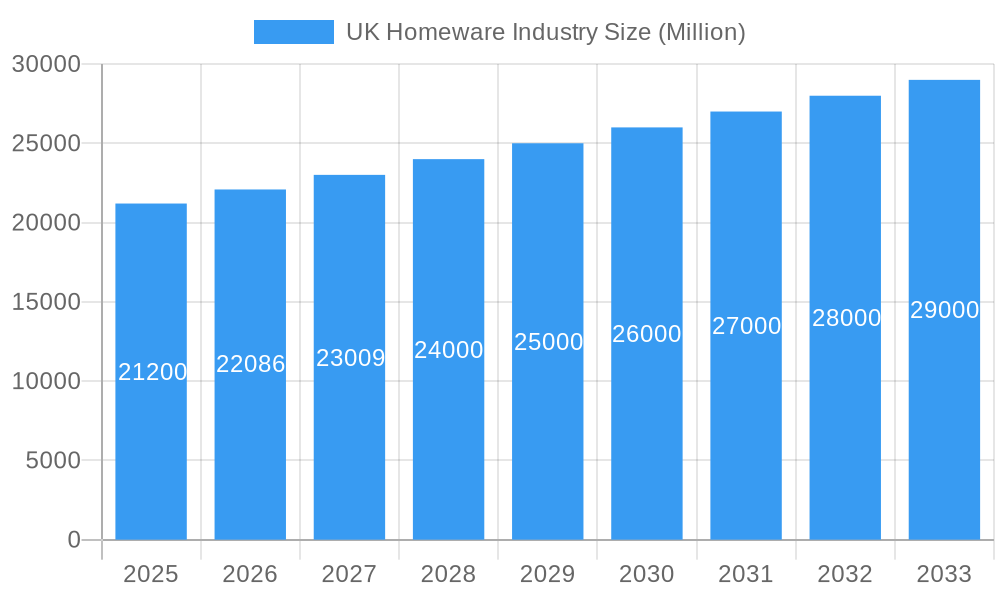
The UK homeware market, valued at £21.20 billion in 2025, is projected to experience steady growth, exhibiting a Compound Annual Growth Rate (CAGR) of 4.17% from 2025 to 2033. This growth is fueled by several key drivers. Increasing disposable incomes amongst a significant portion of the UK population are leading to higher spending on home improvement and furnishing. The rise of online retail channels, offering convenience and wider product selection, significantly contributes to market expansion. Furthermore, a growing trend towards home-centric lifestyles, influenced by factors like remote working and a renewed focus on creating comfortable and aesthetically pleasing living spaces, boosts demand for diverse homeware products. The market segmentation reveals a diverse landscape with strong performance across product categories, from home furniture and textiles to appliances and décor. While supermarkets and hypermarkets remain major distribution channels, the online segment is witnessing rapid expansion, posing both opportunities and challenges for established players. Competition remains robust, with both international giants and smaller specialized retailers vying for market share. Potential restraints include economic downturns, fluctuations in raw material prices, and evolving consumer preferences.
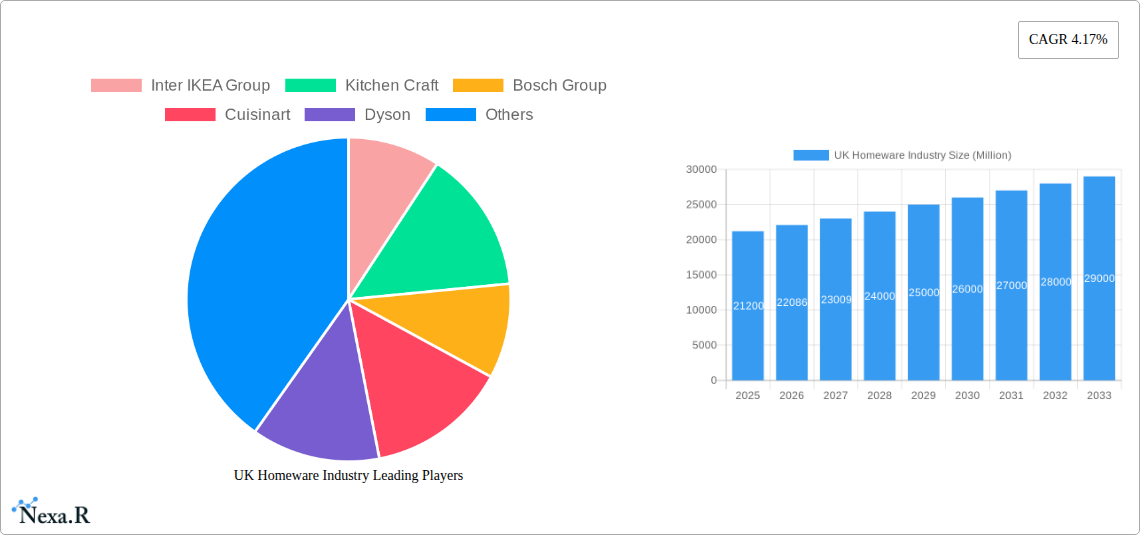
UK Homeware Industry Market Size (In Billion)
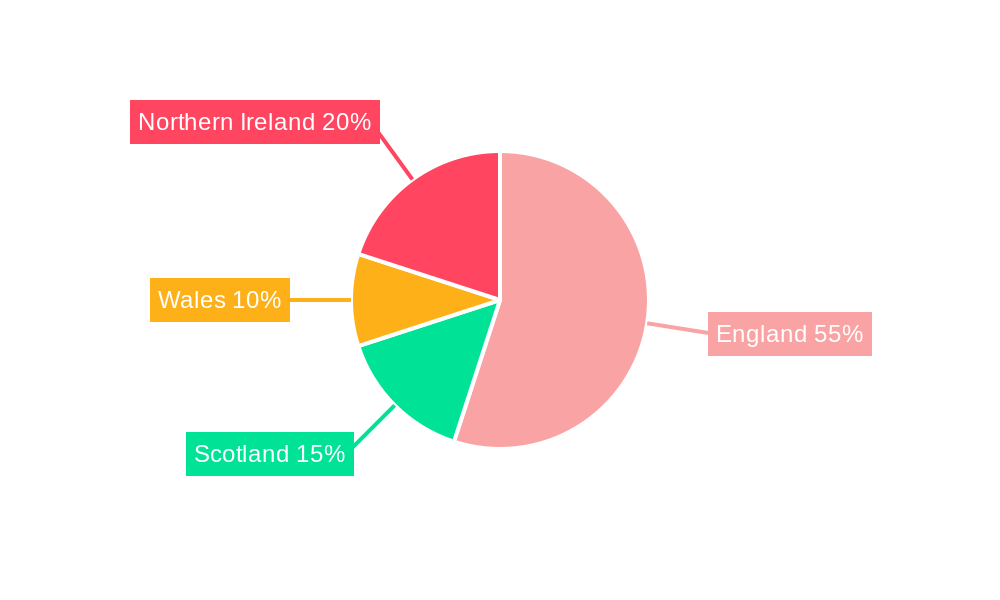
The market's segmentation by product highlights the dominance of home furniture, home textiles, and home appliances. These categories benefit from the aforementioned trends and demonstrate resilience across different economic scenarios. The "other products" segment, encompassing lighting, bathroom accessories, and tableware, represents a significant and growing niche, further diversifying the market. The distribution channel analysis indicates that while established brick-and-mortar retailers maintain a considerable share, the online segment's growth trajectory underscores the need for brands to adopt robust e-commerce strategies. Successful players will need to cater to the evolving consumer demands for sustainable, ethically sourced products, personalized experiences, and seamless omnichannel integration. Regional variations within the UK, particularly in spending habits and preferences across England, Wales, Scotland, and Northern Ireland, present both opportunities for targeted marketing and challenges for achieving pan-UK market penetration.
UK Homeware Industry Company Market Share
UK Homeware Industry Market Report: 2019-2033
This comprehensive report provides an in-depth analysis of the UK homeware industry, offering invaluable insights for industry professionals, investors, and strategic decision-makers. The study covers the period from 2019 to 2033, with a focus on the forecast period 2025-2033 and a base year of 2025. The report segments the market by product (Home Furniture, Home Textiles, Home Appliances, Floor Covering Products, Home Décor Products, Other Products) and distribution channel (Supermarket and Hypermarkets, Specialty Stores, Online Distribution Channels, Other Distribution Channels), offering granular market sizing and growth projections in million units. Key players such as Inter IKEA Group, Kitchen Craft, Bosch Group, and Dyson are analyzed for their market positioning and strategies.
UK Homeware Industry Market Dynamics & Structure
The UK homeware market is characterized by a mix of established players and emerging brands, resulting in a moderately fragmented landscape. Market concentration is influenced by the dominance of large multinational corporations in certain segments like home appliances (e.g., Bosch Group) and furniture (e.g., Inter IKEA Group), while niche players thrive in areas like home décor. Technological innovation, particularly in smart home appliances and sustainable materials, is a significant driver. Regulatory frameworks concerning product safety and environmental standards impact manufacturing and distribution. Strong competition exists between online and offline retailers, with online channels steadily gaining market share. The increasing adoption of e-commerce presents both opportunities and challenges for traditional brick-and-mortar stores. Consumer preference shifts towards sustainable and ethically sourced products are reshaping the market dynamics. M&A activity, as evidenced by Victoria PLC's acquisitions in 2022 (see Notable Milestones), shows consolidation trends within the industry, particularly in the flooring segment.
- Market Concentration: Moderately fragmented, with significant players in specific segments.
- Technological Innovation: Smart home technology, sustainable materials, and improved manufacturing processes are key drivers.
- Regulatory Framework: Stringent safety and environmental regulations influence operations.
- Competitive Product Substitutes: The availability of affordable alternatives exerts pressure on pricing.
- End-User Demographics: Changing household sizes and lifestyles impact demand for different products.
- M&A Trends: Consolidation is evident, particularly in the flooring sector. Deal volume (2019-2024): xx Million
UK Homeware Industry Growth Trends & Insights
The UK homeware market exhibited a steady growth trajectory during the historical period (2019-2024), experiencing a CAGR of xx%. This growth is fueled by several factors, including rising disposable incomes, increasing urbanization, and a growing preference for home improvement and renovation projects. The adoption rate of smart home appliances is increasing, while consumer behavior shifts toward online shopping and sustainable product choices have significantly impacted market dynamics. The market is expected to maintain a healthy growth rate during the forecast period (2025-2033), with a projected CAGR of xx%, driven by continued consumer spending, technological advancements, and innovative product offerings. Market penetration of certain product categories, like smart home technology, is still relatively low, indicating substantial growth potential. The COVID-19 pandemic accelerated the shift towards online shopping, permanently altering consumer behavior and creating new opportunities.
Dominant Regions, Countries, or Segments in UK Homeware Industry
The South East and London regions are the leading markets within the UK, driven by higher disposable incomes and a dense population. In terms of product segments, Home Furniture and Home Appliances represent the largest market shares, primarily due to higher price points and relatively inelastic demand. Online distribution channels are experiencing rapid growth, surpassing traditional retail channels in terms of CAGR (xx% vs xx%).
- Key Drivers: Higher disposable incomes in dominant regions, consumer spending on home improvement, strong online retail growth.
- Dominant Segments: Home Furniture (xx Million Units), Home Appliances (xx Million Units), Online Distribution Channels (xx Million Units).
- Market Share: Home Furniture (xx%), Home Appliances (xx%), Online Distribution Channels (xx%).
UK Homeware Industry Product Landscape
The UK homeware market offers a diverse range of products, reflecting changing consumer preferences and technological advancements. Smart home appliances integrating IoT capabilities are gaining traction, offering convenience and energy efficiency. Sustainable and ethically sourced products, using recycled or eco-friendly materials, are increasingly sought after. Product innovation focuses on improving durability, functionality, and aesthetics, aiming to enhance the overall customer experience. Unique selling propositions often include design-led features, smart technology integration, and emphasis on sustainability.
Key Drivers, Barriers & Challenges in UK Homeware Industry
Key Drivers: Rising disposable incomes, increasing homeownership rates, growing interest in home improvement, and technological advancements drive market expansion. Government initiatives promoting energy efficiency also positively impact the market.
Key Barriers and Challenges: Fluctuating economic conditions, supply chain disruptions (e.g., material shortages, transportation delays), and intense competition from both domestic and international players pose significant challenges. Changes in consumer preferences (e.g., towards minimalist designs) can also affect sales and profitability. The impact of Brexit on import/export costs and trade relationships is also a notable challenge.
Emerging Opportunities in UK Homeware Industry
The market presents several emerging opportunities, including the growth of the smart home sector, increasing demand for sustainable and eco-friendly products, and the expansion of online retail channels. Untapped markets within specific product categories and demographics present avenues for growth. Niche markets focusing on personalized products and bespoke design are also experiencing rising demand.
Growth Accelerators in the UK Homeware Industry
Technological breakthroughs in material science, manufacturing, and smart home technology will drive long-term growth. Strategic partnerships between retailers and technology companies will foster innovation and market expansion. Successful marketing and branding strategies that effectively reach target audiences are crucial for long-term growth and market share.
Key Players Shaping the UK Homeware Industry Market
- Inter IKEA Group
- Kitchen Craft
- Bosch Group
- Cuisinart
- Dyson
- Milliken
- Bed Bath and Beyond UK
- DFS Furniture PLC
- Koninklijke Philips NV
- Villeroy and Boch
- Victoria PLC
- Wayfair UK
- Gerflor
Notable Milestones in UK Homeware Industry Sector
- February 2022: Victoria PLC acquired B3 Ceramics Danismanlik (Graniser), expanding its flooring product portfolio and market reach.
- October 2022: Victoria PLC acquired International Wholesale Tile LLC (IWT), strengthening its presence in the North American market and diversifying its product range.
In-Depth UK Homeware Industry Market Outlook
The UK homeware market is poised for continued growth, driven by technological innovation, evolving consumer preferences, and the expansion of online retail. Strategic opportunities exist for companies that can adapt to changing market dynamics, offer innovative products, and effectively engage consumers through targeted marketing and branding. The focus on sustainability and the integration of smart technology will play a vital role in shaping the future of the industry.
UK Homeware Industry Segmentation
-
1. Product
- 1.1. Home Furniture
- 1.2. Home Textiles
- 1.3. Home Appliances
- 1.4. Floor Covering Products
- 1.5. Home Décor Products
- 1.6. Other Pr
-
2. Distribution Channel
- 2.1. Supermarket and Hypermarkets
- 2.2. Specialty Stores
- 2.3. Online Distribution Channels
- 2.4. Other Distribution Channels
UK Homeware Industry Segmentation By Geography
-
1. North America
- 1.1. United States
- 1.2. Canada
- 1.3. Mexico
-
2. South America
- 2.1. Brazil
- 2.2. Argentina
- 2.3. Rest of South America
-
3. Europe
- 3.1. United Kingdom
- 3.2. Germany
- 3.3. France
- 3.4. Italy
- 3.5. Spain
- 3.6. Russia
- 3.7. Benelux
- 3.8. Nordics
- 3.9. Rest of Europe
-
4. Middle East & Africa
- 4.1. Turkey
- 4.2. Israel
- 4.3. GCC
- 4.4. North Africa
- 4.5. South Africa
- 4.6. Rest of Middle East & Africa
-
5. Asia Pacific
- 5.1. China
- 5.2. India
- 5.3. Japan
- 5.4. South Korea
- 5.5. ASEAN
- 5.6. Oceania
- 5.7. Rest of Asia Pacific
UK Homeware Industry Regional Market Share
Geographic Coverage of UK Homeware Industry
UK Homeware Industry REPORT HIGHLIGHTS
| Aspects | Details |
|---|---|
| Study Period | 2020-2034 |
| Base Year | 2025 |
| Estimated Year | 2026 |
| Forecast Period | 2026-2034 |
| Historical Period | 2020-2025 |
| Growth Rate | CAGR of 4.17% from 2020-2034 |
| Segmentation |
|
Table of Contents
- 1. Introduction
- 1.1. Research Scope
- 1.2. Market Segmentation
- 1.3. Research Objective
- 1.4. Definitions and Assumptions
- 2. Executive Summary
- 2.1. Market Snapshot
- 3. Market Dynamics
- 3.1. Market Drivers
- 3.2. Market Restrains
- 3.3. Market Trends
- 3.4. Market Opportunities
- 4. Market Factor Analysis
- 4.1. Porters Five Forces
- 4.1.1. Bargaining Power of Suppliers
- 4.1.2. Bargaining Power of Buyers
- 4.1.3. Threat of New Entrants
- 4.1.4. Threat of Substitutes
- 4.1.5. Competitive Rivalry
- 4.2. PESTEL analysis
- 4.3. BCG Analysis
- 4.3.1. Stars (High Growth, High Market Share)
- 4.3.2. Cash Cows (Low Growth, High Market Share)
- 4.3.3. Question Mark (High Growth, Low Market Share)
- 4.3.4. Dogs (Low Growth, Low Market Share)
- 4.4. Ansoff Matrix Analysis
- 4.5. Supply Chain Analysis
- 4.6. Regulatory Landscape
- 4.7. Current Market Potential and Opportunity Assessment (TAM–SAM–SOM Framework)
- 4.8. NRP Analyst Note
- 4.1. Porters Five Forces
- 5. Market Analysis, Insights and Forecast 2021-2033
- 5.1. Market Analysis, Insights and Forecast - by Product
- 5.1.1. Home Furniture
- 5.1.2. Home Textiles
- 5.1.3. Home Appliances
- 5.1.4. Floor Covering Products
- 5.1.5. Home Décor Products
- 5.1.6. Other Pr
- 5.2. Market Analysis, Insights and Forecast - by Distribution Channel
- 5.2.1. Supermarket and Hypermarkets
- 5.2.2. Specialty Stores
- 5.2.3. Online Distribution Channels
- 5.2.4. Other Distribution Channels
- 5.3. Market Analysis, Insights and Forecast - by Region
- 5.3.1. North America
- 5.3.2. South America
- 5.3.3. Europe
- 5.3.4. Middle East & Africa
- 5.3.5. Asia Pacific
- 5.1. Market Analysis, Insights and Forecast - by Product
- 6. Global UK Homeware Industry Analysis, Insights and Forecast, 2021-2033
- 6.1. Market Analysis, Insights and Forecast - by Product
- 6.1.1. Home Furniture
- 6.1.2. Home Textiles
- 6.1.3. Home Appliances
- 6.1.4. Floor Covering Products
- 6.1.5. Home Décor Products
- 6.1.6. Other Pr
- 6.2. Market Analysis, Insights and Forecast - by Distribution Channel
- 6.2.1. Supermarket and Hypermarkets
- 6.2.2. Specialty Stores
- 6.2.3. Online Distribution Channels
- 6.2.4. Other Distribution Channels
- 6.1. Market Analysis, Insights and Forecast - by Product
- 7. North America UK Homeware Industry Analysis, Insights and Forecast, 2020-2032
- 7.1. Market Analysis, Insights and Forecast - by Product
- 7.1.1. Home Furniture
- 7.1.2. Home Textiles
- 7.1.3. Home Appliances
- 7.1.4. Floor Covering Products
- 7.1.5. Home Décor Products
- 7.1.6. Other Pr
- 7.2. Market Analysis, Insights and Forecast - by Distribution Channel
- 7.2.1. Supermarket and Hypermarkets
- 7.2.2. Specialty Stores
- 7.2.3. Online Distribution Channels
- 7.2.4. Other Distribution Channels
- 7.1. Market Analysis, Insights and Forecast - by Product
- 8. South America UK Homeware Industry Analysis, Insights and Forecast, 2020-2032
- 8.1. Market Analysis, Insights and Forecast - by Product
- 8.1.1. Home Furniture
- 8.1.2. Home Textiles
- 8.1.3. Home Appliances
- 8.1.4. Floor Covering Products
- 8.1.5. Home Décor Products
- 8.1.6. Other Pr
- 8.2. Market Analysis, Insights and Forecast - by Distribution Channel
- 8.2.1. Supermarket and Hypermarkets
- 8.2.2. Specialty Stores
- 8.2.3. Online Distribution Channels
- 8.2.4. Other Distribution Channels
- 8.1. Market Analysis, Insights and Forecast - by Product
- 9. Europe UK Homeware Industry Analysis, Insights and Forecast, 2020-2032
- 9.1. Market Analysis, Insights and Forecast - by Product
- 9.1.1. Home Furniture
- 9.1.2. Home Textiles
- 9.1.3. Home Appliances
- 9.1.4. Floor Covering Products
- 9.1.5. Home Décor Products
- 9.1.6. Other Pr
- 9.2. Market Analysis, Insights and Forecast - by Distribution Channel
- 9.2.1. Supermarket and Hypermarkets
- 9.2.2. Specialty Stores
- 9.2.3. Online Distribution Channels
- 9.2.4. Other Distribution Channels
- 9.1. Market Analysis, Insights and Forecast - by Product
- 10. Middle East & Africa UK Homeware Industry Analysis, Insights and Forecast, 2020-2032
- 10.1. Market Analysis, Insights and Forecast - by Product
- 10.1.1. Home Furniture
- 10.1.2. Home Textiles
- 10.1.3. Home Appliances
- 10.1.4. Floor Covering Products
- 10.1.5. Home Décor Products
- 10.1.6. Other Pr
- 10.2. Market Analysis, Insights and Forecast - by Distribution Channel
- 10.2.1. Supermarket and Hypermarkets
- 10.2.2. Specialty Stores
- 10.2.3. Online Distribution Channels
- 10.2.4. Other Distribution Channels
- 10.1. Market Analysis, Insights and Forecast - by Product
- 11. Asia Pacific UK Homeware Industry Analysis, Insights and Forecast, 2020-2032
- 11.1. Market Analysis, Insights and Forecast - by Product
- 11.1.1. Home Furniture
- 11.1.2. Home Textiles
- 11.1.3. Home Appliances
- 11.1.4. Floor Covering Products
- 11.1.5. Home Décor Products
- 11.1.6. Other Pr
- 11.2. Market Analysis, Insights and Forecast - by Distribution Channel
- 11.2.1. Supermarket and Hypermarkets
- 11.2.2. Specialty Stores
- 11.2.3. Online Distribution Channels
- 11.2.4. Other Distribution Channels
- 11.1. Market Analysis, Insights and Forecast - by Product
- 12. Competitive Analysis
- 12.1. Company Profiles
- 12.1.1 Inter IKEA Group
- 12.1.1.1. Company Overview
- 12.1.1.2. Products
- 12.1.1.3. Company Financials
- 12.1.1.4. SWOT Analysis
- 12.1.2 Kitchen Craft
- 12.1.2.1. Company Overview
- 12.1.2.2. Products
- 12.1.2.3. Company Financials
- 12.1.2.4. SWOT Analysis
- 12.1.3 Bosch Group
- 12.1.3.1. Company Overview
- 12.1.3.2. Products
- 12.1.3.3. Company Financials
- 12.1.3.4. SWOT Analysis
- 12.1.4 Cuisinart
- 12.1.4.1. Company Overview
- 12.1.4.2. Products
- 12.1.4.3. Company Financials
- 12.1.4.4. SWOT Analysis
- 12.1.5 Dyson
- 12.1.5.1. Company Overview
- 12.1.5.2. Products
- 12.1.5.3. Company Financials
- 12.1.5.4. SWOT Analysis
- 12.1.6 Milliken
- 12.1.6.1. Company Overview
- 12.1.6.2. Products
- 12.1.6.3. Company Financials
- 12.1.6.4. SWOT Analysis
- 12.1.7 Bed Bath and Beyond UK
- 12.1.7.1. Company Overview
- 12.1.7.2. Products
- 12.1.7.3. Company Financials
- 12.1.7.4. SWOT Analysis
- 12.1.8 DFS Furniture PLC
- 12.1.8.1. Company Overview
- 12.1.8.2. Products
- 12.1.8.3. Company Financials
- 12.1.8.4. SWOT Analysis
- 12.1.9 Koninklijke Philips NV
- 12.1.9.1. Company Overview
- 12.1.9.2. Products
- 12.1.9.3. Company Financials
- 12.1.9.4. SWOT Analysis
- 12.1.10 Villeroy and Boch
- 12.1.10.1. Company Overview
- 12.1.10.2. Products
- 12.1.10.3. Company Financials
- 12.1.10.4. SWOT Analysis
- 12.1.11 Victoria PLC
- 12.1.11.1. Company Overview
- 12.1.11.2. Products
- 12.1.11.3. Company Financials
- 12.1.11.4. SWOT Analysis
- 12.1.12 Way Fair UK
- 12.1.12.1. Company Overview
- 12.1.12.2. Products
- 12.1.12.3. Company Financials
- 12.1.12.4. SWOT Analysis
- 12.1.13 Victoria PLC
- 12.1.13.1. Company Overview
- 12.1.13.2. Products
- 12.1.13.3. Company Financials
- 12.1.13.4. SWOT Analysis
- 12.1.14 Gerflor
- 12.1.14.1. Company Overview
- 12.1.14.2. Products
- 12.1.14.3. Company Financials
- 12.1.14.4. SWOT Analysis
- 12.1.1 Inter IKEA Group
- 12.2. Market Entropy
- 12.2.1 Company's Key Areas Served
- 12.2.2 Recent Developments
- 12.3. Company Market Share Analysis 2025
- 12.3.1 Top 5 Companies Market Share Analysis
- 12.3.2 Top 3 Companies Market Share Analysis
- 12.4. List of Potential Customers
- 13. Research Methodology
List of Figures
- Figure 1: Global UK Homeware Industry Revenue Breakdown (Million, %) by Region 2025 & 2033
- Figure 2: Global UK Homeware Industry Volume Breakdown (K Unit, %) by Region 2025 & 2033
- Figure 3: North America UK Homeware Industry Revenue (Million), by Product 2025 & 2033
- Figure 4: North America UK Homeware Industry Volume (K Unit), by Product 2025 & 2033
- Figure 5: North America UK Homeware Industry Revenue Share (%), by Product 2025 & 2033
- Figure 6: North America UK Homeware Industry Volume Share (%), by Product 2025 & 2033
- Figure 7: North America UK Homeware Industry Revenue (Million), by Distribution Channel 2025 & 2033
- Figure 8: North America UK Homeware Industry Volume (K Unit), by Distribution Channel 2025 & 2033
- Figure 9: North America UK Homeware Industry Revenue Share (%), by Distribution Channel 2025 & 2033
- Figure 10: North America UK Homeware Industry Volume Share (%), by Distribution Channel 2025 & 2033
- Figure 11: North America UK Homeware Industry Revenue (Million), by Country 2025 & 2033
- Figure 12: North America UK Homeware Industry Volume (K Unit), by Country 2025 & 2033
- Figure 13: North America UK Homeware Industry Revenue Share (%), by Country 2025 & 2033
- Figure 14: North America UK Homeware Industry Volume Share (%), by Country 2025 & 2033
- Figure 15: South America UK Homeware Industry Revenue (Million), by Product 2025 & 2033
- Figure 16: South America UK Homeware Industry Volume (K Unit), by Product 2025 & 2033
- Figure 17: South America UK Homeware Industry Revenue Share (%), by Product 2025 & 2033
- Figure 18: South America UK Homeware Industry Volume Share (%), by Product 2025 & 2033
- Figure 19: South America UK Homeware Industry Revenue (Million), by Distribution Channel 2025 & 2033
- Figure 20: South America UK Homeware Industry Volume (K Unit), by Distribution Channel 2025 & 2033
- Figure 21: South America UK Homeware Industry Revenue Share (%), by Distribution Channel 2025 & 2033
- Figure 22: South America UK Homeware Industry Volume Share (%), by Distribution Channel 2025 & 2033
- Figure 23: South America UK Homeware Industry Revenue (Million), by Country 2025 & 2033
- Figure 24: South America UK Homeware Industry Volume (K Unit), by Country 2025 & 2033
- Figure 25: South America UK Homeware Industry Revenue Share (%), by Country 2025 & 2033
- Figure 26: South America UK Homeware Industry Volume Share (%), by Country 2025 & 2033
- Figure 27: Europe UK Homeware Industry Revenue (Million), by Product 2025 & 2033
- Figure 28: Europe UK Homeware Industry Volume (K Unit), by Product 2025 & 2033
- Figure 29: Europe UK Homeware Industry Revenue Share (%), by Product 2025 & 2033
- Figure 30: Europe UK Homeware Industry Volume Share (%), by Product 2025 & 2033
- Figure 31: Europe UK Homeware Industry Revenue (Million), by Distribution Channel 2025 & 2033
- Figure 32: Europe UK Homeware Industry Volume (K Unit), by Distribution Channel 2025 & 2033
- Figure 33: Europe UK Homeware Industry Revenue Share (%), by Distribution Channel 2025 & 2033
- Figure 34: Europe UK Homeware Industry Volume Share (%), by Distribution Channel 2025 & 2033
- Figure 35: Europe UK Homeware Industry Revenue (Million), by Country 2025 & 2033
- Figure 36: Europe UK Homeware Industry Volume (K Unit), by Country 2025 & 2033
- Figure 37: Europe UK Homeware Industry Revenue Share (%), by Country 2025 & 2033
- Figure 38: Europe UK Homeware Industry Volume Share (%), by Country 2025 & 2033
- Figure 39: Middle East & Africa UK Homeware Industry Revenue (Million), by Product 2025 & 2033
- Figure 40: Middle East & Africa UK Homeware Industry Volume (K Unit), by Product 2025 & 2033
- Figure 41: Middle East & Africa UK Homeware Industry Revenue Share (%), by Product 2025 & 2033
- Figure 42: Middle East & Africa UK Homeware Industry Volume Share (%), by Product 2025 & 2033
- Figure 43: Middle East & Africa UK Homeware Industry Revenue (Million), by Distribution Channel 2025 & 2033
- Figure 44: Middle East & Africa UK Homeware Industry Volume (K Unit), by Distribution Channel 2025 & 2033
- Figure 45: Middle East & Africa UK Homeware Industry Revenue Share (%), by Distribution Channel 2025 & 2033
- Figure 46: Middle East & Africa UK Homeware Industry Volume Share (%), by Distribution Channel 2025 & 2033
- Figure 47: Middle East & Africa UK Homeware Industry Revenue (Million), by Country 2025 & 2033
- Figure 48: Middle East & Africa UK Homeware Industry Volume (K Unit), by Country 2025 & 2033
- Figure 49: Middle East & Africa UK Homeware Industry Revenue Share (%), by Country 2025 & 2033
- Figure 50: Middle East & Africa UK Homeware Industry Volume Share (%), by Country 2025 & 2033
- Figure 51: Asia Pacific UK Homeware Industry Revenue (Million), by Product 2025 & 2033
- Figure 52: Asia Pacific UK Homeware Industry Volume (K Unit), by Product 2025 & 2033
- Figure 53: Asia Pacific UK Homeware Industry Revenue Share (%), by Product 2025 & 2033
- Figure 54: Asia Pacific UK Homeware Industry Volume Share (%), by Product 2025 & 2033
- Figure 55: Asia Pacific UK Homeware Industry Revenue (Million), by Distribution Channel 2025 & 2033
- Figure 56: Asia Pacific UK Homeware Industry Volume (K Unit), by Distribution Channel 2025 & 2033
- Figure 57: Asia Pacific UK Homeware Industry Revenue Share (%), by Distribution Channel 2025 & 2033
- Figure 58: Asia Pacific UK Homeware Industry Volume Share (%), by Distribution Channel 2025 & 2033
- Figure 59: Asia Pacific UK Homeware Industry Revenue (Million), by Country 2025 & 2033
- Figure 60: Asia Pacific UK Homeware Industry Volume (K Unit), by Country 2025 & 2033
- Figure 61: Asia Pacific UK Homeware Industry Revenue Share (%), by Country 2025 & 2033
- Figure 62: Asia Pacific UK Homeware Industry Volume Share (%), by Country 2025 & 2033
List of Tables
- Table 1: Global UK Homeware Industry Revenue Million Forecast, by Product 2020 & 2033
- Table 2: Global UK Homeware Industry Volume K Unit Forecast, by Product 2020 & 2033
- Table 3: Global UK Homeware Industry Revenue Million Forecast, by Distribution Channel 2020 & 2033
- Table 4: Global UK Homeware Industry Volume K Unit Forecast, by Distribution Channel 2020 & 2033
- Table 5: Global UK Homeware Industry Revenue Million Forecast, by Region 2020 & 2033
- Table 6: Global UK Homeware Industry Volume K Unit Forecast, by Region 2020 & 2033
- Table 7: Global UK Homeware Industry Revenue Million Forecast, by Product 2020 & 2033
- Table 8: Global UK Homeware Industry Volume K Unit Forecast, by Product 2020 & 2033
- Table 9: Global UK Homeware Industry Revenue Million Forecast, by Distribution Channel 2020 & 2033
- Table 10: Global UK Homeware Industry Volume K Unit Forecast, by Distribution Channel 2020 & 2033
- Table 11: Global UK Homeware Industry Revenue Million Forecast, by Country 2020 & 2033
- Table 12: Global UK Homeware Industry Volume K Unit Forecast, by Country 2020 & 2033
- Table 13: United States UK Homeware Industry Revenue (Million) Forecast, by Application 2020 & 2033
- Table 14: United States UK Homeware Industry Volume (K Unit) Forecast, by Application 2020 & 2033
- Table 15: Canada UK Homeware Industry Revenue (Million) Forecast, by Application 2020 & 2033
- Table 16: Canada UK Homeware Industry Volume (K Unit) Forecast, by Application 2020 & 2033
- Table 17: Mexico UK Homeware Industry Revenue (Million) Forecast, by Application 2020 & 2033
- Table 18: Mexico UK Homeware Industry Volume (K Unit) Forecast, by Application 2020 & 2033
- Table 19: Global UK Homeware Industry Revenue Million Forecast, by Product 2020 & 2033
- Table 20: Global UK Homeware Industry Volume K Unit Forecast, by Product 2020 & 2033
- Table 21: Global UK Homeware Industry Revenue Million Forecast, by Distribution Channel 2020 & 2033
- Table 22: Global UK Homeware Industry Volume K Unit Forecast, by Distribution Channel 2020 & 2033
- Table 23: Global UK Homeware Industry Revenue Million Forecast, by Country 2020 & 2033
- Table 24: Global UK Homeware Industry Volume K Unit Forecast, by Country 2020 & 2033
- Table 25: Brazil UK Homeware Industry Revenue (Million) Forecast, by Application 2020 & 2033
- Table 26: Brazil UK Homeware Industry Volume (K Unit) Forecast, by Application 2020 & 2033
- Table 27: Argentina UK Homeware Industry Revenue (Million) Forecast, by Application 2020 & 2033
- Table 28: Argentina UK Homeware Industry Volume (K Unit) Forecast, by Application 2020 & 2033
- Table 29: Rest of South America UK Homeware Industry Revenue (Million) Forecast, by Application 2020 & 2033
- Table 30: Rest of South America UK Homeware Industry Volume (K Unit) Forecast, by Application 2020 & 2033
- Table 31: Global UK Homeware Industry Revenue Million Forecast, by Product 2020 & 2033
- Table 32: Global UK Homeware Industry Volume K Unit Forecast, by Product 2020 & 2033
- Table 33: Global UK Homeware Industry Revenue Million Forecast, by Distribution Channel 2020 & 2033
- Table 34: Global UK Homeware Industry Volume K Unit Forecast, by Distribution Channel 2020 & 2033
- Table 35: Global UK Homeware Industry Revenue Million Forecast, by Country 2020 & 2033
- Table 36: Global UK Homeware Industry Volume K Unit Forecast, by Country 2020 & 2033
- Table 37: United Kingdom UK Homeware Industry Revenue (Million) Forecast, by Application 2020 & 2033
- Table 38: United Kingdom UK Homeware Industry Volume (K Unit) Forecast, by Application 2020 & 2033
- Table 39: Germany UK Homeware Industry Revenue (Million) Forecast, by Application 2020 & 2033
- Table 40: Germany UK Homeware Industry Volume (K Unit) Forecast, by Application 2020 & 2033
- Table 41: France UK Homeware Industry Revenue (Million) Forecast, by Application 2020 & 2033
- Table 42: France UK Homeware Industry Volume (K Unit) Forecast, by Application 2020 & 2033
- Table 43: Italy UK Homeware Industry Revenue (Million) Forecast, by Application 2020 & 2033
- Table 44: Italy UK Homeware Industry Volume (K Unit) Forecast, by Application 2020 & 2033
- Table 45: Spain UK Homeware Industry Revenue (Million) Forecast, by Application 2020 & 2033
- Table 46: Spain UK Homeware Industry Volume (K Unit) Forecast, by Application 2020 & 2033
- Table 47: Russia UK Homeware Industry Revenue (Million) Forecast, by Application 2020 & 2033
- Table 48: Russia UK Homeware Industry Volume (K Unit) Forecast, by Application 2020 & 2033
- Table 49: Benelux UK Homeware Industry Revenue (Million) Forecast, by Application 2020 & 2033
- Table 50: Benelux UK Homeware Industry Volume (K Unit) Forecast, by Application 2020 & 2033
- Table 51: Nordics UK Homeware Industry Revenue (Million) Forecast, by Application 2020 & 2033
- Table 52: Nordics UK Homeware Industry Volume (K Unit) Forecast, by Application 2020 & 2033
- Table 53: Rest of Europe UK Homeware Industry Revenue (Million) Forecast, by Application 2020 & 2033
- Table 54: Rest of Europe UK Homeware Industry Volume (K Unit) Forecast, by Application 2020 & 2033
- Table 55: Global UK Homeware Industry Revenue Million Forecast, by Product 2020 & 2033
- Table 56: Global UK Homeware Industry Volume K Unit Forecast, by Product 2020 & 2033
- Table 57: Global UK Homeware Industry Revenue Million Forecast, by Distribution Channel 2020 & 2033
- Table 58: Global UK Homeware Industry Volume K Unit Forecast, by Distribution Channel 2020 & 2033
- Table 59: Global UK Homeware Industry Revenue Million Forecast, by Country 2020 & 2033
- Table 60: Global UK Homeware Industry Volume K Unit Forecast, by Country 2020 & 2033
- Table 61: Turkey UK Homeware Industry Revenue (Million) Forecast, by Application 2020 & 2033
- Table 62: Turkey UK Homeware Industry Volume (K Unit) Forecast, by Application 2020 & 2033
- Table 63: Israel UK Homeware Industry Revenue (Million) Forecast, by Application 2020 & 2033
- Table 64: Israel UK Homeware Industry Volume (K Unit) Forecast, by Application 2020 & 2033
- Table 65: GCC UK Homeware Industry Revenue (Million) Forecast, by Application 2020 & 2033
- Table 66: GCC UK Homeware Industry Volume (K Unit) Forecast, by Application 2020 & 2033
- Table 67: North Africa UK Homeware Industry Revenue (Million) Forecast, by Application 2020 & 2033
- Table 68: North Africa UK Homeware Industry Volume (K Unit) Forecast, by Application 2020 & 2033
- Table 69: South Africa UK Homeware Industry Revenue (Million) Forecast, by Application 2020 & 2033
- Table 70: South Africa UK Homeware Industry Volume (K Unit) Forecast, by Application 2020 & 2033
- Table 71: Rest of Middle East & Africa UK Homeware Industry Revenue (Million) Forecast, by Application 2020 & 2033
- Table 72: Rest of Middle East & Africa UK Homeware Industry Volume (K Unit) Forecast, by Application 2020 & 2033
- Table 73: Global UK Homeware Industry Revenue Million Forecast, by Product 2020 & 2033
- Table 74: Global UK Homeware Industry Volume K Unit Forecast, by Product 2020 & 2033
- Table 75: Global UK Homeware Industry Revenue Million Forecast, by Distribution Channel 2020 & 2033
- Table 76: Global UK Homeware Industry Volume K Unit Forecast, by Distribution Channel 2020 & 2033
- Table 77: Global UK Homeware Industry Revenue Million Forecast, by Country 2020 & 2033
- Table 78: Global UK Homeware Industry Volume K Unit Forecast, by Country 2020 & 2033
- Table 79: China UK Homeware Industry Revenue (Million) Forecast, by Application 2020 & 2033
- Table 80: China UK Homeware Industry Volume (K Unit) Forecast, by Application 2020 & 2033
- Table 81: India UK Homeware Industry Revenue (Million) Forecast, by Application 2020 & 2033
- Table 82: India UK Homeware Industry Volume (K Unit) Forecast, by Application 2020 & 2033
- Table 83: Japan UK Homeware Industry Revenue (Million) Forecast, by Application 2020 & 2033
- Table 84: Japan UK Homeware Industry Volume (K Unit) Forecast, by Application 2020 & 2033
- Table 85: South Korea UK Homeware Industry Revenue (Million) Forecast, by Application 2020 & 2033
- Table 86: South Korea UK Homeware Industry Volume (K Unit) Forecast, by Application 2020 & 2033
- Table 87: ASEAN UK Homeware Industry Revenue (Million) Forecast, by Application 2020 & 2033
- Table 88: ASEAN UK Homeware Industry Volume (K Unit) Forecast, by Application 2020 & 2033
- Table 89: Oceania UK Homeware Industry Revenue (Million) Forecast, by Application 2020 & 2033
- Table 90: Oceania UK Homeware Industry Volume (K Unit) Forecast, by Application 2020 & 2033
- Table 91: Rest of Asia Pacific UK Homeware Industry Revenue (Million) Forecast, by Application 2020 & 2033
- Table 92: Rest of Asia Pacific UK Homeware Industry Volume (K Unit) Forecast, by Application 2020 & 2033
Frequently Asked Questions
1. What is the projected Compound Annual Growth Rate (CAGR) of the UK Homeware Industry?
The projected CAGR is approximately 4.17%.
2. Which companies are prominent players in the UK Homeware Industry?
Key companies in the market include Inter IKEA Group, Kitchen Craft, Bosch Group, Cuisinart, Dyson, Milliken, Bed Bath and Beyond UK, DFS Furniture PLC, Koninklijke Philips NV, Villeroy and Boch, Victoria PLC, Way Fair UK, Victoria PLC, Gerflor.
3. What are the main segments of the UK Homeware Industry?
The market segments include Product, Distribution Channel.
4. Can you provide details about the market size?
The market size is estimated to be USD 21.20 Million as of 2022.
5. What are some drivers contributing to market growth?
Increase in Restaurants and Food Chains globally; Rise in the share of people opting for vegan and vegetarian foods.
6. What are the notable trends driving market growth?
Increased Spending on Furniture and Appliances is Driving the Market's Growth.
7. Are there any restraints impacting market growth?
Rise in price of electric appliances globally; Rising inflation decreasing the purchasing power.
8. Can you provide examples of recent developments in the market?
October 2022: Victoria PLC, the United Kingdom-based flooring designer, manufacturer, and distributor, announced the acquisition of Florida-based International Wholesale Tile LLC (IWT).
9. What pricing options are available for accessing the report?
Pricing options include single-user, multi-user, and enterprise licenses priced at USD 3800, USD 4500, and USD 5800 respectively.
10. Is the market size provided in terms of value or volume?
The market size is provided in terms of value, measured in Million and volume, measured in K Unit.
11. Are there any specific market keywords associated with the report?
Yes, the market keyword associated with the report is "UK Homeware Industry," which aids in identifying and referencing the specific market segment covered.
12. How do I determine which pricing option suits my needs best?
The pricing options vary based on user requirements and access needs. Individual users may opt for single-user licenses, while businesses requiring broader access may choose multi-user or enterprise licenses for cost-effective access to the report.
13. Are there any additional resources or data provided in the UK Homeware Industry report?
While the report offers comprehensive insights, it's advisable to review the specific contents or supplementary materials provided to ascertain if additional resources or data are available.
14. How can I stay updated on further developments or reports in the UK Homeware Industry?
To stay informed about further developments, trends, and reports in the UK Homeware Industry, consider subscribing to industry newsletters, following relevant companies and organizations, or regularly checking reputable industry news sources and publications.
Methodology
Step 1 - Identification of Relevant Samples Size from Population Database


Step 2 - Approaches for Defining Global Market Size (Value, Volume* & Price*)

Note*: In applicable scenarios
Step 3 - Data Sources
Primary Research
- Web Analytics
- Survey Reports
- Research Institute
- Latest Research Reports
- Opinion Leaders
Secondary Research
- Annual Reports
- White Paper
- Latest Press Release
- Industry Association
- Paid Database
- Investor Presentations

Step 4 - Data Triangulation
Involves using different sources of information in order to increase the validity of a study
These sources are likely to be stakeholders in a program - participants, other researchers, program staff, other community members, and so on.
Then we put all data in single framework & apply various statistical tools to find out the dynamic on the market.
During the analysis stage, feedback from the stakeholder groups would be compared to determine areas of agreement as well as areas of divergence