

Key Insights
The UK offshore oil and gas decommissioning market is projected for significant expansion. This growth is primarily driven by aging infrastructure in existing fields and stringent regulatory mandates for responsible asset dismantling. The market, encompassing well plugging and abandonment (P&A) and pipeline decommissioning, is largely funded by the oil and gas sector. Based on a CAGR of 6.5% and typical project expenditures, the market size is estimated at £11.1 billion for the base year 2025. This projection is supported by the involvement of key industry players, indicating a substantial and competitive landscape. The forecast period, 2025-2033, anticipates continued growth due to a considerable backlog of projects and evolving regulatory frameworks. Regional variations in decommissioning activity across England, Wales, Scotland, and Northern Ireland will depend on the geographical distribution of offshore assets.
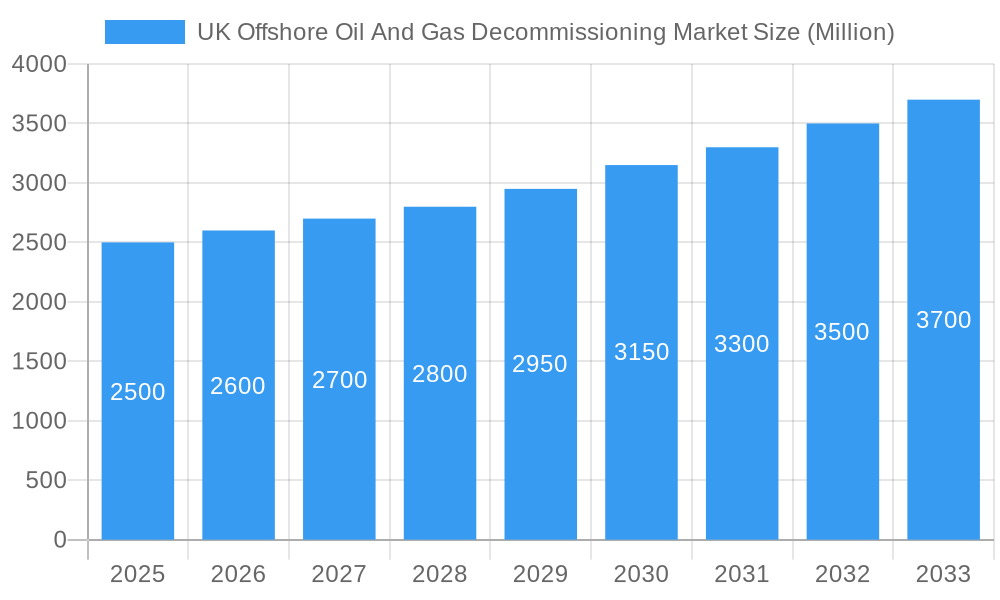
UK Offshore Oil And Gas Decommissioning Market Market Size (In Billion)
Key trends shaping market expansion include a heightened emphasis on environmental sustainability and the adoption of innovative, eco-friendly decommissioning technologies. While fluctuating oil and gas prices may influence project timelines, regulatory requirements for timely decommissioning are expected to mitigate significant delays. The competitive environment features both multinational corporations and specialized service providers, fostering a dynamic market characterized by economies of scale and specialized expertise, ensuring continued market activity and growth potential.
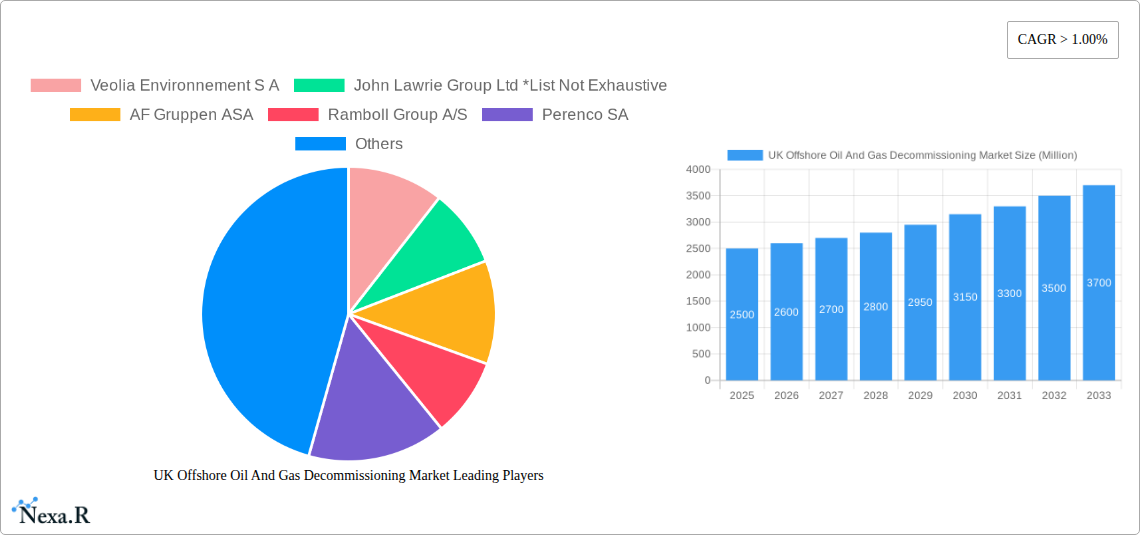
UK Offshore Oil And Gas Decommissioning Market Company Market Share
UK Offshore Oil and Gas Decommissioning Market Report: 2019-2033
This comprehensive report provides an in-depth analysis of the UK offshore oil and gas decommissioning market, encompassing market dynamics, growth trends, dominant segments, key players, and future outlook. With a study period spanning 2019-2033, a base year of 2025, and a forecast period of 2025-2033, this report is an essential resource for industry professionals, investors, and policymakers. The report analyzes the parent market (UK Energy Sector) and its child market (Offshore Oil & Gas Decommissioning), offering granular insights into market size (in millions), growth drivers, and challenges.
UK Offshore Oil And Gas Decommissioning Market Dynamics & Structure
The UK offshore oil and gas decommissioning market is characterized by a moderately concentrated landscape with several large players and numerous smaller specialized companies competing for projects. Market concentration is influenced by factors like project size and specialized expertise required for various decommissioning activities, such as Plugging and Abandonment (P&A) and pipeline decommissioning. Technological innovation plays a critical role, driving efficiency and reducing environmental impact. Stringent regulatory frameworks, including those set by the Oil and Gas Authority (OGA), heavily influence operational practices and investment decisions. While direct substitutes are limited, the industry faces pressure from alternative energy sources. The end-user demographics consist primarily of oil and gas companies operating in the North Sea. M&A activity remains significant, with larger companies acquiring smaller, specialized firms to expand their service portfolios and geographical reach.
- Market Concentration: Moderately concentrated, with a few major players holding significant market share (estimated at xx%).
- Technological Innovation: Significant driver, focused on reducing costs, improving safety, and minimizing environmental impact. Key innovations include remotely operated vehicles (ROVs) and advanced well plugging techniques.
- Regulatory Framework: Stringent regulations set by OGA and other bodies impacting operational procedures and cost estimates.
- Competitive Product Substitutes: Limited, with the primary focus on optimizing existing decommissioning technologies.
- End-User Demographics: Primarily Oil and Gas Companies operating in the UK North Sea.
- M&A Trends: Ongoing consolidation, with larger companies acquiring smaller specialized firms to broaden service offerings (approx. xx deals in the past 5 years).
UK Offshore Oil And Gas Decommissioning Market Growth Trends & Insights
The UK offshore oil and gas decommissioning market experienced significant growth during the historical period (2019-2024), driven primarily by the aging infrastructure and increasing regulatory pressure for responsible decommissioning. Market size is projected to grow at a Compound Annual Growth Rate (CAGR) of xx% during the forecast period (2025-2033), reaching an estimated value of £xx million by 2033. This growth is fueled by the increasing number of aging offshore oil and gas assets requiring decommissioning, alongside technological advancements and the strengthening regulatory environment. The adoption rate of advanced decommissioning technologies is steadily increasing, driven by the need to reduce costs and environmental footprint.
Dominant Regions, Countries, or Segments in UK Offshore Oil And Gas Decommissioning Market
The North Sea region, particularly the UK continental shelf, dominates the UK offshore oil and gas decommissioning market. This dominance is attributed to the high concentration of aging oil and gas infrastructure within this area. The Plugging and Abandonment (P&A) segment holds the largest market share, followed by pipeline decommissioning. The Oil Industry represents the larger end-user segment.
- Key Drivers:
- High concentration of aging offshore assets in the North Sea.
- Stringent regulatory requirements for environmental protection.
- Increasing costs associated with asset maintenance.
- Dominance Factors:
- Geographic concentration of oil and gas infrastructure.
- Higher project value due to the complexity of North Sea operations.
- Significant government investment in decommissioning activities.
UK Offshore Oil And Gas Decommissioning Market Product Landscape
The market offers a range of specialized services and technologies, including well plugging and abandonment, pipeline removal, platform dismantling, and waste management solutions. Product innovation focuses on enhancing efficiency, safety, and environmental sustainability. Key advancements include the use of robotics, advanced drilling techniques, and improved waste management processes. Unique selling propositions often involve expertise in complex decommissioning scenarios, specialized equipment, and environmentally friendly solutions.
Key Drivers, Barriers & Challenges in UK Offshore Oil And Gas Decommissioning Market
Key Drivers: The primary drivers include the increasing number of aging offshore assets requiring decommissioning, stringent regulatory requirements for environmental protection, and government initiatives supporting the industry. The large scale of decommissioning projects in the North Sea presents significant opportunities.
Key Challenges & Restraints: The high cost associated with decommissioning activities, complex logistical challenges posed by offshore operations, and potential supply chain constraints remain key barriers. Regulatory uncertainty and delays can also impact project timelines and budgets.
Emerging Opportunities in UK Offshore Oil And Gas Decommissioning Market
Emerging opportunities include the development and implementation of innovative decommissioning technologies, the expansion of services into new geographic areas, and the growing demand for specialized decommissioning expertise. The increasing focus on environmental sustainability offers further opportunities for companies offering eco-friendly solutions.
Growth Accelerators in the UK Offshore Oil And Gas Decommissioning Market Industry
Long-term growth will be accelerated by continued technological advancements, strategic partnerships between service providers and operators, and the establishment of a robust supply chain. Increased investment in research and development to enhance efficiency, safety, and environmental performance will also contribute to market expansion.
Key Players Shaping the UK Offshore Oil And Gas Decommissioning Market Market
- Veolia Environnement S A
- John Lawrie Group Ltd
- AF Gruppen ASA
- Ramboll Group A/S
- Perenco SA
- Derrick Services (UK) Ltd
Notable Milestones in UK Offshore Oil And Gas Decommissioning Market Sector
- November 2022: Offshore Energies UK (OEUK) reports over 2,000 abandoned wells in the North Sea, signaling a significant increase in upcoming decommissioning activity valued at EUR 20 billion.
- September 2022: The Nuclear Decommissioning Authority (NDA) and National Decommissioning Centre (NDC) sign a three-year collaborative research agreement, fostering innovation in the decommissioning sector.
In-Depth UK Offshore Oil And Gas Decommissioning Market Market Outlook
The UK offshore oil and gas decommissioning market presents significant long-term growth potential, driven by the continued need to decommission aging infrastructure and strengthen environmental regulations. Strategic partnerships, technological innovation, and a proactive regulatory environment will further shape the market's trajectory, creating opportunities for companies that can deliver efficient, safe, and sustainable decommissioning solutions. The market is projected to experience robust growth, with considerable value creation in the coming years.
UK Offshore Oil And Gas Decommissioning Market Segmentation
- 1. Shallow Water
- 2. Deepwater and Ultra-Deep Water
UK Offshore Oil And Gas Decommissioning Market Segmentation By Geography
-
1. North America
- 1.1. United States
- 1.2. Canada
- 1.3. Mexico
-
2. South America
- 2.1. Brazil
- 2.2. Argentina
- 2.3. Rest of South America
-
3. Europe
- 3.1. United Kingdom
- 3.2. Germany
- 3.3. France
- 3.4. Italy
- 3.5. Spain
- 3.6. Russia
- 3.7. Benelux
- 3.8. Nordics
- 3.9. Rest of Europe
-
4. Middle East & Africa
- 4.1. Turkey
- 4.2. Israel
- 4.3. GCC
- 4.4. North Africa
- 4.5. South Africa
- 4.6. Rest of Middle East & Africa
-
5. Asia Pacific
- 5.1. China
- 5.2. India
- 5.3. Japan
- 5.4. South Korea
- 5.5. ASEAN
- 5.6. Oceania
- 5.7. Rest of Asia Pacific
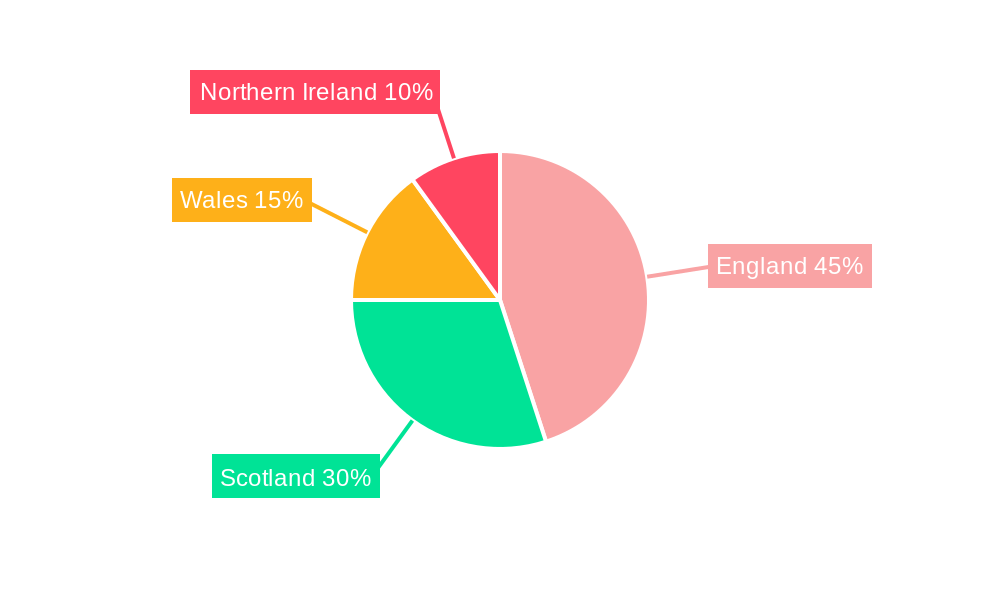
UK Offshore Oil And Gas Decommissioning Market Regional Market Share
Geographic Coverage of UK Offshore Oil And Gas Decommissioning Market
UK Offshore Oil And Gas Decommissioning Market REPORT HIGHLIGHTS
| Aspects | Details |
|---|---|
| Study Period | 2020-2034 |
| Base Year | 2025 |
| Estimated Year | 2026 |
| Forecast Period | 2026-2034 |
| Historical Period | 2020-2025 |
| Growth Rate | CAGR of 6.5% from 2020-2034 |
| Segmentation |
|
Table of Contents
- 1. Introduction
- 1.1. Research Scope
- 1.2. Market Segmentation
- 1.3. Research Objective
- 1.4. Definitions and Assumptions
- 2. Executive Summary
- 2.1. Market Snapshot
- 3. Market Dynamics
- 3.1. Market Drivers
- 3.2. Market Restrains
- 3.3. Market Trends
- 3.4. Market Opportunities
- 4. Market Factor Analysis
- 4.1. Porters Five Forces
- 4.1.1. Bargaining Power of Suppliers
- 4.1.2. Bargaining Power of Buyers
- 4.1.3. Threat of New Entrants
- 4.1.4. Threat of Substitutes
- 4.1.5. Competitive Rivalry
- 4.2. PESTEL analysis
- 4.3. BCG Analysis
- 4.3.1. Stars (High Growth, High Market Share)
- 4.3.2. Cash Cows (Low Growth, High Market Share)
- 4.3.3. Question Mark (High Growth, Low Market Share)
- 4.3.4. Dogs (Low Growth, Low Market Share)
- 4.4. Ansoff Matrix Analysis
- 4.5. Supply Chain Analysis
- 4.6. Regulatory Landscape
- 4.7. Current Market Potential and Opportunity Assessment (TAM–SAM–SOM Framework)
- 4.8. NRP Analyst Note
- 4.1. Porters Five Forces
- 5. Market Analysis, Insights and Forecast 2021-2033
- 5.1. Market Analysis, Insights and Forecast - by Shallow Water
- 5.2. Market Analysis, Insights and Forecast - by Deepwater and Ultra-Deep Water
- 5.3. Market Analysis, Insights and Forecast - by Region
- 5.3.1. North America
- 5.3.2. South America
- 5.3.3. Europe
- 5.3.4. Middle East & Africa
- 5.3.5. Asia Pacific
- 6. Global UK Offshore Oil And Gas Decommissioning Market Analysis, Insights and Forecast, 2021-2033
- 6.1. Market Analysis, Insights and Forecast - by Shallow Water
- 6.2. Market Analysis, Insights and Forecast - by Deepwater and Ultra-Deep Water
- 7. North America UK Offshore Oil And Gas Decommissioning Market Analysis, Insights and Forecast, 2020-2032
- 7.1. Market Analysis, Insights and Forecast - by Shallow Water
- 7.2. Market Analysis, Insights and Forecast - by Deepwater and Ultra-Deep Water
- 8. South America UK Offshore Oil And Gas Decommissioning Market Analysis, Insights and Forecast, 2020-2032
- 8.1. Market Analysis, Insights and Forecast - by Shallow Water
- 8.2. Market Analysis, Insights and Forecast - by Deepwater and Ultra-Deep Water
- 9. Europe UK Offshore Oil And Gas Decommissioning Market Analysis, Insights and Forecast, 2020-2032
- 9.1. Market Analysis, Insights and Forecast - by Shallow Water
- 9.2. Market Analysis, Insights and Forecast - by Deepwater and Ultra-Deep Water
- 10. Middle East & Africa UK Offshore Oil And Gas Decommissioning Market Analysis, Insights and Forecast, 2020-2032
- 10.1. Market Analysis, Insights and Forecast - by Shallow Water
- 10.2. Market Analysis, Insights and Forecast - by Deepwater and Ultra-Deep Water
- 11. Asia Pacific UK Offshore Oil And Gas Decommissioning Market Analysis, Insights and Forecast, 2020-2032
- 11.1. Market Analysis, Insights and Forecast - by Shallow Water
- 11.2. Market Analysis, Insights and Forecast - by Deepwater and Ultra-Deep Water
- 12. Competitive Analysis
- 12.1. Company Profiles
- 12.1.1 Veolia Environnement S A
- 12.1.1.1. Company Overview
- 12.1.1.2. Products
- 12.1.1.3. Company Financials
- 12.1.1.4. SWOT Analysis
- 12.1.2 John Lawrie Group Ltd *List Not Exhaustive
- 12.1.2.1. Company Overview
- 12.1.2.2. Products
- 12.1.2.3. Company Financials
- 12.1.2.4. SWOT Analysis
- 12.1.3 AF Gruppen ASA
- 12.1.3.1. Company Overview
- 12.1.3.2. Products
- 12.1.3.3. Company Financials
- 12.1.3.4. SWOT Analysis
- 12.1.4 Ramboll Group A/S
- 12.1.4.1. Company Overview
- 12.1.4.2. Products
- 12.1.4.3. Company Financials
- 12.1.4.4. SWOT Analysis
- 12.1.5 Perenco SA
- 12.1.5.1. Company Overview
- 12.1.5.2. Products
- 12.1.5.3. Company Financials
- 12.1.5.4. SWOT Analysis
- 12.1.6 Derrick Services (UK) Ltd
- 12.1.6.1. Company Overview
- 12.1.6.2. Products
- 12.1.6.3. Company Financials
- 12.1.6.4. SWOT Analysis
- 12.1.1 Veolia Environnement S A
- 12.2. Market Entropy
- 12.2.1 Company's Key Areas Served
- 12.2.2 Recent Developments
- 12.3. Company Market Share Analysis 2025
- 12.3.1 Top 5 Companies Market Share Analysis
- 12.3.2 Top 3 Companies Market Share Analysis
- 12.4. List of Potential Customers
- 13. Research Methodology
List of Figures
- Figure 1: Global UK Offshore Oil And Gas Decommissioning Market Revenue Breakdown (billion, %) by Region 2025 & 2033
- Figure 2: Global UK Offshore Oil And Gas Decommissioning Market Volume Breakdown (K Units, %) by Region 2025 & 2033
- Figure 3: North America UK Offshore Oil And Gas Decommissioning Market Revenue (billion), by Shallow Water 2025 & 2033
- Figure 4: North America UK Offshore Oil And Gas Decommissioning Market Volume (K Units), by Shallow Water 2025 & 2033
- Figure 5: North America UK Offshore Oil And Gas Decommissioning Market Revenue Share (%), by Shallow Water 2025 & 2033
- Figure 6: North America UK Offshore Oil And Gas Decommissioning Market Volume Share (%), by Shallow Water 2025 & 2033
- Figure 7: North America UK Offshore Oil And Gas Decommissioning Market Revenue (billion), by Deepwater and Ultra-Deep Water 2025 & 2033
- Figure 8: North America UK Offshore Oil And Gas Decommissioning Market Volume (K Units), by Deepwater and Ultra-Deep Water 2025 & 2033
- Figure 9: North America UK Offshore Oil And Gas Decommissioning Market Revenue Share (%), by Deepwater and Ultra-Deep Water 2025 & 2033
- Figure 10: North America UK Offshore Oil And Gas Decommissioning Market Volume Share (%), by Deepwater and Ultra-Deep Water 2025 & 2033
- Figure 11: North America UK Offshore Oil And Gas Decommissioning Market Revenue (billion), by Country 2025 & 2033
- Figure 12: North America UK Offshore Oil And Gas Decommissioning Market Volume (K Units), by Country 2025 & 2033
- Figure 13: North America UK Offshore Oil And Gas Decommissioning Market Revenue Share (%), by Country 2025 & 2033
- Figure 14: North America UK Offshore Oil And Gas Decommissioning Market Volume Share (%), by Country 2025 & 2033
- Figure 15: South America UK Offshore Oil And Gas Decommissioning Market Revenue (billion), by Shallow Water 2025 & 2033
- Figure 16: South America UK Offshore Oil And Gas Decommissioning Market Volume (K Units), by Shallow Water 2025 & 2033
- Figure 17: South America UK Offshore Oil And Gas Decommissioning Market Revenue Share (%), by Shallow Water 2025 & 2033
- Figure 18: South America UK Offshore Oil And Gas Decommissioning Market Volume Share (%), by Shallow Water 2025 & 2033
- Figure 19: South America UK Offshore Oil And Gas Decommissioning Market Revenue (billion), by Deepwater and Ultra-Deep Water 2025 & 2033
- Figure 20: South America UK Offshore Oil And Gas Decommissioning Market Volume (K Units), by Deepwater and Ultra-Deep Water 2025 & 2033
- Figure 21: South America UK Offshore Oil And Gas Decommissioning Market Revenue Share (%), by Deepwater and Ultra-Deep Water 2025 & 2033
- Figure 22: South America UK Offshore Oil And Gas Decommissioning Market Volume Share (%), by Deepwater and Ultra-Deep Water 2025 & 2033
- Figure 23: South America UK Offshore Oil And Gas Decommissioning Market Revenue (billion), by Country 2025 & 2033
- Figure 24: South America UK Offshore Oil And Gas Decommissioning Market Volume (K Units), by Country 2025 & 2033
- Figure 25: South America UK Offshore Oil And Gas Decommissioning Market Revenue Share (%), by Country 2025 & 2033
- Figure 26: South America UK Offshore Oil And Gas Decommissioning Market Volume Share (%), by Country 2025 & 2033
- Figure 27: Europe UK Offshore Oil And Gas Decommissioning Market Revenue (billion), by Shallow Water 2025 & 2033
- Figure 28: Europe UK Offshore Oil And Gas Decommissioning Market Volume (K Units), by Shallow Water 2025 & 2033
- Figure 29: Europe UK Offshore Oil And Gas Decommissioning Market Revenue Share (%), by Shallow Water 2025 & 2033
- Figure 30: Europe UK Offshore Oil And Gas Decommissioning Market Volume Share (%), by Shallow Water 2025 & 2033
- Figure 31: Europe UK Offshore Oil And Gas Decommissioning Market Revenue (billion), by Deepwater and Ultra-Deep Water 2025 & 2033
- Figure 32: Europe UK Offshore Oil And Gas Decommissioning Market Volume (K Units), by Deepwater and Ultra-Deep Water 2025 & 2033
- Figure 33: Europe UK Offshore Oil And Gas Decommissioning Market Revenue Share (%), by Deepwater and Ultra-Deep Water 2025 & 2033
- Figure 34: Europe UK Offshore Oil And Gas Decommissioning Market Volume Share (%), by Deepwater and Ultra-Deep Water 2025 & 2033
- Figure 35: Europe UK Offshore Oil And Gas Decommissioning Market Revenue (billion), by Country 2025 & 2033
- Figure 36: Europe UK Offshore Oil And Gas Decommissioning Market Volume (K Units), by Country 2025 & 2033
- Figure 37: Europe UK Offshore Oil And Gas Decommissioning Market Revenue Share (%), by Country 2025 & 2033
- Figure 38: Europe UK Offshore Oil And Gas Decommissioning Market Volume Share (%), by Country 2025 & 2033
- Figure 39: Middle East & Africa UK Offshore Oil And Gas Decommissioning Market Revenue (billion), by Shallow Water 2025 & 2033
- Figure 40: Middle East & Africa UK Offshore Oil And Gas Decommissioning Market Volume (K Units), by Shallow Water 2025 & 2033
- Figure 41: Middle East & Africa UK Offshore Oil And Gas Decommissioning Market Revenue Share (%), by Shallow Water 2025 & 2033
- Figure 42: Middle East & Africa UK Offshore Oil And Gas Decommissioning Market Volume Share (%), by Shallow Water 2025 & 2033
- Figure 43: Middle East & Africa UK Offshore Oil And Gas Decommissioning Market Revenue (billion), by Deepwater and Ultra-Deep Water 2025 & 2033
- Figure 44: Middle East & Africa UK Offshore Oil And Gas Decommissioning Market Volume (K Units), by Deepwater and Ultra-Deep Water 2025 & 2033
- Figure 45: Middle East & Africa UK Offshore Oil And Gas Decommissioning Market Revenue Share (%), by Deepwater and Ultra-Deep Water 2025 & 2033
- Figure 46: Middle East & Africa UK Offshore Oil And Gas Decommissioning Market Volume Share (%), by Deepwater and Ultra-Deep Water 2025 & 2033
- Figure 47: Middle East & Africa UK Offshore Oil And Gas Decommissioning Market Revenue (billion), by Country 2025 & 2033
- Figure 48: Middle East & Africa UK Offshore Oil And Gas Decommissioning Market Volume (K Units), by Country 2025 & 2033
- Figure 49: Middle East & Africa UK Offshore Oil And Gas Decommissioning Market Revenue Share (%), by Country 2025 & 2033
- Figure 50: Middle East & Africa UK Offshore Oil And Gas Decommissioning Market Volume Share (%), by Country 2025 & 2033
- Figure 51: Asia Pacific UK Offshore Oil And Gas Decommissioning Market Revenue (billion), by Shallow Water 2025 & 2033
- Figure 52: Asia Pacific UK Offshore Oil And Gas Decommissioning Market Volume (K Units), by Shallow Water 2025 & 2033
- Figure 53: Asia Pacific UK Offshore Oil And Gas Decommissioning Market Revenue Share (%), by Shallow Water 2025 & 2033
- Figure 54: Asia Pacific UK Offshore Oil And Gas Decommissioning Market Volume Share (%), by Shallow Water 2025 & 2033
- Figure 55: Asia Pacific UK Offshore Oil And Gas Decommissioning Market Revenue (billion), by Deepwater and Ultra-Deep Water 2025 & 2033
- Figure 56: Asia Pacific UK Offshore Oil And Gas Decommissioning Market Volume (K Units), by Deepwater and Ultra-Deep Water 2025 & 2033
- Figure 57: Asia Pacific UK Offshore Oil And Gas Decommissioning Market Revenue Share (%), by Deepwater and Ultra-Deep Water 2025 & 2033
- Figure 58: Asia Pacific UK Offshore Oil And Gas Decommissioning Market Volume Share (%), by Deepwater and Ultra-Deep Water 2025 & 2033
- Figure 59: Asia Pacific UK Offshore Oil And Gas Decommissioning Market Revenue (billion), by Country 2025 & 2033
- Figure 60: Asia Pacific UK Offshore Oil And Gas Decommissioning Market Volume (K Units), by Country 2025 & 2033
- Figure 61: Asia Pacific UK Offshore Oil And Gas Decommissioning Market Revenue Share (%), by Country 2025 & 2033
- Figure 62: Asia Pacific UK Offshore Oil And Gas Decommissioning Market Volume Share (%), by Country 2025 & 2033
List of Tables
- Table 1: Global UK Offshore Oil And Gas Decommissioning Market Revenue billion Forecast, by Shallow Water 2020 & 2033
- Table 2: Global UK Offshore Oil And Gas Decommissioning Market Volume K Units Forecast, by Shallow Water 2020 & 2033
- Table 3: Global UK Offshore Oil And Gas Decommissioning Market Revenue billion Forecast, by Deepwater and Ultra-Deep Water 2020 & 2033
- Table 4: Global UK Offshore Oil And Gas Decommissioning Market Volume K Units Forecast, by Deepwater and Ultra-Deep Water 2020 & 2033
- Table 5: Global UK Offshore Oil And Gas Decommissioning Market Revenue billion Forecast, by Region 2020 & 2033
- Table 6: Global UK Offshore Oil And Gas Decommissioning Market Volume K Units Forecast, by Region 2020 & 2033
- Table 7: Global UK Offshore Oil And Gas Decommissioning Market Revenue billion Forecast, by Shallow Water 2020 & 2033
- Table 8: Global UK Offshore Oil And Gas Decommissioning Market Volume K Units Forecast, by Shallow Water 2020 & 2033
- Table 9: Global UK Offshore Oil And Gas Decommissioning Market Revenue billion Forecast, by Deepwater and Ultra-Deep Water 2020 & 2033
- Table 10: Global UK Offshore Oil And Gas Decommissioning Market Volume K Units Forecast, by Deepwater and Ultra-Deep Water 2020 & 2033
- Table 11: Global UK Offshore Oil And Gas Decommissioning Market Revenue billion Forecast, by Country 2020 & 2033
- Table 12: Global UK Offshore Oil And Gas Decommissioning Market Volume K Units Forecast, by Country 2020 & 2033
- Table 13: United States UK Offshore Oil And Gas Decommissioning Market Revenue (billion) Forecast, by Application 2020 & 2033
- Table 14: United States UK Offshore Oil And Gas Decommissioning Market Volume (K Units) Forecast, by Application 2020 & 2033
- Table 15: Canada UK Offshore Oil And Gas Decommissioning Market Revenue (billion) Forecast, by Application 2020 & 2033
- Table 16: Canada UK Offshore Oil And Gas Decommissioning Market Volume (K Units) Forecast, by Application 2020 & 2033
- Table 17: Mexico UK Offshore Oil And Gas Decommissioning Market Revenue (billion) Forecast, by Application 2020 & 2033
- Table 18: Mexico UK Offshore Oil And Gas Decommissioning Market Volume (K Units) Forecast, by Application 2020 & 2033
- Table 19: Global UK Offshore Oil And Gas Decommissioning Market Revenue billion Forecast, by Shallow Water 2020 & 2033
- Table 20: Global UK Offshore Oil And Gas Decommissioning Market Volume K Units Forecast, by Shallow Water 2020 & 2033
- Table 21: Global UK Offshore Oil And Gas Decommissioning Market Revenue billion Forecast, by Deepwater and Ultra-Deep Water 2020 & 2033
- Table 22: Global UK Offshore Oil And Gas Decommissioning Market Volume K Units Forecast, by Deepwater and Ultra-Deep Water 2020 & 2033
- Table 23: Global UK Offshore Oil And Gas Decommissioning Market Revenue billion Forecast, by Country 2020 & 2033
- Table 24: Global UK Offshore Oil And Gas Decommissioning Market Volume K Units Forecast, by Country 2020 & 2033
- Table 25: Brazil UK Offshore Oil And Gas Decommissioning Market Revenue (billion) Forecast, by Application 2020 & 2033
- Table 26: Brazil UK Offshore Oil And Gas Decommissioning Market Volume (K Units) Forecast, by Application 2020 & 2033
- Table 27: Argentina UK Offshore Oil And Gas Decommissioning Market Revenue (billion) Forecast, by Application 2020 & 2033
- Table 28: Argentina UK Offshore Oil And Gas Decommissioning Market Volume (K Units) Forecast, by Application 2020 & 2033
- Table 29: Rest of South America UK Offshore Oil And Gas Decommissioning Market Revenue (billion) Forecast, by Application 2020 & 2033
- Table 30: Rest of South America UK Offshore Oil And Gas Decommissioning Market Volume (K Units) Forecast, by Application 2020 & 2033
- Table 31: Global UK Offshore Oil And Gas Decommissioning Market Revenue billion Forecast, by Shallow Water 2020 & 2033
- Table 32: Global UK Offshore Oil And Gas Decommissioning Market Volume K Units Forecast, by Shallow Water 2020 & 2033
- Table 33: Global UK Offshore Oil And Gas Decommissioning Market Revenue billion Forecast, by Deepwater and Ultra-Deep Water 2020 & 2033
- Table 34: Global UK Offshore Oil And Gas Decommissioning Market Volume K Units Forecast, by Deepwater and Ultra-Deep Water 2020 & 2033
- Table 35: Global UK Offshore Oil And Gas Decommissioning Market Revenue billion Forecast, by Country 2020 & 2033
- Table 36: Global UK Offshore Oil And Gas Decommissioning Market Volume K Units Forecast, by Country 2020 & 2033
- Table 37: United Kingdom UK Offshore Oil And Gas Decommissioning Market Revenue (billion) Forecast, by Application 2020 & 2033
- Table 38: United Kingdom UK Offshore Oil And Gas Decommissioning Market Volume (K Units) Forecast, by Application 2020 & 2033
- Table 39: Germany UK Offshore Oil And Gas Decommissioning Market Revenue (billion) Forecast, by Application 2020 & 2033
- Table 40: Germany UK Offshore Oil And Gas Decommissioning Market Volume (K Units) Forecast, by Application 2020 & 2033
- Table 41: France UK Offshore Oil And Gas Decommissioning Market Revenue (billion) Forecast, by Application 2020 & 2033
- Table 42: France UK Offshore Oil And Gas Decommissioning Market Volume (K Units) Forecast, by Application 2020 & 2033
- Table 43: Italy UK Offshore Oil And Gas Decommissioning Market Revenue (billion) Forecast, by Application 2020 & 2033
- Table 44: Italy UK Offshore Oil And Gas Decommissioning Market Volume (K Units) Forecast, by Application 2020 & 2033
- Table 45: Spain UK Offshore Oil And Gas Decommissioning Market Revenue (billion) Forecast, by Application 2020 & 2033
- Table 46: Spain UK Offshore Oil And Gas Decommissioning Market Volume (K Units) Forecast, by Application 2020 & 2033
- Table 47: Russia UK Offshore Oil And Gas Decommissioning Market Revenue (billion) Forecast, by Application 2020 & 2033
- Table 48: Russia UK Offshore Oil And Gas Decommissioning Market Volume (K Units) Forecast, by Application 2020 & 2033
- Table 49: Benelux UK Offshore Oil And Gas Decommissioning Market Revenue (billion) Forecast, by Application 2020 & 2033
- Table 50: Benelux UK Offshore Oil And Gas Decommissioning Market Volume (K Units) Forecast, by Application 2020 & 2033
- Table 51: Nordics UK Offshore Oil And Gas Decommissioning Market Revenue (billion) Forecast, by Application 2020 & 2033
- Table 52: Nordics UK Offshore Oil And Gas Decommissioning Market Volume (K Units) Forecast, by Application 2020 & 2033
- Table 53: Rest of Europe UK Offshore Oil And Gas Decommissioning Market Revenue (billion) Forecast, by Application 2020 & 2033
- Table 54: Rest of Europe UK Offshore Oil And Gas Decommissioning Market Volume (K Units) Forecast, by Application 2020 & 2033
- Table 55: Global UK Offshore Oil And Gas Decommissioning Market Revenue billion Forecast, by Shallow Water 2020 & 2033
- Table 56: Global UK Offshore Oil And Gas Decommissioning Market Volume K Units Forecast, by Shallow Water 2020 & 2033
- Table 57: Global UK Offshore Oil And Gas Decommissioning Market Revenue billion Forecast, by Deepwater and Ultra-Deep Water 2020 & 2033
- Table 58: Global UK Offshore Oil And Gas Decommissioning Market Volume K Units Forecast, by Deepwater and Ultra-Deep Water 2020 & 2033
- Table 59: Global UK Offshore Oil And Gas Decommissioning Market Revenue billion Forecast, by Country 2020 & 2033
- Table 60: Global UK Offshore Oil And Gas Decommissioning Market Volume K Units Forecast, by Country 2020 & 2033
- Table 61: Turkey UK Offshore Oil And Gas Decommissioning Market Revenue (billion) Forecast, by Application 2020 & 2033
- Table 62: Turkey UK Offshore Oil And Gas Decommissioning Market Volume (K Units) Forecast, by Application 2020 & 2033
- Table 63: Israel UK Offshore Oil And Gas Decommissioning Market Revenue (billion) Forecast, by Application 2020 & 2033
- Table 64: Israel UK Offshore Oil And Gas Decommissioning Market Volume (K Units) Forecast, by Application 2020 & 2033
- Table 65: GCC UK Offshore Oil And Gas Decommissioning Market Revenue (billion) Forecast, by Application 2020 & 2033
- Table 66: GCC UK Offshore Oil And Gas Decommissioning Market Volume (K Units) Forecast, by Application 2020 & 2033
- Table 67: North Africa UK Offshore Oil And Gas Decommissioning Market Revenue (billion) Forecast, by Application 2020 & 2033
- Table 68: North Africa UK Offshore Oil And Gas Decommissioning Market Volume (K Units) Forecast, by Application 2020 & 2033
- Table 69: South Africa UK Offshore Oil And Gas Decommissioning Market Revenue (billion) Forecast, by Application 2020 & 2033
- Table 70: South Africa UK Offshore Oil And Gas Decommissioning Market Volume (K Units) Forecast, by Application 2020 & 2033
- Table 71: Rest of Middle East & Africa UK Offshore Oil And Gas Decommissioning Market Revenue (billion) Forecast, by Application 2020 & 2033
- Table 72: Rest of Middle East & Africa UK Offshore Oil And Gas Decommissioning Market Volume (K Units) Forecast, by Application 2020 & 2033
- Table 73: Global UK Offshore Oil And Gas Decommissioning Market Revenue billion Forecast, by Shallow Water 2020 & 2033
- Table 74: Global UK Offshore Oil And Gas Decommissioning Market Volume K Units Forecast, by Shallow Water 2020 & 2033
- Table 75: Global UK Offshore Oil And Gas Decommissioning Market Revenue billion Forecast, by Deepwater and Ultra-Deep Water 2020 & 2033
- Table 76: Global UK Offshore Oil And Gas Decommissioning Market Volume K Units Forecast, by Deepwater and Ultra-Deep Water 2020 & 2033
- Table 77: Global UK Offshore Oil And Gas Decommissioning Market Revenue billion Forecast, by Country 2020 & 2033
- Table 78: Global UK Offshore Oil And Gas Decommissioning Market Volume K Units Forecast, by Country 2020 & 2033
- Table 79: China UK Offshore Oil And Gas Decommissioning Market Revenue (billion) Forecast, by Application 2020 & 2033
- Table 80: China UK Offshore Oil And Gas Decommissioning Market Volume (K Units) Forecast, by Application 2020 & 2033
- Table 81: India UK Offshore Oil And Gas Decommissioning Market Revenue (billion) Forecast, by Application 2020 & 2033
- Table 82: India UK Offshore Oil And Gas Decommissioning Market Volume (K Units) Forecast, by Application 2020 & 2033
- Table 83: Japan UK Offshore Oil And Gas Decommissioning Market Revenue (billion) Forecast, by Application 2020 & 2033
- Table 84: Japan UK Offshore Oil And Gas Decommissioning Market Volume (K Units) Forecast, by Application 2020 & 2033
- Table 85: South Korea UK Offshore Oil And Gas Decommissioning Market Revenue (billion) Forecast, by Application 2020 & 2033
- Table 86: South Korea UK Offshore Oil And Gas Decommissioning Market Volume (K Units) Forecast, by Application 2020 & 2033
- Table 87: ASEAN UK Offshore Oil And Gas Decommissioning Market Revenue (billion) Forecast, by Application 2020 & 2033
- Table 88: ASEAN UK Offshore Oil And Gas Decommissioning Market Volume (K Units) Forecast, by Application 2020 & 2033
- Table 89: Oceania UK Offshore Oil And Gas Decommissioning Market Revenue (billion) Forecast, by Application 2020 & 2033
- Table 90: Oceania UK Offshore Oil And Gas Decommissioning Market Volume (K Units) Forecast, by Application 2020 & 2033
- Table 91: Rest of Asia Pacific UK Offshore Oil And Gas Decommissioning Market Revenue (billion) Forecast, by Application 2020 & 2033
- Table 92: Rest of Asia Pacific UK Offshore Oil And Gas Decommissioning Market Volume (K Units) Forecast, by Application 2020 & 2033
Frequently Asked Questions
1. What is the projected Compound Annual Growth Rate (CAGR) of the UK Offshore Oil And Gas Decommissioning Market?
The projected CAGR is approximately 6.5%.
2. Which companies are prominent players in the UK Offshore Oil And Gas Decommissioning Market?
Key companies in the market include Veolia Environnement S A, John Lawrie Group Ltd *List Not Exhaustive, AF Gruppen ASA, Ramboll Group A/S, Perenco SA, Derrick Services (UK) Ltd.
3. What are the main segments of the UK Offshore Oil And Gas Decommissioning Market?
The market segments include Shallow Water, Deepwater and Ultra-Deep Water.
4. Can you provide details about the market size?
The market size is estimated to be USD 11.1 billion as of 2022.
5. What are some drivers contributing to market growth?
4.; Supportive Government Policies in Developing Solar Energy4.; Abundant Solar Resources Across the Country.
6. What are the notable trends driving market growth?
Increasing Decommissioning Projects to Drive the Market.
7. Are there any restraints impacting market growth?
4.; Competition from Conventional Energy Sources.
8. Can you provide examples of recent developments in the market?
November 2022: there were more than 2,000 abandoned oil and gas wells in the North Sea begin, The high number of abandoned wells is expected to lead to an increase in activity as operations worth EUR 20 billion are decommissioned and shut down. The research was conducted by industry group Offshore Energies UK (OEUK), formerly Oil & Gas UK, which provides fresh insight into petroleum decommissioning efforts.
9. What pricing options are available for accessing the report?
Pricing options include single-user, multi-user, and enterprise licenses priced at USD 3800, USD 4500, and USD 5800 respectively.
10. Is the market size provided in terms of value or volume?
The market size is provided in terms of value, measured in billion and volume, measured in K Units.
11. Are there any specific market keywords associated with the report?
Yes, the market keyword associated with the report is "UK Offshore Oil And Gas Decommissioning Market," which aids in identifying and referencing the specific market segment covered.
12. How do I determine which pricing option suits my needs best?
The pricing options vary based on user requirements and access needs. Individual users may opt for single-user licenses, while businesses requiring broader access may choose multi-user or enterprise licenses for cost-effective access to the report.
13. Are there any additional resources or data provided in the UK Offshore Oil And Gas Decommissioning Market report?
While the report offers comprehensive insights, it's advisable to review the specific contents or supplementary materials provided to ascertain if additional resources or data are available.
14. How can I stay updated on further developments or reports in the UK Offshore Oil And Gas Decommissioning Market?
To stay informed about further developments, trends, and reports in the UK Offshore Oil And Gas Decommissioning Market, consider subscribing to industry newsletters, following relevant companies and organizations, or regularly checking reputable industry news sources and publications.
Methodology
Step 1 - Identification of Relevant Samples Size from Population Database


Step 2 - Approaches for Defining Global Market Size (Value, Volume* & Price*)

Note*: In applicable scenarios
Step 3 - Data Sources
Primary Research
- Web Analytics
- Survey Reports
- Research Institute
- Latest Research Reports
- Opinion Leaders
Secondary Research
- Annual Reports
- White Paper
- Latest Press Release
- Industry Association
- Paid Database
- Investor Presentations

Step 4 - Data Triangulation
Involves using different sources of information in order to increase the validity of a study
These sources are likely to be stakeholders in a program - participants, other researchers, program staff, other community members, and so on.
Then we put all data in single framework & apply various statistical tools to find out the dynamic on the market.
During the analysis stage, feedback from the stakeholder groups would be compared to determine areas of agreement as well as areas of divergence