

Key Insights
The United States Refined Petroleum Products market is projected for significant expansion, anticipated to reach $1610.72 billion by 2033. Driven by robust demand from the transportation and industrial sectors, the market is set to grow at a Compound Annual Growth Rate (CAGR) of 5.2% from a base year of 2025. Key growth drivers include increasing vehicle ownership, expanding air travel, and the sustained need for petrochemicals in manufacturing. Automotive fuels, comprising gasoline and diesel, represent the largest market segment, underscoring the nation's reliance on these critical transportation modes. While Liquefied Petroleum Gas (LPG) shows moderate growth, specialty fuels and biofuels are poised for dynamic expansion, propelled by environmental mandates and the transition to sustainable energy solutions.
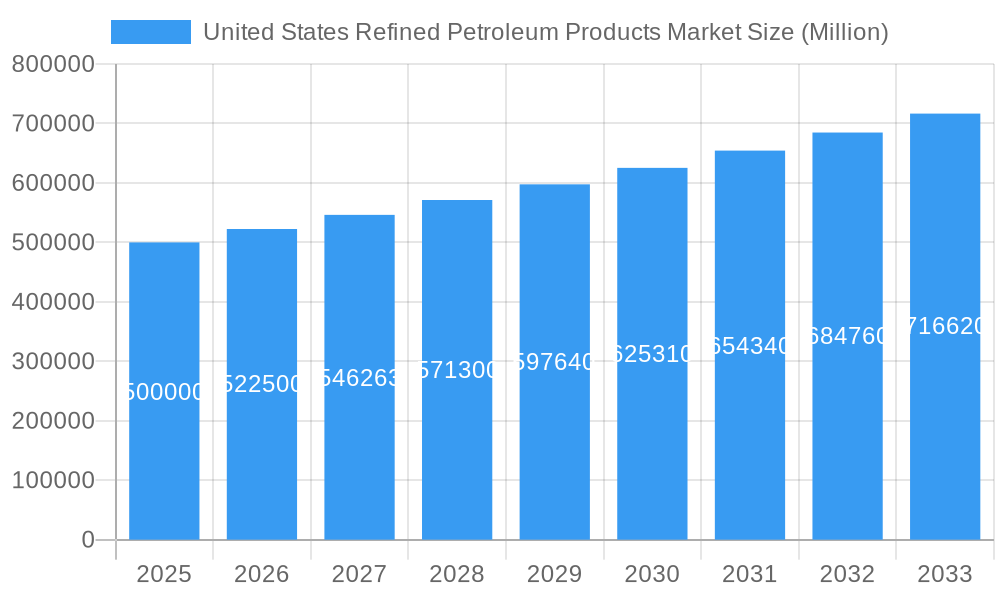
United States Refined Petroleum Products Market Market Size (In Million)
Challenges to market growth include volatile crude oil prices, stringent environmental regulations focused on reducing carbon emissions, and the increasing adoption of alternative energy solutions such as electric vehicles. Despite these headwinds, ongoing infrastructure development and advancements in refining technologies are expected to support sustained market growth throughout the forecast period. The market size unit is billion.
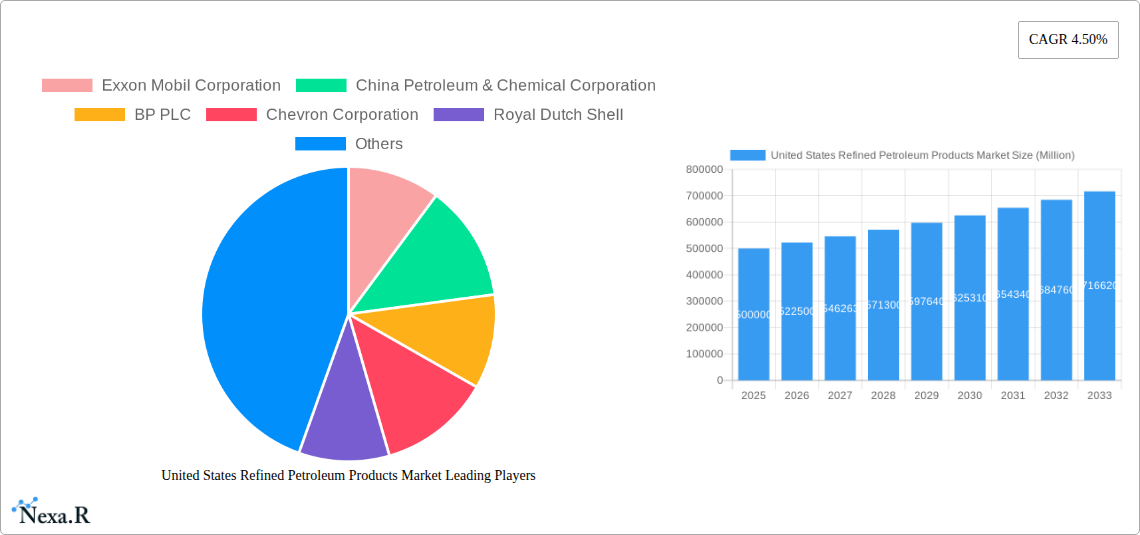
United States Refined Petroleum Products Market Company Market Share
The competitive environment is characterized by the dominance of major integrated oil corporations, including Exxon Mobil, Chevron, and Shell, who leverage extensive refining capabilities and nationwide distribution networks. These industry leaders are actively upgrading their facilities to comply with evolving fuel standards and environmental regulations. The presence of smaller, independent refiners injects further dynamism, particularly in regional markets. Mergers, acquisitions, strategic alliances, and technological innovation will continue to shape the competitive landscape. Evolving fuel efficiency standards and the growing adoption of alternative fuels present both strategic challenges and opportunities, necessitating adaptation and investment in novel technologies and business models. The market's trajectory reflects a complex interplay of demand dynamics, regulatory shifts, and technological advancements.
United States Refined Petroleum Products Market: A Comprehensive Report (2019-2033)
This comprehensive report provides an in-depth analysis of the United States Refined Petroleum Products Market, offering invaluable insights for industry professionals, investors, and strategic decision-makers. The report covers the period 2019-2033, with a base year of 2025 and a forecast period of 2025-2033. The market is segmented by type: Automotive Fuels, Marine Fuels, Aviation Fuels, Liquefied Petroleum Gas (LPG), and Other Fuel Types. Key players analyzed include Exxon Mobil Corporation, China Petroleum & Chemical Corporation, BP PLC, Chevron Corporation, and Royal Dutch Shell. The report is valued at xx Million units.
United States Refined Petroleum Products Market Market Dynamics & Structure
The United States refined petroleum products market is a mature yet dynamic landscape characterized by high market concentration among major players and significant technological advancements. The market's structure is shaped by stringent regulatory frameworks governing emissions, safety, and distribution, alongside the constant pressure from the development of alternative energy sources. The competitive landscape is further intensified by the presence of substitute products and the ongoing evolution of consumer preferences. Mergers and acquisitions (M&A) activity plays a crucial role in consolidating market share and driving innovation.
- Market Concentration: The top 5 players hold approximately xx% of the market share in 2025, indicating a highly consolidated market.
- Technological Innovation: Continuous investment in refining technologies to improve efficiency, reduce emissions, and produce higher-quality fuels is a significant driver. However, high capital expenditures pose a barrier to entry for smaller players.
- Regulatory Framework: Stringent environmental regulations, such as those related to sulfur content and emissions standards, significantly impact product development and distribution.
- Competitive Product Substitutes: The rise of electric vehicles and biofuels presents a significant challenge, albeit a gradual one, to the dominance of traditional refined petroleum products.
- End-User Demographics: The market is primarily driven by the transportation sector (automotive, marine, aviation), with varying growth rates depending on economic conditions and government policies.
- M&A Trends: The historical period (2019-2024) witnessed xx M&A deals, primarily focused on consolidating assets and expanding market reach. This trend is expected to continue during the forecast period.
United States Refined Petroleum Products Market Growth Trends & Insights
The United States refined petroleum products market experienced a period of [Describe Growth Trend from 2019-2024 – e.g., moderate growth followed by a downturn due to the pandemic] during the historical period. The market size, valued at xx Million units in 2024, is projected to reach xx Million units by 2033, exhibiting a CAGR of xx% during the forecast period (2025-2033). This growth is influenced by several interconnected factors: fluctuations in crude oil prices, economic growth influencing fuel demand, the adoption of stricter environmental regulations, and technological advancements impacting refining efficiency and product quality. Consumer behavior shifts, particularly towards more fuel-efficient vehicles, are gradually impacting the market's trajectory. Technological disruptions, such as the development of advanced biofuels and the increasing penetration of electric vehicles, are gradually reshaping the market landscape.
Dominant Regions, Countries, or Segments in United States Refined Petroleum Products Market
The Automotive Fuels segment dominates the market, accounting for approximately xx% of the total market value in 2025. This dominance is primarily driven by the high demand from the transportation sector. While the growth rates of other segments (Marine, Aviation, LPG, Other Fuel Types) vary, the overall market is heavily influenced by the automotive sector's performance. Specific states like Texas, California, and Louisiana, with their extensive refining infrastructure and high population density, are leading regional markets.
- Key Drivers for Automotive Fuels:
- Strong economic activity leading to increased vehicle usage.
- Expanding highway infrastructure.
- Government subsidies and incentives (where applicable).
- Geographic Dominance: The South Central region of the U.S. boasts the highest concentration of refineries and thus holds a significant market share. This area benefits from a well-established infrastructure and proximity to major crude oil sources.
United States Refined Petroleum Products Market Product Landscape
The refined petroleum products market features a wide array of products, each catering to specific applications and performance requirements. Innovations focus on enhancing fuel efficiency, reducing emissions, and improving performance characteristics. For example, the development of cleaner-burning fuels with lower sulfur content meets stringent environmental regulations and satisfies consumer demand for environmentally responsible products. Furthermore, technological advancements in refining processes result in optimized fuel production with reduced waste and improved energy efficiency.
Key Drivers, Barriers & Challenges in United States Refined Petroleum Products Market
Key Drivers:
- Increased Vehicle Ownership: Growing populations and rising incomes fuel demand for gasoline and diesel.
- Robust Transportation Infrastructure: Extensive road networks support fuel consumption.
- Economic Growth: A strong economy translates to increased industrial and commercial activity requiring substantial fuel supplies.
Key Challenges:
- Fluctuating Crude Oil Prices: Volatility in global crude oil markets directly impacts the production costs and market pricing.
- Environmental Regulations: Stricter emission standards necessitate continuous investments in cleaner technologies.
- Competition from Alternatives: The rise of electric vehicles and renewable fuels poses long-term competitive pressures. Electric vehicle penetration is projected to reach xx% by 2033, impacting gasoline demand.
Emerging Opportunities in United States Refined Petroleum Products Market
- Biofuels and Renewable Fuels: The increasing focus on sustainable energy presents opportunities for biofuel blending and the development of advanced biofuels.
- Fuel Additives and Enhancements: Innovations in fuel additives offering improved fuel efficiency, reduced emissions, and enhanced performance are promising areas.
- Strategic Partnerships and Collaboration: Joint ventures and partnerships between traditional energy companies and technology developers to explore renewable fuel alternatives are gaining traction.
Growth Accelerators in the United States Refined Petroleum Products Market Industry
The long-term growth of the U.S. refined petroleum products market hinges on strategic investments in efficient refining technologies, the development and adoption of cleaner fuels, and the diversification of energy sources. Strategic partnerships between energy companies and technology providers can accelerate innovation and market penetration of advanced fuels. Expansion into new markets and the development of specialized fuel products for niche applications also offer significant growth potential.
Key Players Shaping the United States Refined Petroleum Products Market Market
Notable Milestones in United States Refined Petroleum Products Market Sector
- July 2021: Contango Oil & Gas acquired low-decline, conventional gas assets in Wyoming for USD 67 million, demonstrating ongoing M&A activity in the broader energy sector, indirectly impacting the refined petroleum market through resource consolidation.
In-Depth United States Refined Petroleum Products Market Market Outlook
The future of the United States refined petroleum products market is intricately linked to global energy transitions and evolving consumer preferences. While the dominance of traditional fuels is expected to gradually decline, the market will still play a vital role in the transportation sector for the foreseeable future. Strategic opportunities lie in embracing sustainable practices, investing in advanced refining technologies, and exploring partnerships to facilitate the transition towards a more diversified energy landscape. The market's long-term growth will depend on adapting to evolving regulatory environments and effectively addressing consumer demands for cleaner and more sustainable energy options.
United States Refined Petroleum Products Market Segmentation
-
1. Type
- 1.1. Automotive Fuels
- 1.2. Marine Fuels
- 1.3. Aviation Fuels
- 1.4. Liquefied Petroleum Gas (LPG)
- 1.5. Other Fuel Types
- 2. Geography
United States Refined Petroleum Products Market Segmentation By Geography
- 1. United States
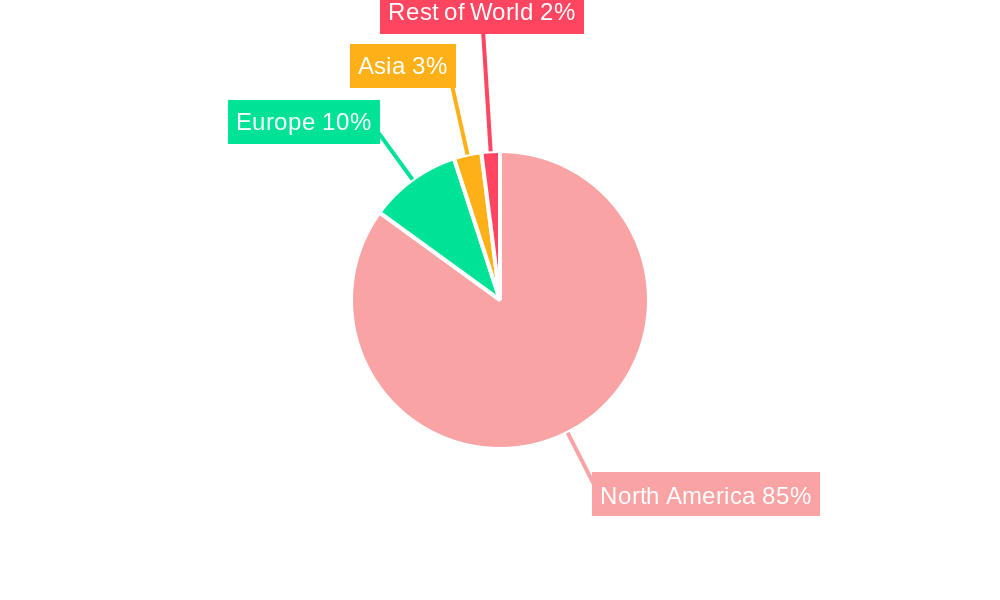
United States Refined Petroleum Products Market Regional Market Share
Geographic Coverage of United States Refined Petroleum Products Market
United States Refined Petroleum Products Market REPORT HIGHLIGHTS
| Aspects | Details |
|---|---|
| Study Period | 2020-2034 |
| Base Year | 2025 |
| Estimated Year | 2026 |
| Forecast Period | 2026-2034 |
| Historical Period | 2020-2025 |
| Growth Rate | CAGR of 5.2% from 2020-2034 |
| Segmentation |
|
Table of Contents
- 1. Introduction
- 1.1. Research Scope
- 1.2. Market Segmentation
- 1.3. Research Methodology
- 1.4. Definitions and Assumptions
- 2. Executive Summary
- 2.1. Introduction
- 3. Market Dynamics
- 3.1. Introduction
- 3.2. Market Drivers
- 3.2.1. 4.; Growing Demand for Renewable Energy4.; Upcoming Investments in the Energy Sector and Supportive Renewable Energy Policies
- 3.3. Market Restrains
- 3.3.1. 4.; High Initial Investment Cost and Long Investment Return Period on Projects
- 3.4. Market Trends
- 3.4.1. Aviation Fuel Usage to Grow Significantly
- 4. Market Factor Analysis
- 4.1. Porters Five Forces
- 4.2. Supply/Value Chain
- 4.3. PESTEL analysis
- 4.4. Market Entropy
- 4.5. Patent/Trademark Analysis
- 5. United States Refined Petroleum Products Market Analysis, Insights and Forecast, 2020-2032
- 5.1. Market Analysis, Insights and Forecast - by Type
- 5.1.1. Automotive Fuels
- 5.1.2. Marine Fuels
- 5.1.3. Aviation Fuels
- 5.1.4. Liquefied Petroleum Gas (LPG)
- 5.1.5. Other Fuel Types
- 5.2. Market Analysis, Insights and Forecast - by Geography
- 5.3. Market Analysis, Insights and Forecast - by Region
- 5.3.1. United States
- 5.1. Market Analysis, Insights and Forecast - by Type
- 6. Competitive Analysis
- 6.1. Market Share Analysis 2025
- 6.2. Company Profiles
- 6.2.1 Exxon Mobil Corporation
- 6.2.1.1. Overview
- 6.2.1.2. Products
- 6.2.1.3. SWOT Analysis
- 6.2.1.4. Recent Developments
- 6.2.1.5. Financials (Based on Availability)
- 6.2.2 China Petroleum & Chemical Corporation
- 6.2.2.1. Overview
- 6.2.2.2. Products
- 6.2.2.3. SWOT Analysis
- 6.2.2.4. Recent Developments
- 6.2.2.5. Financials (Based on Availability)
- 6.2.3 BP PLC
- 6.2.3.1. Overview
- 6.2.3.2. Products
- 6.2.3.3. SWOT Analysis
- 6.2.3.4. Recent Developments
- 6.2.3.5. Financials (Based on Availability)
- 6.2.4 Chevron Corporation
- 6.2.4.1. Overview
- 6.2.4.2. Products
- 6.2.4.3. SWOT Analysis
- 6.2.4.4. Recent Developments
- 6.2.4.5. Financials (Based on Availability)
- 6.2.5 Royal Dutch Shell
- 6.2.5.1. Overview
- 6.2.5.2. Products
- 6.2.5.3. SWOT Analysis
- 6.2.5.4. Recent Developments
- 6.2.5.5. Financials (Based on Availability)
- 6.2.1 Exxon Mobil Corporation
List of Figures
- Figure 1: United States Refined Petroleum Products Market Revenue Breakdown (billion, %) by Product 2025 & 2033
- Figure 2: United States Refined Petroleum Products Market Share (%) by Company 2025
List of Tables
- Table 1: United States Refined Petroleum Products Market Revenue billion Forecast, by Type 2020 & 2033
- Table 2: United States Refined Petroleum Products Market Volume Litre Forecast, by Type 2020 & 2033
- Table 3: United States Refined Petroleum Products Market Revenue billion Forecast, by Geography 2020 & 2033
- Table 4: United States Refined Petroleum Products Market Volume Litre Forecast, by Geography 2020 & 2033
- Table 5: United States Refined Petroleum Products Market Revenue billion Forecast, by Region 2020 & 2033
- Table 6: United States Refined Petroleum Products Market Volume Litre Forecast, by Region 2020 & 2033
- Table 7: United States Refined Petroleum Products Market Revenue billion Forecast, by Type 2020 & 2033
- Table 8: United States Refined Petroleum Products Market Volume Litre Forecast, by Type 2020 & 2033
- Table 9: United States Refined Petroleum Products Market Revenue billion Forecast, by Geography 2020 & 2033
- Table 10: United States Refined Petroleum Products Market Volume Litre Forecast, by Geography 2020 & 2033
- Table 11: United States Refined Petroleum Products Market Revenue billion Forecast, by Country 2020 & 2033
- Table 12: United States Refined Petroleum Products Market Volume Litre Forecast, by Country 2020 & 2033
Frequently Asked Questions
1. What is the projected Compound Annual Growth Rate (CAGR) of the United States Refined Petroleum Products Market?
The projected CAGR is approximately 5.2%.
2. Which companies are prominent players in the United States Refined Petroleum Products Market?
Key companies in the market include Exxon Mobil Corporation, China Petroleum & Chemical Corporation, BP PLC, Chevron Corporation, Royal Dutch Shell.
3. What are the main segments of the United States Refined Petroleum Products Market?
The market segments include Type, Geography.
4. Can you provide details about the market size?
The market size is estimated to be USD 1610.72 billion as of 2022.
5. What are some drivers contributing to market growth?
4.; Growing Demand for Renewable Energy4.; Upcoming Investments in the Energy Sector and Supportive Renewable Energy Policies.
6. What are the notable trends driving market growth?
Aviation Fuel Usage to Grow Significantly.
7. Are there any restraints impacting market growth?
4.; High Initial Investment Cost and Long Investment Return Period on Projects.
8. Can you provide examples of recent developments in the market?
July 2021: Contango Oil & Gas agreed to acquire low-decline, conventional gas assets in the Wind River Basin of Wyoming, United States, from ConocoPhillips in a USD 67 million cash deal.
9. What pricing options are available for accessing the report?
Pricing options include single-user, multi-user, and enterprise licenses priced at USD 3800, USD 4500, and USD 5800 respectively.
10. Is the market size provided in terms of value or volume?
The market size is provided in terms of value, measured in billion and volume, measured in Litre.
11. Are there any specific market keywords associated with the report?
Yes, the market keyword associated with the report is "United States Refined Petroleum Products Market," which aids in identifying and referencing the specific market segment covered.
12. How do I determine which pricing option suits my needs best?
The pricing options vary based on user requirements and access needs. Individual users may opt for single-user licenses, while businesses requiring broader access may choose multi-user or enterprise licenses for cost-effective access to the report.
13. Are there any additional resources or data provided in the United States Refined Petroleum Products Market report?
While the report offers comprehensive insights, it's advisable to review the specific contents or supplementary materials provided to ascertain if additional resources or data are available.
14. How can I stay updated on further developments or reports in the United States Refined Petroleum Products Market?
To stay informed about further developments, trends, and reports in the United States Refined Petroleum Products Market, consider subscribing to industry newsletters, following relevant companies and organizations, or regularly checking reputable industry news sources and publications.
Methodology
Step 1 - Identification of Relevant Samples Size from Population Database


Step 2 - Approaches for Defining Global Market Size (Value, Volume* & Price*)

Note*: In applicable scenarios
Step 3 - Data Sources
Primary Research
- Web Analytics
- Survey Reports
- Research Institute
- Latest Research Reports
- Opinion Leaders
Secondary Research
- Annual Reports
- White Paper
- Latest Press Release
- Industry Association
- Paid Database
- Investor Presentations

Step 4 - Data Triangulation
Involves using different sources of information in order to increase the validity of a study
These sources are likely to be stakeholders in a program - participants, other researchers, program staff, other community members, and so on.
Then we put all data in single framework & apply various statistical tools to find out the dynamic on the market.
During the analysis stage, feedback from the stakeholder groups would be compared to determine areas of agreement as well as areas of divergence