

Key Insights
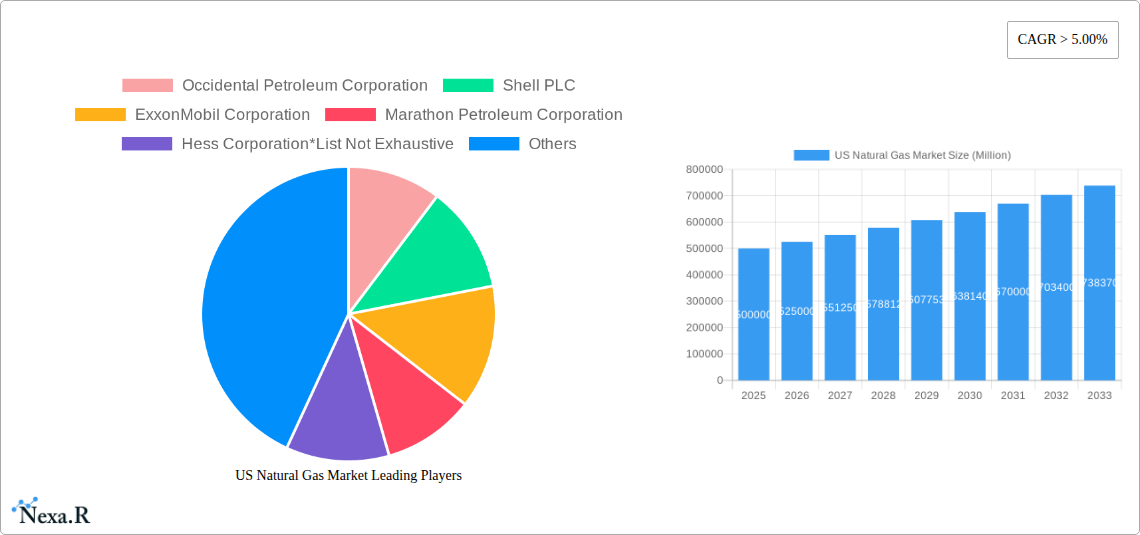
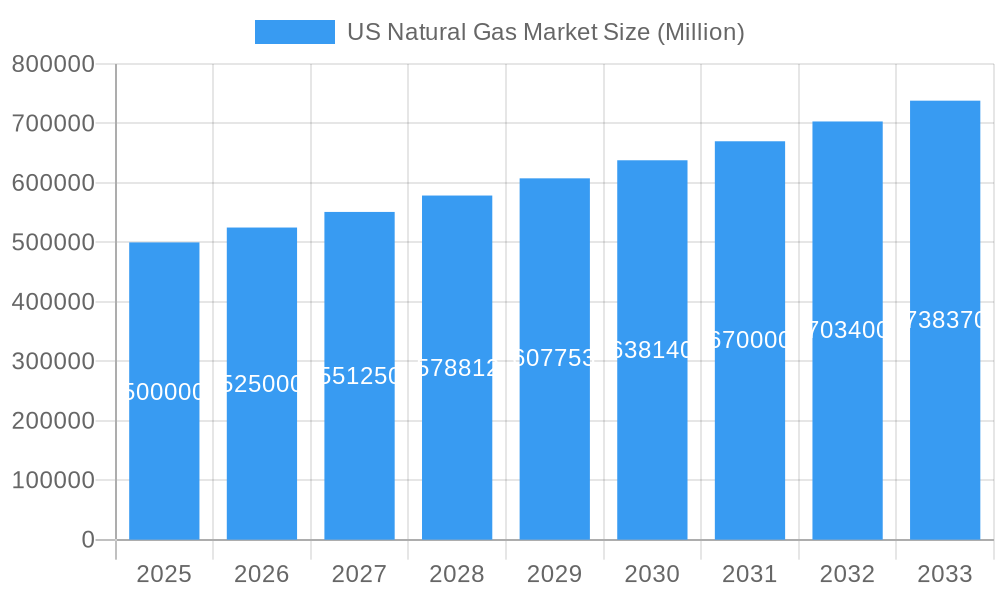
The U.S. natural gas market is projected for substantial growth, estimated at $473.4 billion in 2025, with a projected Compound Annual Growth Rate (CAGR) of 3.5% from 2025 to 2033. This expansion is primarily fueled by increasing demand from the power generation sector, which is actively transitioning to cleaner energy sources, with natural gas serving as a critical bridge fuel. The automotive sector, driven by the growing adoption of Compressed Natural Gas (CNG) vehicles, also contributes to this growth. Industrial applications, spanning manufacturing and chemicals, continue to rely on natural gas for its consistent and versatile energy supply. Residential consumption remains a stable and significant market segment. Advancements in extraction technologies are further supporting market growth by enhancing efficiency and reducing costs.
US Natural Gas Market Market Size (In Billion)
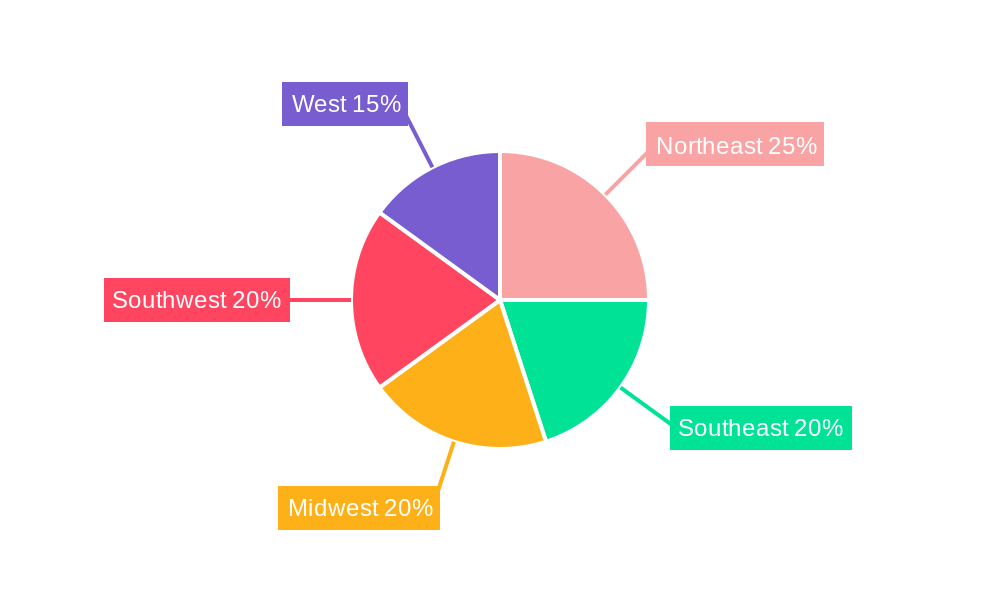
Key market restraints include environmental concerns regarding methane emissions, necessitating ongoing improvements in extraction and transportation to minimize greenhouse gas impact. Price volatility, influenced by global energy dynamics and geopolitical factors, presents a significant risk. Regulatory shifts and policies favoring renewable energy could also affect the market's trajectory. Competitive pressures from renewable energy sources and alternative fuel technologies may moderate growth rates. Analysis indicates wet natural gas currently commands a larger market share than dry natural gas. Regional growth variations are notable, with the Northeast, Southwest, and West demonstrating higher potential due to factors such as population density, industrial activity, and regulatory environments.
US Natural Gas Market Company Market Share
US Natural Gas Market: A Comprehensive Report (2019-2033)
This in-depth report provides a comprehensive analysis of the US Natural Gas Market, covering market dynamics, growth trends, dominant segments, and key players. With a study period spanning 2019-2033, a base year of 2025, and a forecast period of 2025-2033, this report offers invaluable insights for industry professionals, investors, and stakeholders seeking to navigate the complexities of this dynamic energy sector. The report leverages extensive data and analysis to deliver actionable intelligence for strategic decision-making. The market is segmented by type (Wet Natural Gas, Dry Natural Gas) and end-use (Power Generation, Automotive, Residential, Industries).
US Natural Gas Market Dynamics & Structure
This section analyzes the US natural gas market structure, encompassing market concentration, technological innovation, regulatory frameworks, competitive substitutes, end-user demographics, and M&A activity. The report explores the influence of key players like Occidental Petroleum Corporation, Shell PLC, ExxonMobil Corporation, Marathon Petroleum Corporation, Hess Corporation, ConocoPhillips, Chevron Corporation, TotalEnergies SE, Phillips 66, and EOG Resources Inc. on market dynamics.
- Market Concentration: The US natural gas market exhibits a moderately concentrated structure, with a few major players holding significant market share. xx% of the market is controlled by the top 5 players. However, a multitude of smaller producers and distributors contribute significantly to the overall supply chain.
- Technological Innovation: Technological advancements, including improved extraction techniques (e.g., hydraulic fracturing) and pipeline infrastructure enhancements, are driving production efficiency and market expansion. Barriers to innovation include regulatory hurdles and high capital expenditures.
- Regulatory Frameworks: Federal and state-level regulations significantly impact the natural gas sector, affecting exploration, production, transportation, and distribution. These regulations aim to balance energy security with environmental protection.
- Competitive Substitutes: Natural gas competes with other energy sources like coal, oil, and renewable energy in the power generation and industrial sectors. The competitive landscape is influenced by factors such as price volatility and environmental concerns.
- End-User Demographics: The end-use sector comprises power generation (xx million units), industrial (xx million units), residential (xx million units), and automotive (xx million units). Power generation remains the largest consumer, with industrial demand witnessing steady growth.
- M&A Trends: The US natural gas market has seen substantial M&A activity in recent years, driven by consolidation efforts and strategic acquisitions to expand market share and production capacity. An estimated xx number of deals were completed in the last five years.
US Natural Gas Market Growth Trends & Insights
This section details market size evolution, adoption rates, technological disruptions, and consumer behavior shifts within the US natural gas market. We use comprehensive data analysis to provide a detailed understanding of the market's trajectory. The report will provide a detailed analysis of CAGR and market penetration across various segments and regions. The analysis will also investigate the impact of factors such as government policies, technological advancements, and economic fluctuations on the market's growth.
Dominant Regions, Countries, or Segments in US Natural Gas Market
This section pinpoints the leading regions, countries, or segments driving market growth. The analysis focuses on type (Wet and Dry Natural Gas) and end-use (Power Generation, Automotive, Residential, Industries).
- Dry Natural Gas: The dry natural gas segment dominates the market due to its higher energy density and wider applications in various sectors. xx million units of dry natural gas were consumed in 2024.
- Power Generation: Power generation remains the dominant end-use segment, accounting for the largest share of natural gas consumption due to its affordability and efficiency relative to other energy sources. xx million units were used for power generation in 2024.
- Key Drivers: Abundant domestic reserves, supportive government policies promoting domestic energy production, and growing energy demand are driving market growth.
- Market Share and Growth Potential: The report provides a detailed analysis of the market share held by leading regions, countries, and segments along with their future growth potential.
US Natural Gas Market Product Landscape
The US natural gas market offers a range of products, including conventional natural gas and liquefied natural gas (LNG). Technological advancements in extraction methods, such as hydraulic fracturing, have enhanced production efficiency. LNG exports are growing due to global demand and pipeline infrastructure development. The unique selling propositions of natural gas include its relatively lower carbon emissions compared to coal and its versatility as a fuel source.
Key Drivers, Barriers & Challenges in US Natural Gas Market
Key Drivers: Increased demand for electricity, government incentives for natural gas infrastructure development, and the relatively low cost of natural gas compared to other energy sources are all key drivers.
Challenges: Supply chain disruptions, environmental concerns related to methane emissions, and competition from renewable energy sources pose significant challenges. Regulatory uncertainty and infrastructure limitations also constrain market growth.
Emerging Opportunities in US Natural Gas Market
The US natural gas market presents opportunities in LNG export expansion, the integration of natural gas into the transportation sector (e.g., natural gas vehicles), and the development of new technologies for cleaner natural gas utilization. The growth of industrial applications, especially in sectors such as chemicals and manufacturing, is another area of significant opportunity.
Growth Accelerators in the US Natural Gas Market Industry
Technological breakthroughs in extraction and processing, strategic partnerships between energy companies and infrastructure developers, and the expansion of export markets are key growth accelerators. Investment in new pipeline infrastructure and the development of innovative technologies for carbon capture and storage will further propel market growth.
Key Players Shaping the US Natural Gas Market Market
- Occidental Petroleum Corporation
- Shell PLC
- ExxonMobil Corporation
- Marathon Petroleum Corporation
- Hess Corporation
- ConocoPhillips
- Chevron Corporation
- TotalEnergies SE
- Phillips 66
- EOG Resources Inc
Notable Milestones in US Natural Gas Market Sector
- May 2022: The US Energy Information Administration updated the Natural Gas Pipeline Project Tracker, highlighting FERC's approval of three projects to boost natural gas exports. This includes the Evangeline Pass Expansion Project (1.1 billion cubic feet) and the Plaquemines LNG Project.
- April 2022: TotalEnergies announced the expansion of the Cameron LNG facility in Louisiana, increasing production capacity by 6.75 Mtpa and debottlenecking existing trains for a 5% production boost.
In-Depth US Natural Gas Market Market Outlook
The US natural gas market is poised for continued growth driven by robust domestic production, growing LNG exports, and increasing demand from diverse sectors. Strategic investments in infrastructure development, coupled with technological advancements to enhance efficiency and reduce environmental impact, will further shape the market's trajectory. Opportunities abound for companies that can effectively navigate the evolving regulatory landscape and capitalize on emerging technologies.
US Natural Gas Market Segmentation
-
1. Type
- 1.1. Wet Natural Gas
- 1.2. Dry Natural Gas
-
2. End Use
- 2.1. Power Generation
- 2.2. Automotive
- 2.3. Residential
- 2.4. Industries
US Natural Gas Market Segmentation By Geography
-
1. North America
- 1.1. United States
- 1.2. Canada
- 1.3. Mexico
-
2. South America
- 2.1. Brazil
- 2.2. Argentina
- 2.3. Rest of South America
-
3. Europe
- 3.1. United Kingdom
- 3.2. Germany
- 3.3. France
- 3.4. Italy
- 3.5. Spain
- 3.6. Russia
- 3.7. Benelux
- 3.8. Nordics
- 3.9. Rest of Europe
-
4. Middle East & Africa
- 4.1. Turkey
- 4.2. Israel
- 4.3. GCC
- 4.4. North Africa
- 4.5. South Africa
- 4.6. Rest of Middle East & Africa
-
5. Asia Pacific
- 5.1. China
- 5.2. India
- 5.3. Japan
- 5.4. South Korea
- 5.5. ASEAN
- 5.6. Oceania
- 5.7. Rest of Asia Pacific
US Natural Gas Market Regional Market Share
Geographic Coverage of US Natural Gas Market
US Natural Gas Market REPORT HIGHLIGHTS
| Aspects | Details |
|---|---|
| Study Period | 2020-2034 |
| Base Year | 2025 |
| Estimated Year | 2026 |
| Forecast Period | 2026-2034 |
| Historical Period | 2020-2025 |
| Growth Rate | CAGR of 3.5% from 2020-2034 |
| Segmentation |
|
Table of Contents
- 1. Introduction
- 1.1. Research Scope
- 1.2. Market Segmentation
- 1.3. Research Objective
- 1.4. Definitions and Assumptions
- 2. Executive Summary
- 2.1. Market Snapshot
- 3. Market Dynamics
- 3.1. Market Drivers
- 3.2. Market Restrains
- 3.3. Market Trends
- 3.4. Market Opportunities
- 4. Market Factor Analysis
- 4.1. Porters Five Forces
- 4.1.1. Bargaining Power of Suppliers
- 4.1.2. Bargaining Power of Buyers
- 4.1.3. Threat of New Entrants
- 4.1.4. Threat of Substitutes
- 4.1.5. Competitive Rivalry
- 4.2. PESTEL analysis
- 4.3. BCG Analysis
- 4.3.1. Stars (High Growth, High Market Share)
- 4.3.2. Cash Cows (Low Growth, High Market Share)
- 4.3.3. Question Mark (High Growth, Low Market Share)
- 4.3.4. Dogs (Low Growth, Low Market Share)
- 4.4. Ansoff Matrix Analysis
- 4.5. Supply Chain Analysis
- 4.6. Regulatory Landscape
- 4.7. Current Market Potential and Opportunity Assessment (TAM–SAM–SOM Framework)
- 4.8. NRP Analyst Note
- 4.1. Porters Five Forces
- 5. Market Analysis, Insights and Forecast 2021-2033
- 5.1. Market Analysis, Insights and Forecast - by Type
- 5.1.1. Wet Natural Gas
- 5.1.2. Dry Natural Gas
- 5.2. Market Analysis, Insights and Forecast - by End Use
- 5.2.1. Power Generation
- 5.2.2. Automotive
- 5.2.3. Residential
- 5.2.4. Industries
- 5.3. Market Analysis, Insights and Forecast - by Region
- 5.3.1. North America
- 5.3.2. South America
- 5.3.3. Europe
- 5.3.4. Middle East & Africa
- 5.3.5. Asia Pacific
- 5.1. Market Analysis, Insights and Forecast - by Type
- 6. Global US Natural Gas Market Analysis, Insights and Forecast, 2021-2033
- 6.1. Market Analysis, Insights and Forecast - by Type
- 6.1.1. Wet Natural Gas
- 6.1.2. Dry Natural Gas
- 6.2. Market Analysis, Insights and Forecast - by End Use
- 6.2.1. Power Generation
- 6.2.2. Automotive
- 6.2.3. Residential
- 6.2.4. Industries
- 6.1. Market Analysis, Insights and Forecast - by Type
- 7. North America US Natural Gas Market Analysis, Insights and Forecast, 2020-2032
- 7.1. Market Analysis, Insights and Forecast - by Type
- 7.1.1. Wet Natural Gas
- 7.1.2. Dry Natural Gas
- 7.2. Market Analysis, Insights and Forecast - by End Use
- 7.2.1. Power Generation
- 7.2.2. Automotive
- 7.2.3. Residential
- 7.2.4. Industries
- 7.1. Market Analysis, Insights and Forecast - by Type
- 8. South America US Natural Gas Market Analysis, Insights and Forecast, 2020-2032
- 8.1. Market Analysis, Insights and Forecast - by Type
- 8.1.1. Wet Natural Gas
- 8.1.2. Dry Natural Gas
- 8.2. Market Analysis, Insights and Forecast - by End Use
- 8.2.1. Power Generation
- 8.2.2. Automotive
- 8.2.3. Residential
- 8.2.4. Industries
- 8.1. Market Analysis, Insights and Forecast - by Type
- 9. Europe US Natural Gas Market Analysis, Insights and Forecast, 2020-2032
- 9.1. Market Analysis, Insights and Forecast - by Type
- 9.1.1. Wet Natural Gas
- 9.1.2. Dry Natural Gas
- 9.2. Market Analysis, Insights and Forecast - by End Use
- 9.2.1. Power Generation
- 9.2.2. Automotive
- 9.2.3. Residential
- 9.2.4. Industries
- 9.1. Market Analysis, Insights and Forecast - by Type
- 10. Middle East & Africa US Natural Gas Market Analysis, Insights and Forecast, 2020-2032
- 10.1. Market Analysis, Insights and Forecast - by Type
- 10.1.1. Wet Natural Gas
- 10.1.2. Dry Natural Gas
- 10.2. Market Analysis, Insights and Forecast - by End Use
- 10.2.1. Power Generation
- 10.2.2. Automotive
- 10.2.3. Residential
- 10.2.4. Industries
- 10.1. Market Analysis, Insights and Forecast - by Type
- 11. Asia Pacific US Natural Gas Market Analysis, Insights and Forecast, 2020-2032
- 11.1. Market Analysis, Insights and Forecast - by Type
- 11.1.1. Wet Natural Gas
- 11.1.2. Dry Natural Gas
- 11.2. Market Analysis, Insights and Forecast - by End Use
- 11.2.1. Power Generation
- 11.2.2. Automotive
- 11.2.3. Residential
- 11.2.4. Industries
- 11.1. Market Analysis, Insights and Forecast - by Type
- 12. Competitive Analysis
- 12.1. Company Profiles
- 12.1.1 Occidental Petroleum Corporation
- 12.1.1.1. Company Overview
- 12.1.1.2. Products
- 12.1.1.3. Company Financials
- 12.1.1.4. SWOT Analysis
- 12.1.2 Shell PLC
- 12.1.2.1. Company Overview
- 12.1.2.2. Products
- 12.1.2.3. Company Financials
- 12.1.2.4. SWOT Analysis
- 12.1.3 ExxonMobil Corporation
- 12.1.3.1. Company Overview
- 12.1.3.2. Products
- 12.1.3.3. Company Financials
- 12.1.3.4. SWOT Analysis
- 12.1.4 Marathon Petroleum Corporation
- 12.1.4.1. Company Overview
- 12.1.4.2. Products
- 12.1.4.3. Company Financials
- 12.1.4.4. SWOT Analysis
- 12.1.5 Hess Corporation*List Not Exhaustive
- 12.1.5.1. Company Overview
- 12.1.5.2. Products
- 12.1.5.3. Company Financials
- 12.1.5.4. SWOT Analysis
- 12.1.6 ConocoPhillips
- 12.1.6.1. Company Overview
- 12.1.6.2. Products
- 12.1.6.3. Company Financials
- 12.1.6.4. SWOT Analysis
- 12.1.7 Chevron Corporation
- 12.1.7.1. Company Overview
- 12.1.7.2. Products
- 12.1.7.3. Company Financials
- 12.1.7.4. SWOT Analysis
- 12.1.8 TotalEnergies SE
- 12.1.8.1. Company Overview
- 12.1.8.2. Products
- 12.1.8.3. Company Financials
- 12.1.8.4. SWOT Analysis
- 12.1.9 Phillips
- 12.1.9.1. Company Overview
- 12.1.9.2. Products
- 12.1.9.3. Company Financials
- 12.1.9.4. SWOT Analysis
- 12.1.10 EOG Resources Inc
- 12.1.10.1. Company Overview
- 12.1.10.2. Products
- 12.1.10.3. Company Financials
- 12.1.10.4. SWOT Analysis
- 12.1.1 Occidental Petroleum Corporation
- 12.2. Market Entropy
- 12.2.1 Company's Key Areas Served
- 12.2.2 Recent Developments
- 12.3. Company Market Share Analysis 2025
- 12.3.1 Top 5 Companies Market Share Analysis
- 12.3.2 Top 3 Companies Market Share Analysis
- 12.4. List of Potential Customers
- 13. Research Methodology
List of Figures
- Figure 1: Global US Natural Gas Market Revenue Breakdown (billion, %) by Region 2025 & 2033
- Figure 2: Global US Natural Gas Market Volume Breakdown (Tonnes, %) by Region 2025 & 2033
- Figure 3: North America US Natural Gas Market Revenue (billion), by Type 2025 & 2033
- Figure 4: North America US Natural Gas Market Volume (Tonnes), by Type 2025 & 2033
- Figure 5: North America US Natural Gas Market Revenue Share (%), by Type 2025 & 2033
- Figure 6: North America US Natural Gas Market Volume Share (%), by Type 2025 & 2033
- Figure 7: North America US Natural Gas Market Revenue (billion), by End Use 2025 & 2033
- Figure 8: North America US Natural Gas Market Volume (Tonnes), by End Use 2025 & 2033
- Figure 9: North America US Natural Gas Market Revenue Share (%), by End Use 2025 & 2033
- Figure 10: North America US Natural Gas Market Volume Share (%), by End Use 2025 & 2033
- Figure 11: North America US Natural Gas Market Revenue (billion), by Country 2025 & 2033
- Figure 12: North America US Natural Gas Market Volume (Tonnes), by Country 2025 & 2033
- Figure 13: North America US Natural Gas Market Revenue Share (%), by Country 2025 & 2033
- Figure 14: North America US Natural Gas Market Volume Share (%), by Country 2025 & 2033
- Figure 15: South America US Natural Gas Market Revenue (billion), by Type 2025 & 2033
- Figure 16: South America US Natural Gas Market Volume (Tonnes), by Type 2025 & 2033
- Figure 17: South America US Natural Gas Market Revenue Share (%), by Type 2025 & 2033
- Figure 18: South America US Natural Gas Market Volume Share (%), by Type 2025 & 2033
- Figure 19: South America US Natural Gas Market Revenue (billion), by End Use 2025 & 2033
- Figure 20: South America US Natural Gas Market Volume (Tonnes), by End Use 2025 & 2033
- Figure 21: South America US Natural Gas Market Revenue Share (%), by End Use 2025 & 2033
- Figure 22: South America US Natural Gas Market Volume Share (%), by End Use 2025 & 2033
- Figure 23: South America US Natural Gas Market Revenue (billion), by Country 2025 & 2033
- Figure 24: South America US Natural Gas Market Volume (Tonnes), by Country 2025 & 2033
- Figure 25: South America US Natural Gas Market Revenue Share (%), by Country 2025 & 2033
- Figure 26: South America US Natural Gas Market Volume Share (%), by Country 2025 & 2033
- Figure 27: Europe US Natural Gas Market Revenue (billion), by Type 2025 & 2033
- Figure 28: Europe US Natural Gas Market Volume (Tonnes), by Type 2025 & 2033
- Figure 29: Europe US Natural Gas Market Revenue Share (%), by Type 2025 & 2033
- Figure 30: Europe US Natural Gas Market Volume Share (%), by Type 2025 & 2033
- Figure 31: Europe US Natural Gas Market Revenue (billion), by End Use 2025 & 2033
- Figure 32: Europe US Natural Gas Market Volume (Tonnes), by End Use 2025 & 2033
- Figure 33: Europe US Natural Gas Market Revenue Share (%), by End Use 2025 & 2033
- Figure 34: Europe US Natural Gas Market Volume Share (%), by End Use 2025 & 2033
- Figure 35: Europe US Natural Gas Market Revenue (billion), by Country 2025 & 2033
- Figure 36: Europe US Natural Gas Market Volume (Tonnes), by Country 2025 & 2033
- Figure 37: Europe US Natural Gas Market Revenue Share (%), by Country 2025 & 2033
- Figure 38: Europe US Natural Gas Market Volume Share (%), by Country 2025 & 2033
- Figure 39: Middle East & Africa US Natural Gas Market Revenue (billion), by Type 2025 & 2033
- Figure 40: Middle East & Africa US Natural Gas Market Volume (Tonnes), by Type 2025 & 2033
- Figure 41: Middle East & Africa US Natural Gas Market Revenue Share (%), by Type 2025 & 2033
- Figure 42: Middle East & Africa US Natural Gas Market Volume Share (%), by Type 2025 & 2033
- Figure 43: Middle East & Africa US Natural Gas Market Revenue (billion), by End Use 2025 & 2033
- Figure 44: Middle East & Africa US Natural Gas Market Volume (Tonnes), by End Use 2025 & 2033
- Figure 45: Middle East & Africa US Natural Gas Market Revenue Share (%), by End Use 2025 & 2033
- Figure 46: Middle East & Africa US Natural Gas Market Volume Share (%), by End Use 2025 & 2033
- Figure 47: Middle East & Africa US Natural Gas Market Revenue (billion), by Country 2025 & 2033
- Figure 48: Middle East & Africa US Natural Gas Market Volume (Tonnes), by Country 2025 & 2033
- Figure 49: Middle East & Africa US Natural Gas Market Revenue Share (%), by Country 2025 & 2033
- Figure 50: Middle East & Africa US Natural Gas Market Volume Share (%), by Country 2025 & 2033
- Figure 51: Asia Pacific US Natural Gas Market Revenue (billion), by Type 2025 & 2033
- Figure 52: Asia Pacific US Natural Gas Market Volume (Tonnes), by Type 2025 & 2033
- Figure 53: Asia Pacific US Natural Gas Market Revenue Share (%), by Type 2025 & 2033
- Figure 54: Asia Pacific US Natural Gas Market Volume Share (%), by Type 2025 & 2033
- Figure 55: Asia Pacific US Natural Gas Market Revenue (billion), by End Use 2025 & 2033
- Figure 56: Asia Pacific US Natural Gas Market Volume (Tonnes), by End Use 2025 & 2033
- Figure 57: Asia Pacific US Natural Gas Market Revenue Share (%), by End Use 2025 & 2033
- Figure 58: Asia Pacific US Natural Gas Market Volume Share (%), by End Use 2025 & 2033
- Figure 59: Asia Pacific US Natural Gas Market Revenue (billion), by Country 2025 & 2033
- Figure 60: Asia Pacific US Natural Gas Market Volume (Tonnes), by Country 2025 & 2033
- Figure 61: Asia Pacific US Natural Gas Market Revenue Share (%), by Country 2025 & 2033
- Figure 62: Asia Pacific US Natural Gas Market Volume Share (%), by Country 2025 & 2033
List of Tables
- Table 1: Global US Natural Gas Market Revenue billion Forecast, by Type 2020 & 2033
- Table 2: Global US Natural Gas Market Volume Tonnes Forecast, by Type 2020 & 2033
- Table 3: Global US Natural Gas Market Revenue billion Forecast, by End Use 2020 & 2033
- Table 4: Global US Natural Gas Market Volume Tonnes Forecast, by End Use 2020 & 2033
- Table 5: Global US Natural Gas Market Revenue billion Forecast, by Region 2020 & 2033
- Table 6: Global US Natural Gas Market Volume Tonnes Forecast, by Region 2020 & 2033
- Table 7: Global US Natural Gas Market Revenue billion Forecast, by Type 2020 & 2033
- Table 8: Global US Natural Gas Market Volume Tonnes Forecast, by Type 2020 & 2033
- Table 9: Global US Natural Gas Market Revenue billion Forecast, by End Use 2020 & 2033
- Table 10: Global US Natural Gas Market Volume Tonnes Forecast, by End Use 2020 & 2033
- Table 11: Global US Natural Gas Market Revenue billion Forecast, by Country 2020 & 2033
- Table 12: Global US Natural Gas Market Volume Tonnes Forecast, by Country 2020 & 2033
- Table 13: United States US Natural Gas Market Revenue (billion) Forecast, by Application 2020 & 2033
- Table 14: United States US Natural Gas Market Volume (Tonnes) Forecast, by Application 2020 & 2033
- Table 15: Canada US Natural Gas Market Revenue (billion) Forecast, by Application 2020 & 2033
- Table 16: Canada US Natural Gas Market Volume (Tonnes) Forecast, by Application 2020 & 2033
- Table 17: Mexico US Natural Gas Market Revenue (billion) Forecast, by Application 2020 & 2033
- Table 18: Mexico US Natural Gas Market Volume (Tonnes) Forecast, by Application 2020 & 2033
- Table 19: Global US Natural Gas Market Revenue billion Forecast, by Type 2020 & 2033
- Table 20: Global US Natural Gas Market Volume Tonnes Forecast, by Type 2020 & 2033
- Table 21: Global US Natural Gas Market Revenue billion Forecast, by End Use 2020 & 2033
- Table 22: Global US Natural Gas Market Volume Tonnes Forecast, by End Use 2020 & 2033
- Table 23: Global US Natural Gas Market Revenue billion Forecast, by Country 2020 & 2033
- Table 24: Global US Natural Gas Market Volume Tonnes Forecast, by Country 2020 & 2033
- Table 25: Brazil US Natural Gas Market Revenue (billion) Forecast, by Application 2020 & 2033
- Table 26: Brazil US Natural Gas Market Volume (Tonnes) Forecast, by Application 2020 & 2033
- Table 27: Argentina US Natural Gas Market Revenue (billion) Forecast, by Application 2020 & 2033
- Table 28: Argentina US Natural Gas Market Volume (Tonnes) Forecast, by Application 2020 & 2033
- Table 29: Rest of South America US Natural Gas Market Revenue (billion) Forecast, by Application 2020 & 2033
- Table 30: Rest of South America US Natural Gas Market Volume (Tonnes) Forecast, by Application 2020 & 2033
- Table 31: Global US Natural Gas Market Revenue billion Forecast, by Type 2020 & 2033
- Table 32: Global US Natural Gas Market Volume Tonnes Forecast, by Type 2020 & 2033
- Table 33: Global US Natural Gas Market Revenue billion Forecast, by End Use 2020 & 2033
- Table 34: Global US Natural Gas Market Volume Tonnes Forecast, by End Use 2020 & 2033
- Table 35: Global US Natural Gas Market Revenue billion Forecast, by Country 2020 & 2033
- Table 36: Global US Natural Gas Market Volume Tonnes Forecast, by Country 2020 & 2033
- Table 37: United Kingdom US Natural Gas Market Revenue (billion) Forecast, by Application 2020 & 2033
- Table 38: United Kingdom US Natural Gas Market Volume (Tonnes) Forecast, by Application 2020 & 2033
- Table 39: Germany US Natural Gas Market Revenue (billion) Forecast, by Application 2020 & 2033
- Table 40: Germany US Natural Gas Market Volume (Tonnes) Forecast, by Application 2020 & 2033
- Table 41: France US Natural Gas Market Revenue (billion) Forecast, by Application 2020 & 2033
- Table 42: France US Natural Gas Market Volume (Tonnes) Forecast, by Application 2020 & 2033
- Table 43: Italy US Natural Gas Market Revenue (billion) Forecast, by Application 2020 & 2033
- Table 44: Italy US Natural Gas Market Volume (Tonnes) Forecast, by Application 2020 & 2033
- Table 45: Spain US Natural Gas Market Revenue (billion) Forecast, by Application 2020 & 2033
- Table 46: Spain US Natural Gas Market Volume (Tonnes) Forecast, by Application 2020 & 2033
- Table 47: Russia US Natural Gas Market Revenue (billion) Forecast, by Application 2020 & 2033
- Table 48: Russia US Natural Gas Market Volume (Tonnes) Forecast, by Application 2020 & 2033
- Table 49: Benelux US Natural Gas Market Revenue (billion) Forecast, by Application 2020 & 2033
- Table 50: Benelux US Natural Gas Market Volume (Tonnes) Forecast, by Application 2020 & 2033
- Table 51: Nordics US Natural Gas Market Revenue (billion) Forecast, by Application 2020 & 2033
- Table 52: Nordics US Natural Gas Market Volume (Tonnes) Forecast, by Application 2020 & 2033
- Table 53: Rest of Europe US Natural Gas Market Revenue (billion) Forecast, by Application 2020 & 2033
- Table 54: Rest of Europe US Natural Gas Market Volume (Tonnes) Forecast, by Application 2020 & 2033
- Table 55: Global US Natural Gas Market Revenue billion Forecast, by Type 2020 & 2033
- Table 56: Global US Natural Gas Market Volume Tonnes Forecast, by Type 2020 & 2033
- Table 57: Global US Natural Gas Market Revenue billion Forecast, by End Use 2020 & 2033
- Table 58: Global US Natural Gas Market Volume Tonnes Forecast, by End Use 2020 & 2033
- Table 59: Global US Natural Gas Market Revenue billion Forecast, by Country 2020 & 2033
- Table 60: Global US Natural Gas Market Volume Tonnes Forecast, by Country 2020 & 2033
- Table 61: Turkey US Natural Gas Market Revenue (billion) Forecast, by Application 2020 & 2033
- Table 62: Turkey US Natural Gas Market Volume (Tonnes) Forecast, by Application 2020 & 2033
- Table 63: Israel US Natural Gas Market Revenue (billion) Forecast, by Application 2020 & 2033
- Table 64: Israel US Natural Gas Market Volume (Tonnes) Forecast, by Application 2020 & 2033
- Table 65: GCC US Natural Gas Market Revenue (billion) Forecast, by Application 2020 & 2033
- Table 66: GCC US Natural Gas Market Volume (Tonnes) Forecast, by Application 2020 & 2033
- Table 67: North Africa US Natural Gas Market Revenue (billion) Forecast, by Application 2020 & 2033
- Table 68: North Africa US Natural Gas Market Volume (Tonnes) Forecast, by Application 2020 & 2033
- Table 69: South Africa US Natural Gas Market Revenue (billion) Forecast, by Application 2020 & 2033
- Table 70: South Africa US Natural Gas Market Volume (Tonnes) Forecast, by Application 2020 & 2033
- Table 71: Rest of Middle East & Africa US Natural Gas Market Revenue (billion) Forecast, by Application 2020 & 2033
- Table 72: Rest of Middle East & Africa US Natural Gas Market Volume (Tonnes) Forecast, by Application 2020 & 2033
- Table 73: Global US Natural Gas Market Revenue billion Forecast, by Type 2020 & 2033
- Table 74: Global US Natural Gas Market Volume Tonnes Forecast, by Type 2020 & 2033
- Table 75: Global US Natural Gas Market Revenue billion Forecast, by End Use 2020 & 2033
- Table 76: Global US Natural Gas Market Volume Tonnes Forecast, by End Use 2020 & 2033
- Table 77: Global US Natural Gas Market Revenue billion Forecast, by Country 2020 & 2033
- Table 78: Global US Natural Gas Market Volume Tonnes Forecast, by Country 2020 & 2033
- Table 79: China US Natural Gas Market Revenue (billion) Forecast, by Application 2020 & 2033
- Table 80: China US Natural Gas Market Volume (Tonnes) Forecast, by Application 2020 & 2033
- Table 81: India US Natural Gas Market Revenue (billion) Forecast, by Application 2020 & 2033
- Table 82: India US Natural Gas Market Volume (Tonnes) Forecast, by Application 2020 & 2033
- Table 83: Japan US Natural Gas Market Revenue (billion) Forecast, by Application 2020 & 2033
- Table 84: Japan US Natural Gas Market Volume (Tonnes) Forecast, by Application 2020 & 2033
- Table 85: South Korea US Natural Gas Market Revenue (billion) Forecast, by Application 2020 & 2033
- Table 86: South Korea US Natural Gas Market Volume (Tonnes) Forecast, by Application 2020 & 2033
- Table 87: ASEAN US Natural Gas Market Revenue (billion) Forecast, by Application 2020 & 2033
- Table 88: ASEAN US Natural Gas Market Volume (Tonnes) Forecast, by Application 2020 & 2033
- Table 89: Oceania US Natural Gas Market Revenue (billion) Forecast, by Application 2020 & 2033
- Table 90: Oceania US Natural Gas Market Volume (Tonnes) Forecast, by Application 2020 & 2033
- Table 91: Rest of Asia Pacific US Natural Gas Market Revenue (billion) Forecast, by Application 2020 & 2033
- Table 92: Rest of Asia Pacific US Natural Gas Market Volume (Tonnes) Forecast, by Application 2020 & 2033
Frequently Asked Questions
1. What is the projected Compound Annual Growth Rate (CAGR) of the US Natural Gas Market?
The projected CAGR is approximately 3.5%.
2. Which companies are prominent players in the US Natural Gas Market?
Key companies in the market include Occidental Petroleum Corporation, Shell PLC, ExxonMobil Corporation, Marathon Petroleum Corporation, Hess Corporation*List Not Exhaustive, ConocoPhillips, Chevron Corporation, TotalEnergies SE, Phillips, EOG Resources Inc.
3. What are the main segments of the US Natural Gas Market?
The market segments include Type, End Use.
4. Can you provide details about the market size?
The market size is estimated to be USD 473.4 billion as of 2022.
5. What are some drivers contributing to market growth?
Increasing Global Demand for Refined Petroleum Products4.; Economic Growth and Industrialization.
6. What are the notable trends driving market growth?
Power Generation Segment to Dominate the Market.
7. Are there any restraints impacting market growth?
Environmental Concerns and Regulations.
8. Can you provide examples of recent developments in the market?
May 2022: According to the US Energy Information Administration, the Natural Gas Pipeline Project Tracker was updated with recent approvals and completions of pipeline projects. As of the end of the first quarter of 2022, the Federal Energy Regulatory Commission (FERC) approved three projects to increase the export of US natural gas by pipeline and LNG. FERC approved two projects connecting LNG terminals in Louisiana. The Evangeline Pass Expansion Project, owned by Tennessee Gas Pipeline Company, is 1.1 billion cubic feet in size. It is intended that the proposed Plaquemines LNG Project in Plaquemines Parish, Louisiana, be supplied with natural gas by constructing 13.1 miles of new pipeline and two new compressor stations.
9. What pricing options are available for accessing the report?
Pricing options include single-user, multi-user, and enterprise licenses priced at USD 3800, USD 4500, and USD 5800 respectively.
10. Is the market size provided in terms of value or volume?
The market size is provided in terms of value, measured in billion and volume, measured in Tonnes.
11. Are there any specific market keywords associated with the report?
Yes, the market keyword associated with the report is "US Natural Gas Market," which aids in identifying and referencing the specific market segment covered.
12. How do I determine which pricing option suits my needs best?
The pricing options vary based on user requirements and access needs. Individual users may opt for single-user licenses, while businesses requiring broader access may choose multi-user or enterprise licenses for cost-effective access to the report.
13. Are there any additional resources or data provided in the US Natural Gas Market report?
While the report offers comprehensive insights, it's advisable to review the specific contents or supplementary materials provided to ascertain if additional resources or data are available.
14. How can I stay updated on further developments or reports in the US Natural Gas Market?
To stay informed about further developments, trends, and reports in the US Natural Gas Market, consider subscribing to industry newsletters, following relevant companies and organizations, or regularly checking reputable industry news sources and publications.
Methodology
Step 1 - Identification of Relevant Samples Size from Population Database


Step 2 - Approaches for Defining Global Market Size (Value, Volume* & Price*)

Note*: In applicable scenarios
Step 3 - Data Sources
Primary Research
- Web Analytics
- Survey Reports
- Research Institute
- Latest Research Reports
- Opinion Leaders
Secondary Research
- Annual Reports
- White Paper
- Latest Press Release
- Industry Association
- Paid Database
- Investor Presentations

Step 4 - Data Triangulation
Involves using different sources of information in order to increase the validity of a study
These sources are likely to be stakeholders in a program - participants, other researchers, program staff, other community members, and so on.
Then we put all data in single framework & apply various statistical tools to find out the dynamic on the market.
During the analysis stage, feedback from the stakeholder groups would be compared to determine areas of agreement as well as areas of divergence