

Key Insights
The US oil and gas downstream refining sector, which includes gasoline, diesel, jet fuel, heating oil, and other refined products, is a significant industry projected to grow at a 4.7% CAGR. The market is segmented by product type and end-user industry, with key consumers in transportation, power generation, manufacturing, and residential/commercial sectors. Growth drivers include increasing energy demand from economic recovery and population expansion, particularly within transportation. Challenges include volatile crude oil prices, strict environmental regulations favoring cleaner fuels, and the increasing adoption of electric vehicles impacting gasoline and diesel demand. The current market size is estimated at $474.5 billion in the base year of 2025. Considering the ongoing energy transition, the industry anticipates moderate growth, with segments like jet fuel and heavy-duty diesel remaining strong in the short term. Regional demand varies across the US, influenced by population density and industrial activity.
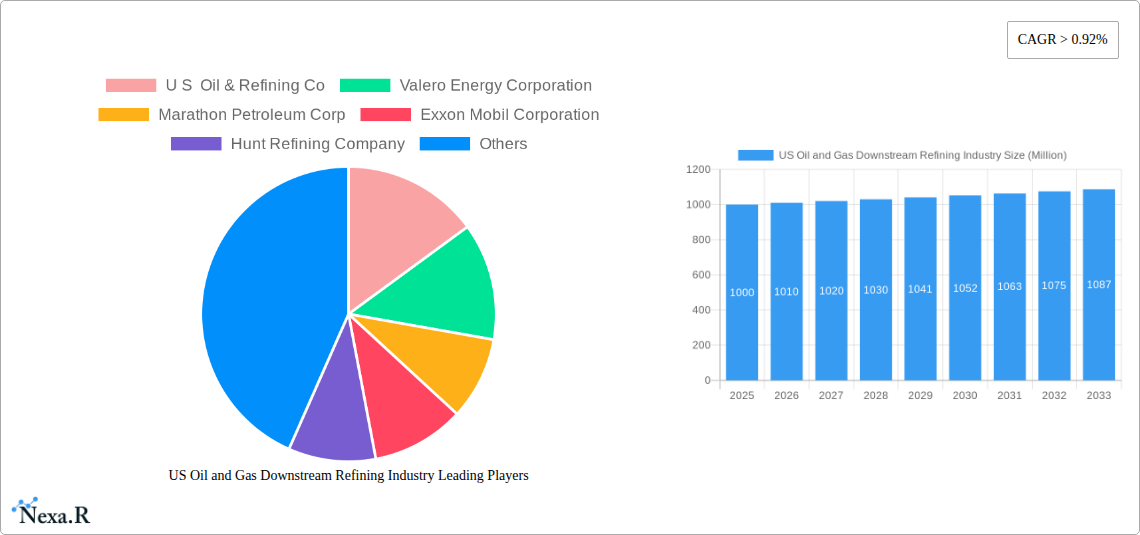
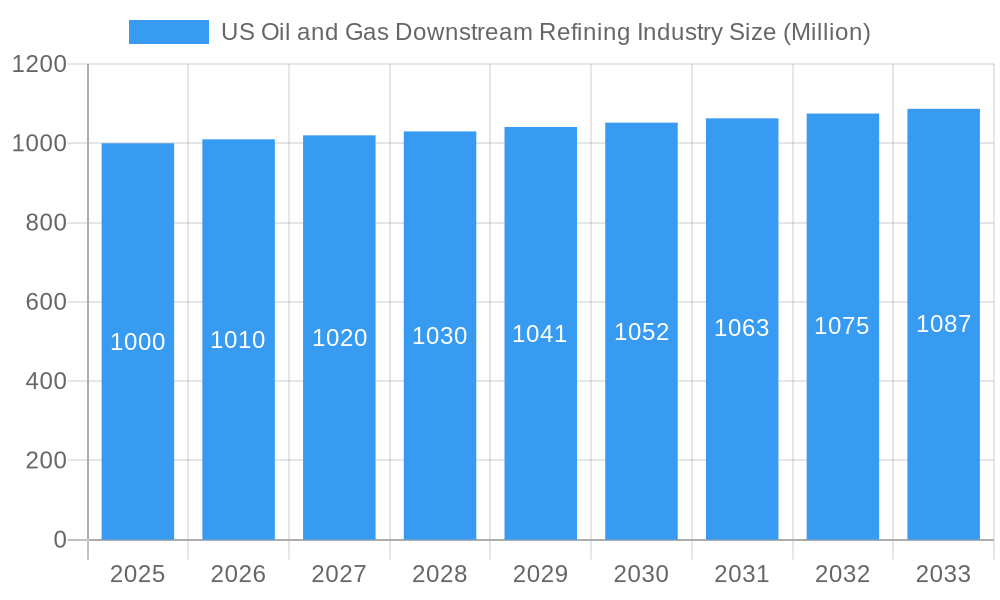
US Oil and Gas Downstream Refining Industry Market Size (In Billion)
Key market participants such as Exxon Mobil Corporation, Valero Energy Corporation, Marathon Petroleum Corp, and Phillips 66 hold significant market share due to their extensive refining operations and logistics. The competitive environment features consolidation and mergers aimed at achieving economies of scale and necessary investments for environmental compliance. Future expansion will rely on strategic infrastructure upgrades, technological innovation for efficiency and sustainability, and adaptability to shifting consumer demands and regulatory frameworks. The industry will continue to prioritize operational optimization and the development of lower-carbon products to navigate environmental concerns and maintain market position.
US Oil and Gas Downstream Refining Industry Company Market Share
US Oil and Gas Downstream Refining Industry Market Report: 2019-2033
This comprehensive report provides an in-depth analysis of the US Oil and Gas Downstream Refining industry, offering invaluable insights for industry professionals, investors, and strategic decision-makers. With a focus on market dynamics, growth trends, and future opportunities, this report covers the period from 2019 to 2033, with a base year of 2025. The report meticulously examines key segments – Gasoline, Diesel, Jet Fuel, Heating Oil, and Other Refined Products – across end-user industries including Transportation, Power Generation, Manufacturing, and Residential/Commercial sectors.
Parent Market: US Oil and Gas Industry Child Market: US Downstream Refining Industry
US Oil and Gas Downstream Refining Industry Market Dynamics & Structure
The US downstream refining market is characterized by a moderately concentrated structure, with major players like ExxonMobil Corporation, Marathon Petroleum Corp, and Valero Energy Corporation holding significant market share. Technological innovation, driven by efficiency improvements and emissions reduction mandates, is a key dynamic. Stringent environmental regulations and fluctuating crude oil prices significantly impact the industry's profitability. The competitive landscape is influenced by the availability of substitute fuels (e.g., biofuels) and evolving end-user demands for cleaner energy. Mergers and acquisitions (M&A) activity has been relatively moderate in recent years, with a focus on consolidating operations and optimizing supply chains. The estimated total M&A deal volume between 2019-2024 is estimated at $xx Million.
- Market Concentration: Highly concentrated, with top 5 players holding xx% market share in 2024.
- Technological Innovation: Focus on process optimization, emissions reduction technologies, and renewable fuel integration.
- Regulatory Framework: Subject to stringent environmental regulations impacting operational costs and investment decisions.
- Competitive Substitutes: Growing competition from biofuels and other alternative energy sources.
- End-User Demographics: Shifting transportation patterns and energy consumption habits influence product demand.
- M&A Trends: Consolidation to improve efficiency and market share.
US Oil and Gas Downstream Refining Industry Growth Trends & Insights
The US downstream refining industry experienced a period of fluctuation between 2019 and 2024, influenced by global events and economic shifts. However, a projected Compound Annual Growth Rate (CAGR) of xx% is anticipated between 2025 and 2033, driven by increasing global energy demand and the expansion of refining capacity to meet evolving fuel specifications. Technological disruptions, such as the increasing adoption of renewable fuels and advanced refining processes, will contribute to this growth. Consumer behavior shifts towards more fuel-efficient vehicles will slightly moderate overall demand for certain refined products, but the overall market remains robust. Market penetration of renewable fuels will gradually increase, reaching xx% by 2033.
Dominant Regions, Countries, or Segments in US Oil and Gas Downstream Refining Industry
The Gulf Coast region remains the dominant hub for US downstream refining, due to its proximity to crude oil supplies and established infrastructure. Texas and Louisiana are key states, benefiting from favorable economic policies and access to major transportation networks. Gasoline continues to be the largest segment by volume, followed by diesel fuel. However, the jet fuel segment is projected to experience significant growth, driven by increasing air travel and the integration of sustainable aviation fuels.
- Key Drivers: Favorable regulatory environment, proximity to crude oil sources, robust infrastructure, and economic policies supporting industrial activity.
- Dominance Factors: Economies of scale, efficient supply chains, and access to diverse markets.
- Growth Potential: Investment in infrastructure upgrades and expansion of renewable fuel production will further enhance the region's dominance.
US Oil and Gas Downstream Refining Industry Product Landscape
The product landscape is characterized by a focus on improving fuel efficiency, reducing emissions, and meeting increasingly stringent environmental standards. Innovations include advanced refining processes to produce cleaner fuels, as well as the blending of renewable fuels into conventional products. Key performance metrics include octane rating, sulfur content, and carbon emissions. Companies are increasingly focusing on differentiating their products through enhanced quality and environmental attributes to cater to the evolving needs of the end-user industries.
Key Drivers, Barriers & Challenges in US Oil and Gas Downstream Refining Industry
Key Drivers: Increasing global energy demand, expanding transportation sector, and the growing adoption of renewable fuels are driving the market. Technological advancements in refining processes are improving efficiency and reducing emissions.
Challenges & Restraints: Fluctuations in crude oil prices create significant volatility, along with the increasing regulatory burden around emissions and environmental concerns. Supply chain disruptions and competition from alternative fuels also pose challenges. The impact of these challenges is estimated to result in a xx% reduction in profitability for some companies during periods of high volatility.
Emerging Opportunities in US Oil and Gas Downstream Refining Industry
Emerging opportunities lie in the growing demand for sustainable aviation fuels (SAFs), biofuels, and other renewable alternatives. Investment in carbon capture and storage technologies will be crucial. Furthermore, there's significant potential for growth in the production and distribution of hydrogen, which could disrupt the landscape. Expanding into new markets and exploring strategic partnerships will also shape future opportunities.
Growth Accelerators in the US Oil and Gas Downstream Refining Industry Industry
Technological breakthroughs in refining efficiency and renewable fuel production are key accelerators. Strategic partnerships for securing access to raw materials and expanding distribution networks are equally crucial. Market expansion strategies focused on both domestic and international growth can unlock new opportunities. Furthermore, investments in sustainable practices and carbon reduction initiatives will also drive long-term growth by attracting environmentally conscious investors and consumers.
Key Players Shaping the US Oil and Gas Downstream Refining Industry Market
- U S Oil & Refining Co
- Valero Energy Corporation
- Marathon Petroleum Corp
- Exxon Mobil Corporation
- Hunt Refining Company
- Royal Dutch Shell PLC
- Phillips
Notable Milestones in US Oil and Gas Downstream Refining Industry Sector
- Nov 2022: Chevron acquires full ownership of Beyond6 LLC and its CNG station network, signaling a move towards alternative fuels.
- Jan 2022: Airbus starts manufacturing aircraft in the US, intending to operate on a blend of renewable and conventional jet fuel, driving increased demand for SAFs.
In-Depth US Oil and Gas Downstream Refining Industry Market Outlook
The US downstream refining industry is poised for continued growth, driven by increasing energy demand and the transition to more sustainable fuels. Strategic investments in advanced technologies and partnerships will be essential for success in this dynamic and evolving sector. The growing adoption of renewable fuels and efficient refining processes will shape the future landscape, presenting opportunities for those companies that can adapt and innovate effectively.
US Oil and Gas Downstream Refining Industry Segmentation
- 1. Refining
- 2. Petrochemical
US Oil and Gas Downstream Refining Industry Segmentation By Geography
-
1. North America
- 1.1. United States
- 1.2. Canada
- 1.3. Mexico
-
2. South America
- 2.1. Brazil
- 2.2. Argentina
- 2.3. Rest of South America
-
3. Europe
- 3.1. United Kingdom
- 3.2. Germany
- 3.3. France
- 3.4. Italy
- 3.5. Spain
- 3.6. Russia
- 3.7. Benelux
- 3.8. Nordics
- 3.9. Rest of Europe
-
4. Middle East & Africa
- 4.1. Turkey
- 4.2. Israel
- 4.3. GCC
- 4.4. North Africa
- 4.5. South Africa
- 4.6. Rest of Middle East & Africa
-
5. Asia Pacific
- 5.1. China
- 5.2. India
- 5.3. Japan
- 5.4. South Korea
- 5.5. ASEAN
- 5.6. Oceania
- 5.7. Rest of Asia Pacific
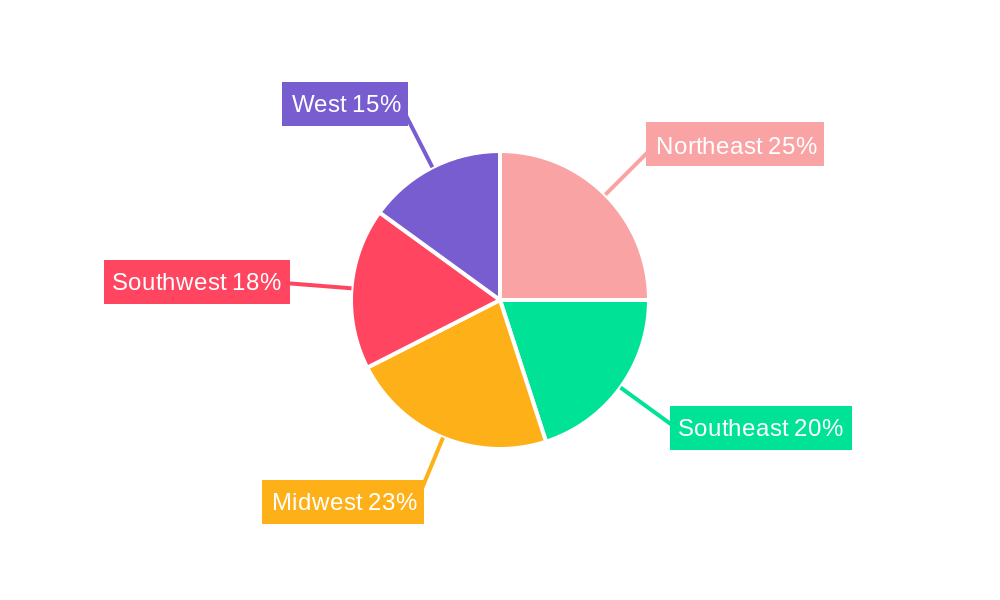
US Oil and Gas Downstream Refining Industry Regional Market Share
Geographic Coverage of US Oil and Gas Downstream Refining Industry
US Oil and Gas Downstream Refining Industry REPORT HIGHLIGHTS
| Aspects | Details |
|---|---|
| Study Period | 2020-2034 |
| Base Year | 2025 |
| Estimated Year | 2026 |
| Forecast Period | 2026-2034 |
| Historical Period | 2020-2025 |
| Growth Rate | CAGR of 4.7% from 2020-2034 |
| Segmentation |
|
Table of Contents
- 1. Introduction
- 1.1. Research Scope
- 1.2. Market Segmentation
- 1.3. Research Methodology
- 1.4. Definitions and Assumptions
- 2. Executive Summary
- 2.1. Introduction
- 3. Market Dynamics
- 3.1. Introduction
- 3.2. Market Drivers
- 3.2.1. Increasing Demand from Various End-user Industries
- 3.3. Market Restrains
- 3.3.1. Higher Capital and Operational Cost
- 3.4. Market Trends
- 3.4.1. Refining Sector to Register a Modest Growth
- 4. Market Factor Analysis
- 4.1. Porters Five Forces
- 4.2. Supply/Value Chain
- 4.3. PESTEL analysis
- 4.4. Market Entropy
- 4.5. Patent/Trademark Analysis
- 5. Global US Oil and Gas Downstream Refining Industry Analysis, Insights and Forecast, 2020-2032
- 5.1. Market Analysis, Insights and Forecast - by Refining
- 5.2. Market Analysis, Insights and Forecast - by Petrochemical
- 5.3. Market Analysis, Insights and Forecast - by Region
- 5.3.1. North America
- 5.3.2. South America
- 5.3.3. Europe
- 5.3.4. Middle East & Africa
- 5.3.5. Asia Pacific
- 5.1. Market Analysis, Insights and Forecast - by Refining
- 6. North America US Oil and Gas Downstream Refining Industry Analysis, Insights and Forecast, 2020-2032
- 6.1. Market Analysis, Insights and Forecast - by Refining
- 6.2. Market Analysis, Insights and Forecast - by Petrochemical
- 6.1. Market Analysis, Insights and Forecast - by Refining
- 7. South America US Oil and Gas Downstream Refining Industry Analysis, Insights and Forecast, 2020-2032
- 7.1. Market Analysis, Insights and Forecast - by Refining
- 7.2. Market Analysis, Insights and Forecast - by Petrochemical
- 7.1. Market Analysis, Insights and Forecast - by Refining
- 8. Europe US Oil and Gas Downstream Refining Industry Analysis, Insights and Forecast, 2020-2032
- 8.1. Market Analysis, Insights and Forecast - by Refining
- 8.2. Market Analysis, Insights and Forecast - by Petrochemical
- 8.1. Market Analysis, Insights and Forecast - by Refining
- 9. Middle East & Africa US Oil and Gas Downstream Refining Industry Analysis, Insights and Forecast, 2020-2032
- 9.1. Market Analysis, Insights and Forecast - by Refining
- 9.2. Market Analysis, Insights and Forecast - by Petrochemical
- 9.1. Market Analysis, Insights and Forecast - by Refining
- 10. Asia Pacific US Oil and Gas Downstream Refining Industry Analysis, Insights and Forecast, 2020-2032
- 10.1. Market Analysis, Insights and Forecast - by Refining
- 10.2. Market Analysis, Insights and Forecast - by Petrochemical
- 10.1. Market Analysis, Insights and Forecast - by Refining
- 11. Competitive Analysis
- 11.1. Global Market Share Analysis 2025
- 11.2. Company Profiles
- 11.2.1 U S Oil & Refining Co
- 11.2.1.1. Overview
- 11.2.1.2. Products
- 11.2.1.3. SWOT Analysis
- 11.2.1.4. Recent Developments
- 11.2.1.5. Financials (Based on Availability)
- 11.2.2 Valero Energy Corporation
- 11.2.2.1. Overview
- 11.2.2.2. Products
- 11.2.2.3. SWOT Analysis
- 11.2.2.4. Recent Developments
- 11.2.2.5. Financials (Based on Availability)
- 11.2.3 Marathon Petroleum Corp
- 11.2.3.1. Overview
- 11.2.3.2. Products
- 11.2.3.3. SWOT Analysis
- 11.2.3.4. Recent Developments
- 11.2.3.5. Financials (Based on Availability)
- 11.2.4 Exxon Mobil Corporation
- 11.2.4.1. Overview
- 11.2.4.2. Products
- 11.2.4.3. SWOT Analysis
- 11.2.4.4. Recent Developments
- 11.2.4.5. Financials (Based on Availability)
- 11.2.5 Hunt Refining Company
- 11.2.5.1. Overview
- 11.2.5.2. Products
- 11.2.5.3. SWOT Analysis
- 11.2.5.4. Recent Developments
- 11.2.5.5. Financials (Based on Availability)
- 11.2.6 Royal Dutch Shell PLC
- 11.2.6.1. Overview
- 11.2.6.2. Products
- 11.2.6.3. SWOT Analysis
- 11.2.6.4. Recent Developments
- 11.2.6.5. Financials (Based on Availability)
- 11.2.7 Phillips
- 11.2.7.1. Overview
- 11.2.7.2. Products
- 11.2.7.3. SWOT Analysis
- 11.2.7.4. Recent Developments
- 11.2.7.5. Financials (Based on Availability)
- 11.2.1 U S Oil & Refining Co
List of Figures
- Figure 1: Global US Oil and Gas Downstream Refining Industry Revenue Breakdown (billion, %) by Region 2025 & 2033
- Figure 2: Global US Oil and Gas Downstream Refining Industry Volume Breakdown (N, %) by Region 2025 & 2033
- Figure 3: North America US Oil and Gas Downstream Refining Industry Revenue (billion), by Refining 2025 & 2033
- Figure 4: North America US Oil and Gas Downstream Refining Industry Volume (N), by Refining 2025 & 2033
- Figure 5: North America US Oil and Gas Downstream Refining Industry Revenue Share (%), by Refining 2025 & 2033
- Figure 6: North America US Oil and Gas Downstream Refining Industry Volume Share (%), by Refining 2025 & 2033
- Figure 7: North America US Oil and Gas Downstream Refining Industry Revenue (billion), by Petrochemical 2025 & 2033
- Figure 8: North America US Oil and Gas Downstream Refining Industry Volume (N), by Petrochemical 2025 & 2033
- Figure 9: North America US Oil and Gas Downstream Refining Industry Revenue Share (%), by Petrochemical 2025 & 2033
- Figure 10: North America US Oil and Gas Downstream Refining Industry Volume Share (%), by Petrochemical 2025 & 2033
- Figure 11: North America US Oil and Gas Downstream Refining Industry Revenue (billion), by Country 2025 & 2033
- Figure 12: North America US Oil and Gas Downstream Refining Industry Volume (N), by Country 2025 & 2033
- Figure 13: North America US Oil and Gas Downstream Refining Industry Revenue Share (%), by Country 2025 & 2033
- Figure 14: North America US Oil and Gas Downstream Refining Industry Volume Share (%), by Country 2025 & 2033
- Figure 15: South America US Oil and Gas Downstream Refining Industry Revenue (billion), by Refining 2025 & 2033
- Figure 16: South America US Oil and Gas Downstream Refining Industry Volume (N), by Refining 2025 & 2033
- Figure 17: South America US Oil and Gas Downstream Refining Industry Revenue Share (%), by Refining 2025 & 2033
- Figure 18: South America US Oil and Gas Downstream Refining Industry Volume Share (%), by Refining 2025 & 2033
- Figure 19: South America US Oil and Gas Downstream Refining Industry Revenue (billion), by Petrochemical 2025 & 2033
- Figure 20: South America US Oil and Gas Downstream Refining Industry Volume (N), by Petrochemical 2025 & 2033
- Figure 21: South America US Oil and Gas Downstream Refining Industry Revenue Share (%), by Petrochemical 2025 & 2033
- Figure 22: South America US Oil and Gas Downstream Refining Industry Volume Share (%), by Petrochemical 2025 & 2033
- Figure 23: South America US Oil and Gas Downstream Refining Industry Revenue (billion), by Country 2025 & 2033
- Figure 24: South America US Oil and Gas Downstream Refining Industry Volume (N), by Country 2025 & 2033
- Figure 25: South America US Oil and Gas Downstream Refining Industry Revenue Share (%), by Country 2025 & 2033
- Figure 26: South America US Oil and Gas Downstream Refining Industry Volume Share (%), by Country 2025 & 2033
- Figure 27: Europe US Oil and Gas Downstream Refining Industry Revenue (billion), by Refining 2025 & 2033
- Figure 28: Europe US Oil and Gas Downstream Refining Industry Volume (N), by Refining 2025 & 2033
- Figure 29: Europe US Oil and Gas Downstream Refining Industry Revenue Share (%), by Refining 2025 & 2033
- Figure 30: Europe US Oil and Gas Downstream Refining Industry Volume Share (%), by Refining 2025 & 2033
- Figure 31: Europe US Oil and Gas Downstream Refining Industry Revenue (billion), by Petrochemical 2025 & 2033
- Figure 32: Europe US Oil and Gas Downstream Refining Industry Volume (N), by Petrochemical 2025 & 2033
- Figure 33: Europe US Oil and Gas Downstream Refining Industry Revenue Share (%), by Petrochemical 2025 & 2033
- Figure 34: Europe US Oil and Gas Downstream Refining Industry Volume Share (%), by Petrochemical 2025 & 2033
- Figure 35: Europe US Oil and Gas Downstream Refining Industry Revenue (billion), by Country 2025 & 2033
- Figure 36: Europe US Oil and Gas Downstream Refining Industry Volume (N), by Country 2025 & 2033
- Figure 37: Europe US Oil and Gas Downstream Refining Industry Revenue Share (%), by Country 2025 & 2033
- Figure 38: Europe US Oil and Gas Downstream Refining Industry Volume Share (%), by Country 2025 & 2033
- Figure 39: Middle East & Africa US Oil and Gas Downstream Refining Industry Revenue (billion), by Refining 2025 & 2033
- Figure 40: Middle East & Africa US Oil and Gas Downstream Refining Industry Volume (N), by Refining 2025 & 2033
- Figure 41: Middle East & Africa US Oil and Gas Downstream Refining Industry Revenue Share (%), by Refining 2025 & 2033
- Figure 42: Middle East & Africa US Oil and Gas Downstream Refining Industry Volume Share (%), by Refining 2025 & 2033
- Figure 43: Middle East & Africa US Oil and Gas Downstream Refining Industry Revenue (billion), by Petrochemical 2025 & 2033
- Figure 44: Middle East & Africa US Oil and Gas Downstream Refining Industry Volume (N), by Petrochemical 2025 & 2033
- Figure 45: Middle East & Africa US Oil and Gas Downstream Refining Industry Revenue Share (%), by Petrochemical 2025 & 2033
- Figure 46: Middle East & Africa US Oil and Gas Downstream Refining Industry Volume Share (%), by Petrochemical 2025 & 2033
- Figure 47: Middle East & Africa US Oil and Gas Downstream Refining Industry Revenue (billion), by Country 2025 & 2033
- Figure 48: Middle East & Africa US Oil and Gas Downstream Refining Industry Volume (N), by Country 2025 & 2033
- Figure 49: Middle East & Africa US Oil and Gas Downstream Refining Industry Revenue Share (%), by Country 2025 & 2033
- Figure 50: Middle East & Africa US Oil and Gas Downstream Refining Industry Volume Share (%), by Country 2025 & 2033
- Figure 51: Asia Pacific US Oil and Gas Downstream Refining Industry Revenue (billion), by Refining 2025 & 2033
- Figure 52: Asia Pacific US Oil and Gas Downstream Refining Industry Volume (N), by Refining 2025 & 2033
- Figure 53: Asia Pacific US Oil and Gas Downstream Refining Industry Revenue Share (%), by Refining 2025 & 2033
- Figure 54: Asia Pacific US Oil and Gas Downstream Refining Industry Volume Share (%), by Refining 2025 & 2033
- Figure 55: Asia Pacific US Oil and Gas Downstream Refining Industry Revenue (billion), by Petrochemical 2025 & 2033
- Figure 56: Asia Pacific US Oil and Gas Downstream Refining Industry Volume (N), by Petrochemical 2025 & 2033
- Figure 57: Asia Pacific US Oil and Gas Downstream Refining Industry Revenue Share (%), by Petrochemical 2025 & 2033
- Figure 58: Asia Pacific US Oil and Gas Downstream Refining Industry Volume Share (%), by Petrochemical 2025 & 2033
- Figure 59: Asia Pacific US Oil and Gas Downstream Refining Industry Revenue (billion), by Country 2025 & 2033
- Figure 60: Asia Pacific US Oil and Gas Downstream Refining Industry Volume (N), by Country 2025 & 2033
- Figure 61: Asia Pacific US Oil and Gas Downstream Refining Industry Revenue Share (%), by Country 2025 & 2033
- Figure 62: Asia Pacific US Oil and Gas Downstream Refining Industry Volume Share (%), by Country 2025 & 2033
List of Tables
- Table 1: Global US Oil and Gas Downstream Refining Industry Revenue billion Forecast, by Refining 2020 & 2033
- Table 2: Global US Oil and Gas Downstream Refining Industry Volume N Forecast, by Refining 2020 & 2033
- Table 3: Global US Oil and Gas Downstream Refining Industry Revenue billion Forecast, by Petrochemical 2020 & 2033
- Table 4: Global US Oil and Gas Downstream Refining Industry Volume N Forecast, by Petrochemical 2020 & 2033
- Table 5: Global US Oil and Gas Downstream Refining Industry Revenue billion Forecast, by Region 2020 & 2033
- Table 6: Global US Oil and Gas Downstream Refining Industry Volume N Forecast, by Region 2020 & 2033
- Table 7: Global US Oil and Gas Downstream Refining Industry Revenue billion Forecast, by Refining 2020 & 2033
- Table 8: Global US Oil and Gas Downstream Refining Industry Volume N Forecast, by Refining 2020 & 2033
- Table 9: Global US Oil and Gas Downstream Refining Industry Revenue billion Forecast, by Petrochemical 2020 & 2033
- Table 10: Global US Oil and Gas Downstream Refining Industry Volume N Forecast, by Petrochemical 2020 & 2033
- Table 11: Global US Oil and Gas Downstream Refining Industry Revenue billion Forecast, by Country 2020 & 2033
- Table 12: Global US Oil and Gas Downstream Refining Industry Volume N Forecast, by Country 2020 & 2033
- Table 13: United States US Oil and Gas Downstream Refining Industry Revenue (billion) Forecast, by Application 2020 & 2033
- Table 14: United States US Oil and Gas Downstream Refining Industry Volume (N) Forecast, by Application 2020 & 2033
- Table 15: Canada US Oil and Gas Downstream Refining Industry Revenue (billion) Forecast, by Application 2020 & 2033
- Table 16: Canada US Oil and Gas Downstream Refining Industry Volume (N) Forecast, by Application 2020 & 2033
- Table 17: Mexico US Oil and Gas Downstream Refining Industry Revenue (billion) Forecast, by Application 2020 & 2033
- Table 18: Mexico US Oil and Gas Downstream Refining Industry Volume (N) Forecast, by Application 2020 & 2033
- Table 19: Global US Oil and Gas Downstream Refining Industry Revenue billion Forecast, by Refining 2020 & 2033
- Table 20: Global US Oil and Gas Downstream Refining Industry Volume N Forecast, by Refining 2020 & 2033
- Table 21: Global US Oil and Gas Downstream Refining Industry Revenue billion Forecast, by Petrochemical 2020 & 2033
- Table 22: Global US Oil and Gas Downstream Refining Industry Volume N Forecast, by Petrochemical 2020 & 2033
- Table 23: Global US Oil and Gas Downstream Refining Industry Revenue billion Forecast, by Country 2020 & 2033
- Table 24: Global US Oil and Gas Downstream Refining Industry Volume N Forecast, by Country 2020 & 2033
- Table 25: Brazil US Oil and Gas Downstream Refining Industry Revenue (billion) Forecast, by Application 2020 & 2033
- Table 26: Brazil US Oil and Gas Downstream Refining Industry Volume (N) Forecast, by Application 2020 & 2033
- Table 27: Argentina US Oil and Gas Downstream Refining Industry Revenue (billion) Forecast, by Application 2020 & 2033
- Table 28: Argentina US Oil and Gas Downstream Refining Industry Volume (N) Forecast, by Application 2020 & 2033
- Table 29: Rest of South America US Oil and Gas Downstream Refining Industry Revenue (billion) Forecast, by Application 2020 & 2033
- Table 30: Rest of South America US Oil and Gas Downstream Refining Industry Volume (N) Forecast, by Application 2020 & 2033
- Table 31: Global US Oil and Gas Downstream Refining Industry Revenue billion Forecast, by Refining 2020 & 2033
- Table 32: Global US Oil and Gas Downstream Refining Industry Volume N Forecast, by Refining 2020 & 2033
- Table 33: Global US Oil and Gas Downstream Refining Industry Revenue billion Forecast, by Petrochemical 2020 & 2033
- Table 34: Global US Oil and Gas Downstream Refining Industry Volume N Forecast, by Petrochemical 2020 & 2033
- Table 35: Global US Oil and Gas Downstream Refining Industry Revenue billion Forecast, by Country 2020 & 2033
- Table 36: Global US Oil and Gas Downstream Refining Industry Volume N Forecast, by Country 2020 & 2033
- Table 37: United Kingdom US Oil and Gas Downstream Refining Industry Revenue (billion) Forecast, by Application 2020 & 2033
- Table 38: United Kingdom US Oil and Gas Downstream Refining Industry Volume (N) Forecast, by Application 2020 & 2033
- Table 39: Germany US Oil and Gas Downstream Refining Industry Revenue (billion) Forecast, by Application 2020 & 2033
- Table 40: Germany US Oil and Gas Downstream Refining Industry Volume (N) Forecast, by Application 2020 & 2033
- Table 41: France US Oil and Gas Downstream Refining Industry Revenue (billion) Forecast, by Application 2020 & 2033
- Table 42: France US Oil and Gas Downstream Refining Industry Volume (N) Forecast, by Application 2020 & 2033
- Table 43: Italy US Oil and Gas Downstream Refining Industry Revenue (billion) Forecast, by Application 2020 & 2033
- Table 44: Italy US Oil and Gas Downstream Refining Industry Volume (N) Forecast, by Application 2020 & 2033
- Table 45: Spain US Oil and Gas Downstream Refining Industry Revenue (billion) Forecast, by Application 2020 & 2033
- Table 46: Spain US Oil and Gas Downstream Refining Industry Volume (N) Forecast, by Application 2020 & 2033
- Table 47: Russia US Oil and Gas Downstream Refining Industry Revenue (billion) Forecast, by Application 2020 & 2033
- Table 48: Russia US Oil and Gas Downstream Refining Industry Volume (N) Forecast, by Application 2020 & 2033
- Table 49: Benelux US Oil and Gas Downstream Refining Industry Revenue (billion) Forecast, by Application 2020 & 2033
- Table 50: Benelux US Oil and Gas Downstream Refining Industry Volume (N) Forecast, by Application 2020 & 2033
- Table 51: Nordics US Oil and Gas Downstream Refining Industry Revenue (billion) Forecast, by Application 2020 & 2033
- Table 52: Nordics US Oil and Gas Downstream Refining Industry Volume (N) Forecast, by Application 2020 & 2033
- Table 53: Rest of Europe US Oil and Gas Downstream Refining Industry Revenue (billion) Forecast, by Application 2020 & 2033
- Table 54: Rest of Europe US Oil and Gas Downstream Refining Industry Volume (N) Forecast, by Application 2020 & 2033
- Table 55: Global US Oil and Gas Downstream Refining Industry Revenue billion Forecast, by Refining 2020 & 2033
- Table 56: Global US Oil and Gas Downstream Refining Industry Volume N Forecast, by Refining 2020 & 2033
- Table 57: Global US Oil and Gas Downstream Refining Industry Revenue billion Forecast, by Petrochemical 2020 & 2033
- Table 58: Global US Oil and Gas Downstream Refining Industry Volume N Forecast, by Petrochemical 2020 & 2033
- Table 59: Global US Oil and Gas Downstream Refining Industry Revenue billion Forecast, by Country 2020 & 2033
- Table 60: Global US Oil and Gas Downstream Refining Industry Volume N Forecast, by Country 2020 & 2033
- Table 61: Turkey US Oil and Gas Downstream Refining Industry Revenue (billion) Forecast, by Application 2020 & 2033
- Table 62: Turkey US Oil and Gas Downstream Refining Industry Volume (N) Forecast, by Application 2020 & 2033
- Table 63: Israel US Oil and Gas Downstream Refining Industry Revenue (billion) Forecast, by Application 2020 & 2033
- Table 64: Israel US Oil and Gas Downstream Refining Industry Volume (N) Forecast, by Application 2020 & 2033
- Table 65: GCC US Oil and Gas Downstream Refining Industry Revenue (billion) Forecast, by Application 2020 & 2033
- Table 66: GCC US Oil and Gas Downstream Refining Industry Volume (N) Forecast, by Application 2020 & 2033
- Table 67: North Africa US Oil and Gas Downstream Refining Industry Revenue (billion) Forecast, by Application 2020 & 2033
- Table 68: North Africa US Oil and Gas Downstream Refining Industry Volume (N) Forecast, by Application 2020 & 2033
- Table 69: South Africa US Oil and Gas Downstream Refining Industry Revenue (billion) Forecast, by Application 2020 & 2033
- Table 70: South Africa US Oil and Gas Downstream Refining Industry Volume (N) Forecast, by Application 2020 & 2033
- Table 71: Rest of Middle East & Africa US Oil and Gas Downstream Refining Industry Revenue (billion) Forecast, by Application 2020 & 2033
- Table 72: Rest of Middle East & Africa US Oil and Gas Downstream Refining Industry Volume (N) Forecast, by Application 2020 & 2033
- Table 73: Global US Oil and Gas Downstream Refining Industry Revenue billion Forecast, by Refining 2020 & 2033
- Table 74: Global US Oil and Gas Downstream Refining Industry Volume N Forecast, by Refining 2020 & 2033
- Table 75: Global US Oil and Gas Downstream Refining Industry Revenue billion Forecast, by Petrochemical 2020 & 2033
- Table 76: Global US Oil and Gas Downstream Refining Industry Volume N Forecast, by Petrochemical 2020 & 2033
- Table 77: Global US Oil and Gas Downstream Refining Industry Revenue billion Forecast, by Country 2020 & 2033
- Table 78: Global US Oil and Gas Downstream Refining Industry Volume N Forecast, by Country 2020 & 2033
- Table 79: China US Oil and Gas Downstream Refining Industry Revenue (billion) Forecast, by Application 2020 & 2033
- Table 80: China US Oil and Gas Downstream Refining Industry Volume (N) Forecast, by Application 2020 & 2033
- Table 81: India US Oil and Gas Downstream Refining Industry Revenue (billion) Forecast, by Application 2020 & 2033
- Table 82: India US Oil and Gas Downstream Refining Industry Volume (N) Forecast, by Application 2020 & 2033
- Table 83: Japan US Oil and Gas Downstream Refining Industry Revenue (billion) Forecast, by Application 2020 & 2033
- Table 84: Japan US Oil and Gas Downstream Refining Industry Volume (N) Forecast, by Application 2020 & 2033
- Table 85: South Korea US Oil and Gas Downstream Refining Industry Revenue (billion) Forecast, by Application 2020 & 2033
- Table 86: South Korea US Oil and Gas Downstream Refining Industry Volume (N) Forecast, by Application 2020 & 2033
- Table 87: ASEAN US Oil and Gas Downstream Refining Industry Revenue (billion) Forecast, by Application 2020 & 2033
- Table 88: ASEAN US Oil and Gas Downstream Refining Industry Volume (N) Forecast, by Application 2020 & 2033
- Table 89: Oceania US Oil and Gas Downstream Refining Industry Revenue (billion) Forecast, by Application 2020 & 2033
- Table 90: Oceania US Oil and Gas Downstream Refining Industry Volume (N) Forecast, by Application 2020 & 2033
- Table 91: Rest of Asia Pacific US Oil and Gas Downstream Refining Industry Revenue (billion) Forecast, by Application 2020 & 2033
- Table 92: Rest of Asia Pacific US Oil and Gas Downstream Refining Industry Volume (N) Forecast, by Application 2020 & 2033
Frequently Asked Questions
1. What is the projected Compound Annual Growth Rate (CAGR) of the US Oil and Gas Downstream Refining Industry?
The projected CAGR is approximately 4.7%.
2. Which companies are prominent players in the US Oil and Gas Downstream Refining Industry?
Key companies in the market include U S Oil & Refining Co, Valero Energy Corporation, Marathon Petroleum Corp, Exxon Mobil Corporation, Hunt Refining Company, Royal Dutch Shell PLC, Phillips.
3. What are the main segments of the US Oil and Gas Downstream Refining Industry?
The market segments include Refining, Petrochemical.
4. Can you provide details about the market size?
The market size is estimated to be USD 474.5 billion as of 2022.
5. What are some drivers contributing to market growth?
Increasing Demand from Various End-user Industries.
6. What are the notable trends driving market growth?
Refining Sector to Register a Modest Growth.
7. Are there any restraints impacting market growth?
Higher Capital and Operational Cost.
8. Can you provide examples of recent developments in the market?
Nov 2022: Chevron U.S.A. Inc., a subsidiary of Chevron Corporation, announced it had signed an agreement to acquire full ownership of Beyond6 LLC (B6) and its network of 55 compressed natural gas (CNG) stations across the United States from Chevron's current B6 co-owners, a subsidiary of Mercuria Energy Trading and B6 CEO Andrew West.
9. What pricing options are available for accessing the report?
Pricing options include single-user, multi-user, and enterprise licenses priced at USD 3800, USD 4500, and USD 5800 respectively.
10. Is the market size provided in terms of value or volume?
The market size is provided in terms of value, measured in billion and volume, measured in N.
11. Are there any specific market keywords associated with the report?
Yes, the market keyword associated with the report is "US Oil and Gas Downstream Refining Industry," which aids in identifying and referencing the specific market segment covered.
12. How do I determine which pricing option suits my needs best?
The pricing options vary based on user requirements and access needs. Individual users may opt for single-user licenses, while businesses requiring broader access may choose multi-user or enterprise licenses for cost-effective access to the report.
13. Are there any additional resources or data provided in the US Oil and Gas Downstream Refining Industry report?
While the report offers comprehensive insights, it's advisable to review the specific contents or supplementary materials provided to ascertain if additional resources or data are available.
14. How can I stay updated on further developments or reports in the US Oil and Gas Downstream Refining Industry?
To stay informed about further developments, trends, and reports in the US Oil and Gas Downstream Refining Industry, consider subscribing to industry newsletters, following relevant companies and organizations, or regularly checking reputable industry news sources and publications.
Methodology
Step 1 - Identification of Relevant Samples Size from Population Database


Step 2 - Approaches for Defining Global Market Size (Value, Volume* & Price*)

Note*: In applicable scenarios
Step 3 - Data Sources
Primary Research
- Web Analytics
- Survey Reports
- Research Institute
- Latest Research Reports
- Opinion Leaders
Secondary Research
- Annual Reports
- White Paper
- Latest Press Release
- Industry Association
- Paid Database
- Investor Presentations

Step 4 - Data Triangulation
Involves using different sources of information in order to increase the validity of a study
These sources are likely to be stakeholders in a program - participants, other researchers, program staff, other community members, and so on.
Then we put all data in single framework & apply various statistical tools to find out the dynamic on the market.
During the analysis stage, feedback from the stakeholder groups would be compared to determine areas of agreement as well as areas of divergence