

Key Insights
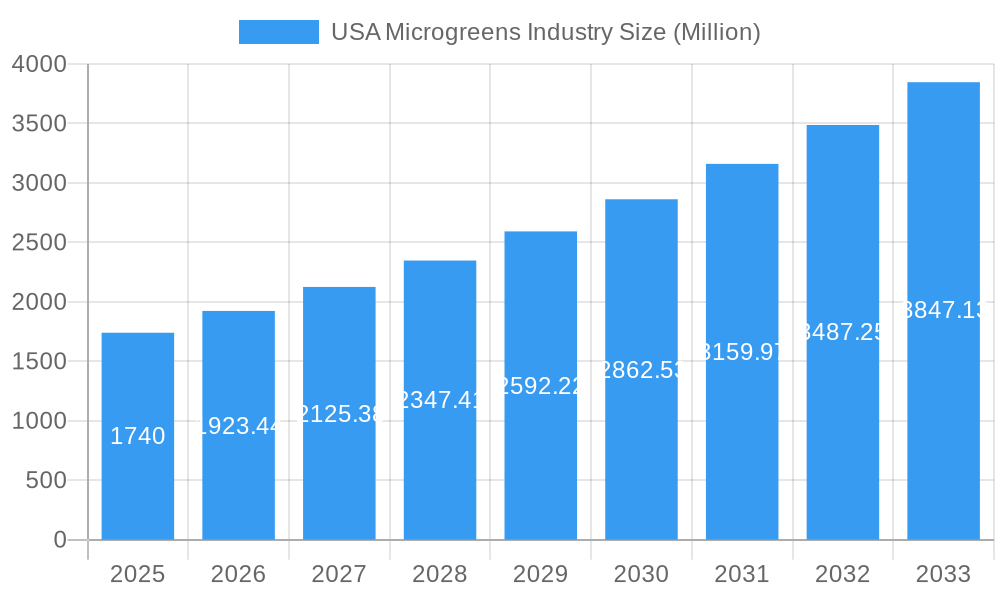
The US microgreens industry, valued at $1.74 billion in 2025, is experiencing robust growth, projected to expand at a compound annual growth rate (CAGR) of 10.60% from 2025 to 2033. This surge is driven by increasing consumer demand for healthy, nutrient-rich foods, fueled by rising awareness of the nutritional benefits of microgreens and their versatility in culinary applications. The expanding food service sector, particularly restaurants embracing innovative menus and health-conscious options, significantly contributes to this growth. Furthermore, the rise of indoor and vertical farming techniques is enhancing production efficiency and year-round availability, overcoming traditional limitations associated with seasonal harvests. Key segments driving market expansion include hypermarkets and supermarkets, which are increasingly incorporating microgreens into their fresh produce sections, and the burgeoning restaurant sector, which leverages microgreens for their aesthetic appeal and nutritional value. Broccoli, lettuce, and chicory remain dominant microgreen types, though the market is witnessing a growing preference for diverse options like basil, fennel, and other specialty varieties.
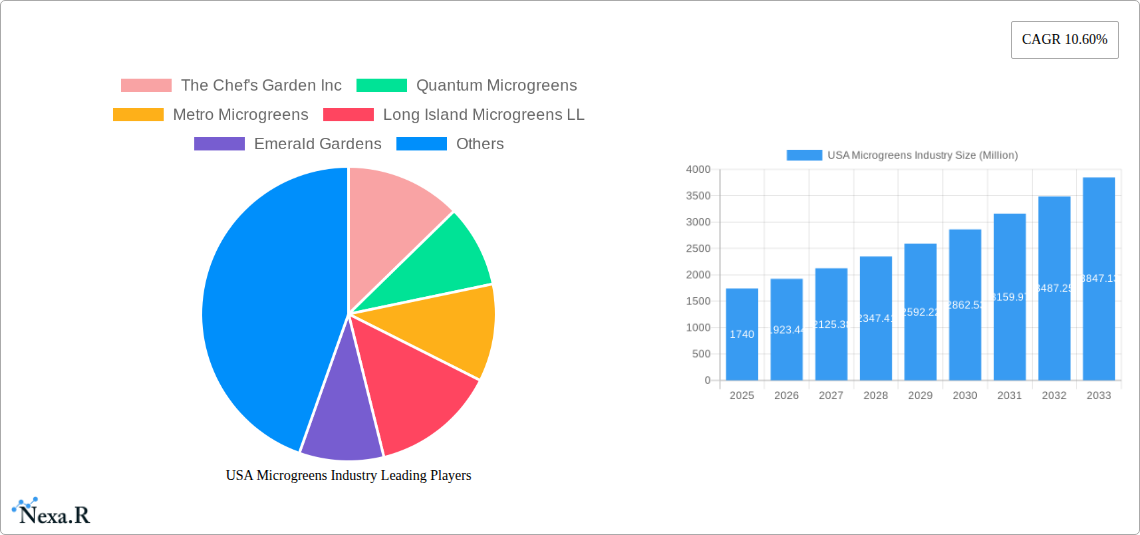
USA Microgreens Industry Market Size (In Billion)
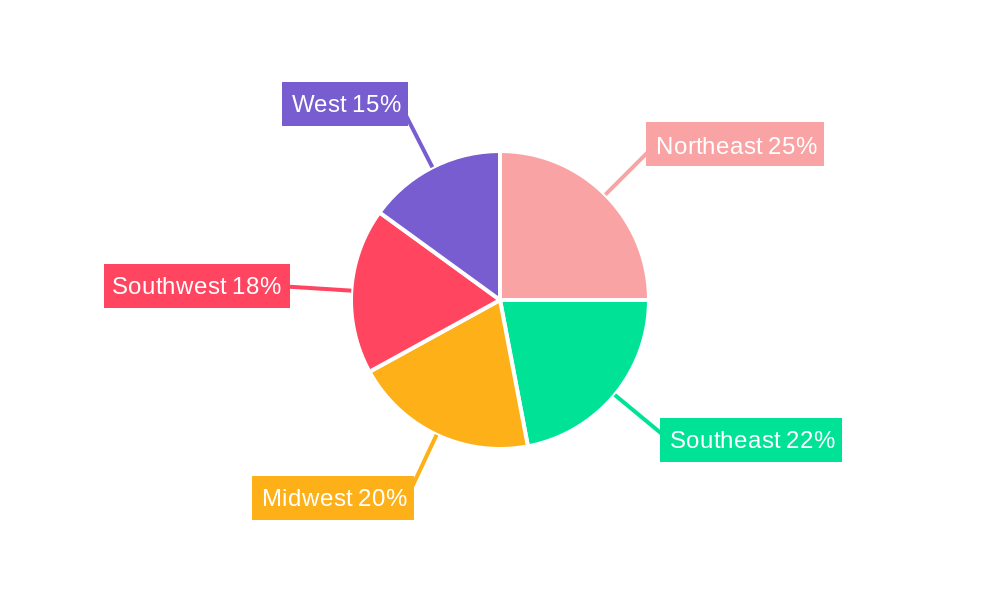
The competitive landscape is dynamic, featuring established players like AeroFarms LLC and The Chef's Garden Inc. alongside smaller, regional producers. The geographic distribution reveals a strong presence across all US regions, with the Northeast, West, and Southeast potentially exhibiting faster growth rates due to higher population density and greater consumer awareness of healthy eating trends. Challenges include managing consistent product quality and minimizing supply chain disruptions, particularly given the relatively short shelf life of microgreens. However, technological advancements in controlled environment agriculture (CEA) are addressing these concerns and paving the way for further market expansion and increased production efficiency. Future growth will hinge on further innovation in cultivation techniques, strategic partnerships across the value chain, and effective consumer education highlighting the nutritional and culinary advantages of microgreens.
USA Microgreens Industry Company Market Share
USA Microgreens Industry Market Report: 2019-2033
This comprehensive report provides an in-depth analysis of the burgeoning USA microgreens industry, offering invaluable insights for industry professionals, investors, and stakeholders. We delve into market dynamics, growth trends, dominant segments, and key players, projecting market evolution from 2019 to 2033. The report utilizes a robust methodology, incorporating both quantitative and qualitative data to deliver actionable intelligence. The base year for this analysis is 2025, with a forecast period spanning 2025-2033 and a historical period covering 2019-2024. Market values are presented in millions of USD.
USA Microgreens Industry Market Dynamics & Structure
The USA microgreens market is characterized by increasing demand driven by growing consumer awareness of health benefits and a preference for locally sourced, fresh produce. Market concentration is currently moderate, with several key players competing alongside numerous smaller regional producers. Technological advancements in vertical farming and aeroponics are significantly impacting production capacity and efficiency. Regulatory frameworks, while generally favorable, vary across states, potentially creating complexities for nationwide operations. Competitive substitutes include conventional leafy greens, sprouts, and other fresh produce. The end-user demographic is broad, encompassing restaurants, supermarkets, and individual consumers. M&A activity in the sector is moderate, with strategic acquisitions driven by expansion goals and technological integration.
- Market Concentration: Moderate, with a few large players and many smaller firms. (Further market share data will be available in the full report).
- Technological Innovation: Rapid advancements in vertical farming and aeroponics are boosting production and year-round availability.
- Regulatory Framework: State-level variations in regulations present both opportunities and challenges for expansion.
- Competitive Substitutes: Conventional leafy greens, sprouts, and other fresh produce offer competition.
- M&A Activity: Moderate activity, primarily driven by strategic expansion and technological acquisition. (Specific deal volume data will be provided in the full report).
- Innovation Barriers: High capital investment for advanced farming technologies, especially in vertical farming.
USA Microgreens Industry Growth Trends & Insights
The USA microgreens market is experiencing robust growth, fueled by escalating consumer demand and technological advancements that enhance production efficiency and scalability. The market has witnessed a significant increase in adoption rates, particularly among health-conscious consumers and restaurants prioritizing fresh, locally-sourced ingredients. Technological disruptions, such as the implementation of automated hydroponic and aeroponic systems, are driving increased productivity and reducing labor costs. Shifting consumer preferences towards healthier and more sustainable food options further underpin market expansion. The CAGR for the historical period (2019-2024) is estimated at xx%, with projections of xx% CAGR during the forecast period (2025-2033). Market penetration is gradually increasing, particularly within the restaurant and supermarket segments. (Further detailed analysis with specific metrics will be in the full report).
Dominant Regions, Countries, or Segments in USA Microgreens Industry
The USA microgreens industry demonstrates regional variations in growth, with key regions such as California, New York, and Texas emerging as significant hubs driven by high consumer demand, favorable climate conditions, and technological innovation in vertical farming.
Sales Channel Dominance: Hypermarkets/supermarkets represent the largest sales channel due to high consumer reach, followed by the restaurant sector, which prioritizes high-quality fresh produce for culinary applications. "Other Channels," encompassing direct-to-consumer sales and smaller retailers, represent a growing segment.
Farming Technique Dominance: Indoor and vertical farming are rapidly gaining traction due to their increased efficiency, reduced land dependency, and potential for controlled environments. Commercial greenhouses retain significance, particularly for established large-scale producers. Other farming techniques remain a niche segment.
Type Dominance: Broccoli, lettuce, and chicory; basil; and radish represent popular microgreen types, demonstrating high demand and adaptability to diverse growing environments. Other types like kale, arugula, and mustard greens are also experiencing considerable growth.
- Key Drivers: Growing consumer awareness of health benefits, rising disposable incomes, expanding restaurant industry, technological advancements in vertical farming, favorable government policies supporting sustainable agriculture.
- Market Share & Growth Potential: The full report will offer detailed market share data for each region and segment, and provide comprehensive growth potential analyses.
USA Microgreens Industry Product Landscape
The USA microgreens market displays a diverse product range, encompassing various types cultivated through different farming techniques. Product innovations focus on enhancing flavor profiles, nutritional value, and shelf life. Hydroponic and aeroponic systems are prevalent, while some producers utilize advanced LED lighting and automation to optimize growth conditions. Unique selling propositions revolve around organically grown, locally sourced microgreens, and innovative packaging designed to maintain freshness.
Key Drivers, Barriers & Challenges in USA Microgreens Industry
Key Drivers: The burgeoning health and wellness sector, increasing consumer preference for fresh produce, technological improvements like automated vertical farming enhancing productivity and consistency, and favorable government support for sustainable agriculture.
Challenges & Restraints: High initial investment costs for advanced farming technologies, competition from established players in the fresh produce market, fluctuating energy prices (particularly relevant for indoor farming), and potential challenges maintaining consistency in product quality and supply chain logistics. (Quantifiable impacts will be provided in the full report).
Emerging Opportunities in USA Microgreens Industry
Untapped markets within the food service sector (e.g., schools, hospitals), expanding online sales channels, innovative product developments focusing on specific health benefits and flavor profiles (e.g., functional microgreens), and partnerships with retailers to promote microgreens as a mainstream food item represent significant opportunities.
Growth Accelerators in the USA Microgreens Industry
Technological advancements, strategic partnerships (e.g., between producers and retailers), and expansion into new geographical markets will act as key growth catalysts in the coming years. Further research into optimizing growing techniques, reducing production costs, and developing novel product applications will also drive market expansion.
Key Players Shaping the USA Microgreens Industry Market
- The Chef's Garden Inc
- Quantum Microgreens
- Metro Microgreens
- Long Island Microgreens LLC
- Emerald Gardens
- Fresh Origins
- Florida Microgreens
- Farmbox Greens LLC
- Arizona Microgreens LLC
- AeroFarms LLC
Notable Milestones in USA Microgreens Industry Sector
- September 2022: AeroFarms establishes the world's largest aeroponic smart farm in Danville, VA, capable of producing over 3 million pounds of leafy greens annually.
- July 2022: AeroFarms expands production at its Pittsylvania County vertical farm to meet growing consumer demand.
- February 2022: Infarm opens a new vertical farming center in Texas, significantly expanding its presence in the region.
In-Depth USA Microgreens Industry Market Outlook
The USA microgreens industry is poised for sustained growth, driven by ongoing technological innovation, increasing consumer awareness, and expanding market applications. Strategic partnerships and market expansion efforts will further fuel this growth, creating significant opportunities for both established players and new entrants. The market is projected to witness substantial expansion, with considerable potential for innovation and diversification in the years to come.
USA Microgreens Industry Segmentation
- 1. Production Analysis
- 2. Consumption Analysis
- 3. Import Market Analysis (Value & Volume)
- 4. Export Market Analysis (Value & Volume)
- 5. Price Trend Analysis
USA Microgreens Industry Segmentation By Geography
-
1. North America
- 1.1. United States
- 1.2. Canada
- 1.3. Mexico
-
2. South America
- 2.1. Brazil
- 2.2. Argentina
- 2.3. Rest of South America
-
3. Europe
- 3.1. United Kingdom
- 3.2. Germany
- 3.3. France
- 3.4. Italy
- 3.5. Spain
- 3.6. Russia
- 3.7. Benelux
- 3.8. Nordics
- 3.9. Rest of Europe
-
4. Middle East & Africa
- 4.1. Turkey
- 4.2. Israel
- 4.3. GCC
- 4.4. North Africa
- 4.5. South Africa
- 4.6. Rest of Middle East & Africa
-
5. Asia Pacific
- 5.1. China
- 5.2. India
- 5.3. Japan
- 5.4. South Korea
- 5.5. ASEAN
- 5.6. Oceania
- 5.7. Rest of Asia Pacific
USA Microgreens Industry Regional Market Share
Geographic Coverage of USA Microgreens Industry
USA Microgreens Industry REPORT HIGHLIGHTS
| Aspects | Details |
|---|---|
| Study Period | 2020-2034 |
| Base Year | 2025 |
| Estimated Year | 2026 |
| Forecast Period | 2026-2034 |
| Historical Period | 2020-2025 |
| Growth Rate | CAGR of 10.60% from 2020-2034 |
| Segmentation |
|
Table of Contents
- 1. Introduction
- 1.1. Research Scope
- 1.2. Market Segmentation
- 1.3. Research Methodology
- 1.4. Definitions and Assumptions
- 2. Executive Summary
- 2.1. Introduction
- 3. Market Dynamics
- 3.1. Introduction
- 3.2. Market Drivers
- 3.2.1. Need for Custom Product Development; Use of CROs for Regulatory Services
- 3.3. Market Restrains
- 3.3.1. Data and Cyber Security Concerns; Lack of Experts and Professionals in this Industry
- 3.4. Market Trends
- 3.4.1. Increased Investments in Vertical Farming Domain
- 4. Market Factor Analysis
- 4.1. Porters Five Forces
- 4.2. Supply/Value Chain
- 4.3. PESTEL analysis
- 4.4. Market Entropy
- 4.5. Patent/Trademark Analysis
- 5. Global USA Microgreens Industry Analysis, Insights and Forecast, 2020-2032
- 5.1. Market Analysis, Insights and Forecast - by Production Analysis
- 5.2. Market Analysis, Insights and Forecast - by Consumption Analysis
- 5.3. Market Analysis, Insights and Forecast - by Import Market Analysis (Value & Volume)
- 5.4. Market Analysis, Insights and Forecast - by Export Market Analysis (Value & Volume)
- 5.5. Market Analysis, Insights and Forecast - by Price Trend Analysis
- 5.6. Market Analysis, Insights and Forecast - by Region
- 5.6.1. North America
- 5.6.2. South America
- 5.6.3. Europe
- 5.6.4. Middle East & Africa
- 5.6.5. Asia Pacific
- 5.1. Market Analysis, Insights and Forecast - by Production Analysis
- 6. North America USA Microgreens Industry Analysis, Insights and Forecast, 2020-2032
- 6.1. Market Analysis, Insights and Forecast - by Production Analysis
- 6.2. Market Analysis, Insights and Forecast - by Consumption Analysis
- 6.3. Market Analysis, Insights and Forecast - by Import Market Analysis (Value & Volume)
- 6.4. Market Analysis, Insights and Forecast - by Export Market Analysis (Value & Volume)
- 6.5. Market Analysis, Insights and Forecast - by Price Trend Analysis
- 6.1. Market Analysis, Insights and Forecast - by Production Analysis
- 7. South America USA Microgreens Industry Analysis, Insights and Forecast, 2020-2032
- 7.1. Market Analysis, Insights and Forecast - by Production Analysis
- 7.2. Market Analysis, Insights and Forecast - by Consumption Analysis
- 7.3. Market Analysis, Insights and Forecast - by Import Market Analysis (Value & Volume)
- 7.4. Market Analysis, Insights and Forecast - by Export Market Analysis (Value & Volume)
- 7.5. Market Analysis, Insights and Forecast - by Price Trend Analysis
- 7.1. Market Analysis, Insights and Forecast - by Production Analysis
- 8. Europe USA Microgreens Industry Analysis, Insights and Forecast, 2020-2032
- 8.1. Market Analysis, Insights and Forecast - by Production Analysis
- 8.2. Market Analysis, Insights and Forecast - by Consumption Analysis
- 8.3. Market Analysis, Insights and Forecast - by Import Market Analysis (Value & Volume)
- 8.4. Market Analysis, Insights and Forecast - by Export Market Analysis (Value & Volume)
- 8.5. Market Analysis, Insights and Forecast - by Price Trend Analysis
- 8.1. Market Analysis, Insights and Forecast - by Production Analysis
- 9. Middle East & Africa USA Microgreens Industry Analysis, Insights and Forecast, 2020-2032
- 9.1. Market Analysis, Insights and Forecast - by Production Analysis
- 9.2. Market Analysis, Insights and Forecast - by Consumption Analysis
- 9.3. Market Analysis, Insights and Forecast - by Import Market Analysis (Value & Volume)
- 9.4. Market Analysis, Insights and Forecast - by Export Market Analysis (Value & Volume)
- 9.5. Market Analysis, Insights and Forecast - by Price Trend Analysis
- 9.1. Market Analysis, Insights and Forecast - by Production Analysis
- 10. Asia Pacific USA Microgreens Industry Analysis, Insights and Forecast, 2020-2032
- 10.1. Market Analysis, Insights and Forecast - by Production Analysis
- 10.2. Market Analysis, Insights and Forecast - by Consumption Analysis
- 10.3. Market Analysis, Insights and Forecast - by Import Market Analysis (Value & Volume)
- 10.4. Market Analysis, Insights and Forecast - by Export Market Analysis (Value & Volume)
- 10.5. Market Analysis, Insights and Forecast - by Price Trend Analysis
- 10.1. Market Analysis, Insights and Forecast - by Production Analysis
- 11. Competitive Analysis
- 11.1. Global Market Share Analysis 2025
- 11.2. Company Profiles
- 11.2.1 The Chef's Garden Inc
- 11.2.1.1. Overview
- 11.2.1.2. Products
- 11.2.1.3. SWOT Analysis
- 11.2.1.4. Recent Developments
- 11.2.1.5. Financials (Based on Availability)
- 11.2.2 Quantum Microgreens
- 11.2.2.1. Overview
- 11.2.2.2. Products
- 11.2.2.3. SWOT Analysis
- 11.2.2.4. Recent Developments
- 11.2.2.5. Financials (Based on Availability)
- 11.2.3 Metro Microgreens
- 11.2.3.1. Overview
- 11.2.3.2. Products
- 11.2.3.3. SWOT Analysis
- 11.2.3.4. Recent Developments
- 11.2.3.5. Financials (Based on Availability)
- 11.2.4 Long Island Microgreens LL
- 11.2.4.1. Overview
- 11.2.4.2. Products
- 11.2.4.3. SWOT Analysis
- 11.2.4.4. Recent Developments
- 11.2.4.5. Financials (Based on Availability)
- 11.2.5 Emerald Gardens
- 11.2.5.1. Overview
- 11.2.5.2. Products
- 11.2.5.3. SWOT Analysis
- 11.2.5.4. Recent Developments
- 11.2.5.5. Financials (Based on Availability)
- 11.2.6 Fresh Origins
- 11.2.6.1. Overview
- 11.2.6.2. Products
- 11.2.6.3. SWOT Analysis
- 11.2.6.4. Recent Developments
- 11.2.6.5. Financials (Based on Availability)
- 11.2.7 Florida Microgreens
- 11.2.7.1. Overview
- 11.2.7.2. Products
- 11.2.7.3. SWOT Analysis
- 11.2.7.4. Recent Developments
- 11.2.7.5. Financials (Based on Availability)
- 11.2.8 Farmbox Greens LLC
- 11.2.8.1. Overview
- 11.2.8.2. Products
- 11.2.8.3. SWOT Analysis
- 11.2.8.4. Recent Developments
- 11.2.8.5. Financials (Based on Availability)
- 11.2.9 Arizona Microgreens LLC
- 11.2.9.1. Overview
- 11.2.9.2. Products
- 11.2.9.3. SWOT Analysis
- 11.2.9.4. Recent Developments
- 11.2.9.5. Financials (Based on Availability)
- 11.2.10 AeroFarms LLC
- 11.2.10.1. Overview
- 11.2.10.2. Products
- 11.2.10.3. SWOT Analysis
- 11.2.10.4. Recent Developments
- 11.2.10.5. Financials (Based on Availability)
- 11.2.1 The Chef's Garden Inc
List of Figures
- Figure 1: Global USA Microgreens Industry Revenue Breakdown (Million, %) by Region 2025 & 2033
- Figure 2: North America USA Microgreens Industry Revenue (Million), by Production Analysis 2025 & 2033
- Figure 3: North America USA Microgreens Industry Revenue Share (%), by Production Analysis 2025 & 2033
- Figure 4: North America USA Microgreens Industry Revenue (Million), by Consumption Analysis 2025 & 2033
- Figure 5: North America USA Microgreens Industry Revenue Share (%), by Consumption Analysis 2025 & 2033
- Figure 6: North America USA Microgreens Industry Revenue (Million), by Import Market Analysis (Value & Volume) 2025 & 2033
- Figure 7: North America USA Microgreens Industry Revenue Share (%), by Import Market Analysis (Value & Volume) 2025 & 2033
- Figure 8: North America USA Microgreens Industry Revenue (Million), by Export Market Analysis (Value & Volume) 2025 & 2033
- Figure 9: North America USA Microgreens Industry Revenue Share (%), by Export Market Analysis (Value & Volume) 2025 & 2033
- Figure 10: North America USA Microgreens Industry Revenue (Million), by Price Trend Analysis 2025 & 2033
- Figure 11: North America USA Microgreens Industry Revenue Share (%), by Price Trend Analysis 2025 & 2033
- Figure 12: North America USA Microgreens Industry Revenue (Million), by Country 2025 & 2033
- Figure 13: North America USA Microgreens Industry Revenue Share (%), by Country 2025 & 2033
- Figure 14: South America USA Microgreens Industry Revenue (Million), by Production Analysis 2025 & 2033
- Figure 15: South America USA Microgreens Industry Revenue Share (%), by Production Analysis 2025 & 2033
- Figure 16: South America USA Microgreens Industry Revenue (Million), by Consumption Analysis 2025 & 2033
- Figure 17: South America USA Microgreens Industry Revenue Share (%), by Consumption Analysis 2025 & 2033
- Figure 18: South America USA Microgreens Industry Revenue (Million), by Import Market Analysis (Value & Volume) 2025 & 2033
- Figure 19: South America USA Microgreens Industry Revenue Share (%), by Import Market Analysis (Value & Volume) 2025 & 2033
- Figure 20: South America USA Microgreens Industry Revenue (Million), by Export Market Analysis (Value & Volume) 2025 & 2033
- Figure 21: South America USA Microgreens Industry Revenue Share (%), by Export Market Analysis (Value & Volume) 2025 & 2033
- Figure 22: South America USA Microgreens Industry Revenue (Million), by Price Trend Analysis 2025 & 2033
- Figure 23: South America USA Microgreens Industry Revenue Share (%), by Price Trend Analysis 2025 & 2033
- Figure 24: South America USA Microgreens Industry Revenue (Million), by Country 2025 & 2033
- Figure 25: South America USA Microgreens Industry Revenue Share (%), by Country 2025 & 2033
- Figure 26: Europe USA Microgreens Industry Revenue (Million), by Production Analysis 2025 & 2033
- Figure 27: Europe USA Microgreens Industry Revenue Share (%), by Production Analysis 2025 & 2033
- Figure 28: Europe USA Microgreens Industry Revenue (Million), by Consumption Analysis 2025 & 2033
- Figure 29: Europe USA Microgreens Industry Revenue Share (%), by Consumption Analysis 2025 & 2033
- Figure 30: Europe USA Microgreens Industry Revenue (Million), by Import Market Analysis (Value & Volume) 2025 & 2033
- Figure 31: Europe USA Microgreens Industry Revenue Share (%), by Import Market Analysis (Value & Volume) 2025 & 2033
- Figure 32: Europe USA Microgreens Industry Revenue (Million), by Export Market Analysis (Value & Volume) 2025 & 2033
- Figure 33: Europe USA Microgreens Industry Revenue Share (%), by Export Market Analysis (Value & Volume) 2025 & 2033
- Figure 34: Europe USA Microgreens Industry Revenue (Million), by Price Trend Analysis 2025 & 2033
- Figure 35: Europe USA Microgreens Industry Revenue Share (%), by Price Trend Analysis 2025 & 2033
- Figure 36: Europe USA Microgreens Industry Revenue (Million), by Country 2025 & 2033
- Figure 37: Europe USA Microgreens Industry Revenue Share (%), by Country 2025 & 2033
- Figure 38: Middle East & Africa USA Microgreens Industry Revenue (Million), by Production Analysis 2025 & 2033
- Figure 39: Middle East & Africa USA Microgreens Industry Revenue Share (%), by Production Analysis 2025 & 2033
- Figure 40: Middle East & Africa USA Microgreens Industry Revenue (Million), by Consumption Analysis 2025 & 2033
- Figure 41: Middle East & Africa USA Microgreens Industry Revenue Share (%), by Consumption Analysis 2025 & 2033
- Figure 42: Middle East & Africa USA Microgreens Industry Revenue (Million), by Import Market Analysis (Value & Volume) 2025 & 2033
- Figure 43: Middle East & Africa USA Microgreens Industry Revenue Share (%), by Import Market Analysis (Value & Volume) 2025 & 2033
- Figure 44: Middle East & Africa USA Microgreens Industry Revenue (Million), by Export Market Analysis (Value & Volume) 2025 & 2033
- Figure 45: Middle East & Africa USA Microgreens Industry Revenue Share (%), by Export Market Analysis (Value & Volume) 2025 & 2033
- Figure 46: Middle East & Africa USA Microgreens Industry Revenue (Million), by Price Trend Analysis 2025 & 2033
- Figure 47: Middle East & Africa USA Microgreens Industry Revenue Share (%), by Price Trend Analysis 2025 & 2033
- Figure 48: Middle East & Africa USA Microgreens Industry Revenue (Million), by Country 2025 & 2033
- Figure 49: Middle East & Africa USA Microgreens Industry Revenue Share (%), by Country 2025 & 2033
- Figure 50: Asia Pacific USA Microgreens Industry Revenue (Million), by Production Analysis 2025 & 2033
- Figure 51: Asia Pacific USA Microgreens Industry Revenue Share (%), by Production Analysis 2025 & 2033
- Figure 52: Asia Pacific USA Microgreens Industry Revenue (Million), by Consumption Analysis 2025 & 2033
- Figure 53: Asia Pacific USA Microgreens Industry Revenue Share (%), by Consumption Analysis 2025 & 2033
- Figure 54: Asia Pacific USA Microgreens Industry Revenue (Million), by Import Market Analysis (Value & Volume) 2025 & 2033
- Figure 55: Asia Pacific USA Microgreens Industry Revenue Share (%), by Import Market Analysis (Value & Volume) 2025 & 2033
- Figure 56: Asia Pacific USA Microgreens Industry Revenue (Million), by Export Market Analysis (Value & Volume) 2025 & 2033
- Figure 57: Asia Pacific USA Microgreens Industry Revenue Share (%), by Export Market Analysis (Value & Volume) 2025 & 2033
- Figure 58: Asia Pacific USA Microgreens Industry Revenue (Million), by Price Trend Analysis 2025 & 2033
- Figure 59: Asia Pacific USA Microgreens Industry Revenue Share (%), by Price Trend Analysis 2025 & 2033
- Figure 60: Asia Pacific USA Microgreens Industry Revenue (Million), by Country 2025 & 2033
- Figure 61: Asia Pacific USA Microgreens Industry Revenue Share (%), by Country 2025 & 2033
List of Tables
- Table 1: Global USA Microgreens Industry Revenue Million Forecast, by Production Analysis 2020 & 2033
- Table 2: Global USA Microgreens Industry Revenue Million Forecast, by Consumption Analysis 2020 & 2033
- Table 3: Global USA Microgreens Industry Revenue Million Forecast, by Import Market Analysis (Value & Volume) 2020 & 2033
- Table 4: Global USA Microgreens Industry Revenue Million Forecast, by Export Market Analysis (Value & Volume) 2020 & 2033
- Table 5: Global USA Microgreens Industry Revenue Million Forecast, by Price Trend Analysis 2020 & 2033
- Table 6: Global USA Microgreens Industry Revenue Million Forecast, by Region 2020 & 2033
- Table 7: Global USA Microgreens Industry Revenue Million Forecast, by Production Analysis 2020 & 2033
- Table 8: Global USA Microgreens Industry Revenue Million Forecast, by Consumption Analysis 2020 & 2033
- Table 9: Global USA Microgreens Industry Revenue Million Forecast, by Import Market Analysis (Value & Volume) 2020 & 2033
- Table 10: Global USA Microgreens Industry Revenue Million Forecast, by Export Market Analysis (Value & Volume) 2020 & 2033
- Table 11: Global USA Microgreens Industry Revenue Million Forecast, by Price Trend Analysis 2020 & 2033
- Table 12: Global USA Microgreens Industry Revenue Million Forecast, by Country 2020 & 2033
- Table 13: United States USA Microgreens Industry Revenue (Million) Forecast, by Application 2020 & 2033
- Table 14: Canada USA Microgreens Industry Revenue (Million) Forecast, by Application 2020 & 2033
- Table 15: Mexico USA Microgreens Industry Revenue (Million) Forecast, by Application 2020 & 2033
- Table 16: Global USA Microgreens Industry Revenue Million Forecast, by Production Analysis 2020 & 2033
- Table 17: Global USA Microgreens Industry Revenue Million Forecast, by Consumption Analysis 2020 & 2033
- Table 18: Global USA Microgreens Industry Revenue Million Forecast, by Import Market Analysis (Value & Volume) 2020 & 2033
- Table 19: Global USA Microgreens Industry Revenue Million Forecast, by Export Market Analysis (Value & Volume) 2020 & 2033
- Table 20: Global USA Microgreens Industry Revenue Million Forecast, by Price Trend Analysis 2020 & 2033
- Table 21: Global USA Microgreens Industry Revenue Million Forecast, by Country 2020 & 2033
- Table 22: Brazil USA Microgreens Industry Revenue (Million) Forecast, by Application 2020 & 2033
- Table 23: Argentina USA Microgreens Industry Revenue (Million) Forecast, by Application 2020 & 2033
- Table 24: Rest of South America USA Microgreens Industry Revenue (Million) Forecast, by Application 2020 & 2033
- Table 25: Global USA Microgreens Industry Revenue Million Forecast, by Production Analysis 2020 & 2033
- Table 26: Global USA Microgreens Industry Revenue Million Forecast, by Consumption Analysis 2020 & 2033
- Table 27: Global USA Microgreens Industry Revenue Million Forecast, by Import Market Analysis (Value & Volume) 2020 & 2033
- Table 28: Global USA Microgreens Industry Revenue Million Forecast, by Export Market Analysis (Value & Volume) 2020 & 2033
- Table 29: Global USA Microgreens Industry Revenue Million Forecast, by Price Trend Analysis 2020 & 2033
- Table 30: Global USA Microgreens Industry Revenue Million Forecast, by Country 2020 & 2033
- Table 31: United Kingdom USA Microgreens Industry Revenue (Million) Forecast, by Application 2020 & 2033
- Table 32: Germany USA Microgreens Industry Revenue (Million) Forecast, by Application 2020 & 2033
- Table 33: France USA Microgreens Industry Revenue (Million) Forecast, by Application 2020 & 2033
- Table 34: Italy USA Microgreens Industry Revenue (Million) Forecast, by Application 2020 & 2033
- Table 35: Spain USA Microgreens Industry Revenue (Million) Forecast, by Application 2020 & 2033
- Table 36: Russia USA Microgreens Industry Revenue (Million) Forecast, by Application 2020 & 2033
- Table 37: Benelux USA Microgreens Industry Revenue (Million) Forecast, by Application 2020 & 2033
- Table 38: Nordics USA Microgreens Industry Revenue (Million) Forecast, by Application 2020 & 2033
- Table 39: Rest of Europe USA Microgreens Industry Revenue (Million) Forecast, by Application 2020 & 2033
- Table 40: Global USA Microgreens Industry Revenue Million Forecast, by Production Analysis 2020 & 2033
- Table 41: Global USA Microgreens Industry Revenue Million Forecast, by Consumption Analysis 2020 & 2033
- Table 42: Global USA Microgreens Industry Revenue Million Forecast, by Import Market Analysis (Value & Volume) 2020 & 2033
- Table 43: Global USA Microgreens Industry Revenue Million Forecast, by Export Market Analysis (Value & Volume) 2020 & 2033
- Table 44: Global USA Microgreens Industry Revenue Million Forecast, by Price Trend Analysis 2020 & 2033
- Table 45: Global USA Microgreens Industry Revenue Million Forecast, by Country 2020 & 2033
- Table 46: Turkey USA Microgreens Industry Revenue (Million) Forecast, by Application 2020 & 2033
- Table 47: Israel USA Microgreens Industry Revenue (Million) Forecast, by Application 2020 & 2033
- Table 48: GCC USA Microgreens Industry Revenue (Million) Forecast, by Application 2020 & 2033
- Table 49: North Africa USA Microgreens Industry Revenue (Million) Forecast, by Application 2020 & 2033
- Table 50: South Africa USA Microgreens Industry Revenue (Million) Forecast, by Application 2020 & 2033
- Table 51: Rest of Middle East & Africa USA Microgreens Industry Revenue (Million) Forecast, by Application 2020 & 2033
- Table 52: Global USA Microgreens Industry Revenue Million Forecast, by Production Analysis 2020 & 2033
- Table 53: Global USA Microgreens Industry Revenue Million Forecast, by Consumption Analysis 2020 & 2033
- Table 54: Global USA Microgreens Industry Revenue Million Forecast, by Import Market Analysis (Value & Volume) 2020 & 2033
- Table 55: Global USA Microgreens Industry Revenue Million Forecast, by Export Market Analysis (Value & Volume) 2020 & 2033
- Table 56: Global USA Microgreens Industry Revenue Million Forecast, by Price Trend Analysis 2020 & 2033
- Table 57: Global USA Microgreens Industry Revenue Million Forecast, by Country 2020 & 2033
- Table 58: China USA Microgreens Industry Revenue (Million) Forecast, by Application 2020 & 2033
- Table 59: India USA Microgreens Industry Revenue (Million) Forecast, by Application 2020 & 2033
- Table 60: Japan USA Microgreens Industry Revenue (Million) Forecast, by Application 2020 & 2033
- Table 61: South Korea USA Microgreens Industry Revenue (Million) Forecast, by Application 2020 & 2033
- Table 62: ASEAN USA Microgreens Industry Revenue (Million) Forecast, by Application 2020 & 2033
- Table 63: Oceania USA Microgreens Industry Revenue (Million) Forecast, by Application 2020 & 2033
- Table 64: Rest of Asia Pacific USA Microgreens Industry Revenue (Million) Forecast, by Application 2020 & 2033
Frequently Asked Questions
1. What is the projected Compound Annual Growth Rate (CAGR) of the USA Microgreens Industry?
The projected CAGR is approximately 10.60%.
2. Which companies are prominent players in the USA Microgreens Industry?
Key companies in the market include The Chef's Garden Inc, Quantum Microgreens, Metro Microgreens, Long Island Microgreens LL, Emerald Gardens, Fresh Origins, Florida Microgreens, Farmbox Greens LLC, Arizona Microgreens LLC, AeroFarms LLC.
3. What are the main segments of the USA Microgreens Industry?
The market segments include Production Analysis, Consumption Analysis, Import Market Analysis (Value & Volume), Export Market Analysis (Value & Volume), Price Trend Analysis.
4. Can you provide details about the market size?
The market size is estimated to be USD 1.74 Million as of 2022.
5. What are some drivers contributing to market growth?
Need for Custom Product Development; Use of CROs for Regulatory Services.
6. What are the notable trends driving market growth?
Increased Investments in Vertical Farming Domain.
7. Are there any restraints impacting market growth?
Data and Cyber Security Concerns; Lack of Experts and Professionals in this Industry.
8. Can you provide examples of recent developments in the market?
September 2022: To meet increased customer demand, AeroFarmsDanville VA established the world's largest Aeroponic Smart Farm with the newest Indoor Vertical Farm capable of growing over 3 million lb of fresh leafy greens annually.
9. What pricing options are available for accessing the report?
Pricing options include single-user, multi-user, and enterprise licenses priced at USD 3800, USD 4500, and USD 5800 respectively.
10. Is the market size provided in terms of value or volume?
The market size is provided in terms of value, measured in Million.
11. Are there any specific market keywords associated with the report?
Yes, the market keyword associated with the report is "USA Microgreens Industry," which aids in identifying and referencing the specific market segment covered.
12. How do I determine which pricing option suits my needs best?
The pricing options vary based on user requirements and access needs. Individual users may opt for single-user licenses, while businesses requiring broader access may choose multi-user or enterprise licenses for cost-effective access to the report.
13. Are there any additional resources or data provided in the USA Microgreens Industry report?
While the report offers comprehensive insights, it's advisable to review the specific contents or supplementary materials provided to ascertain if additional resources or data are available.
14. How can I stay updated on further developments or reports in the USA Microgreens Industry?
To stay informed about further developments, trends, and reports in the USA Microgreens Industry, consider subscribing to industry newsletters, following relevant companies and organizations, or regularly checking reputable industry news sources and publications.
Methodology
Step 1 - Identification of Relevant Samples Size from Population Database


Step 2 - Approaches for Defining Global Market Size (Value, Volume* & Price*)

Note*: In applicable scenarios
Step 3 - Data Sources
Primary Research
- Web Analytics
- Survey Reports
- Research Institute
- Latest Research Reports
- Opinion Leaders
Secondary Research
- Annual Reports
- White Paper
- Latest Press Release
- Industry Association
- Paid Database
- Investor Presentations

Step 4 - Data Triangulation
Involves using different sources of information in order to increase the validity of a study
These sources are likely to be stakeholders in a program - participants, other researchers, program staff, other community members, and so on.
Then we put all data in single framework & apply various statistical tools to find out the dynamic on the market.
During the analysis stage, feedback from the stakeholder groups would be compared to determine areas of agreement as well as areas of divergence