

Key Insights
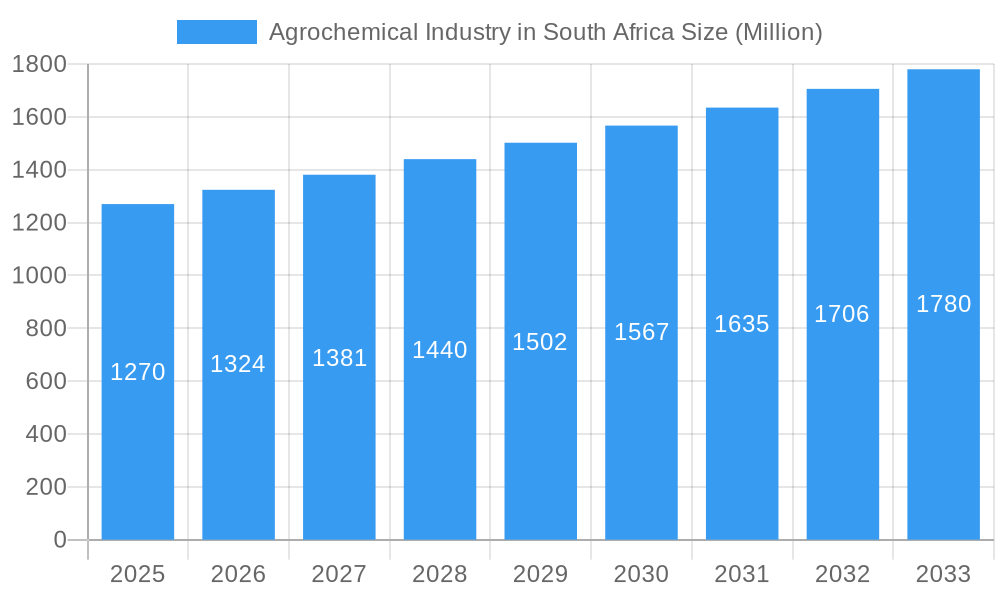
The South African agrochemical market, valued at approximately $1.27 billion in 2025, is projected to experience steady growth, driven by factors such as increasing agricultural output to meet food security demands, rising adoption of modern farming techniques, and government initiatives promoting agricultural development. The market's Compound Annual Growth Rate (CAGR) of 3.90% from 2025-2033 suggests a continuous expansion, with projected market values exceeding $1.8 billion by 2033. Key growth segments include fertilizers, driven by the need to enhance soil fertility and crop yields, and pesticides, responding to the growing threat of pests and diseases. The increasing adoption of precision agriculture and the growing demand for high-yielding crop varieties further fuel market growth. However, challenges such as water scarcity, climate change impacts on crop production, and fluctuating commodity prices represent significant constraints. The market is segmented by application (crop-based, fruit and vegetable, turf and ornamental grass, other major crops) and by product type (fertilizers, pesticides, adjuvants, plant growth regulators). Competition is intense, with both international and domestic players vying for market share, including major firms like Bayer CropScience AG, Syngenta AG, and FMC Corporation, alongside regional players catering to specific needs of South African farmers. The market's future growth will be influenced by the government's agricultural policies, investments in research and development, and the adoption of sustainable agricultural practices. A strategic focus on improving agricultural infrastructure and farmer training programs would be crucial to unlock the full potential of this market.
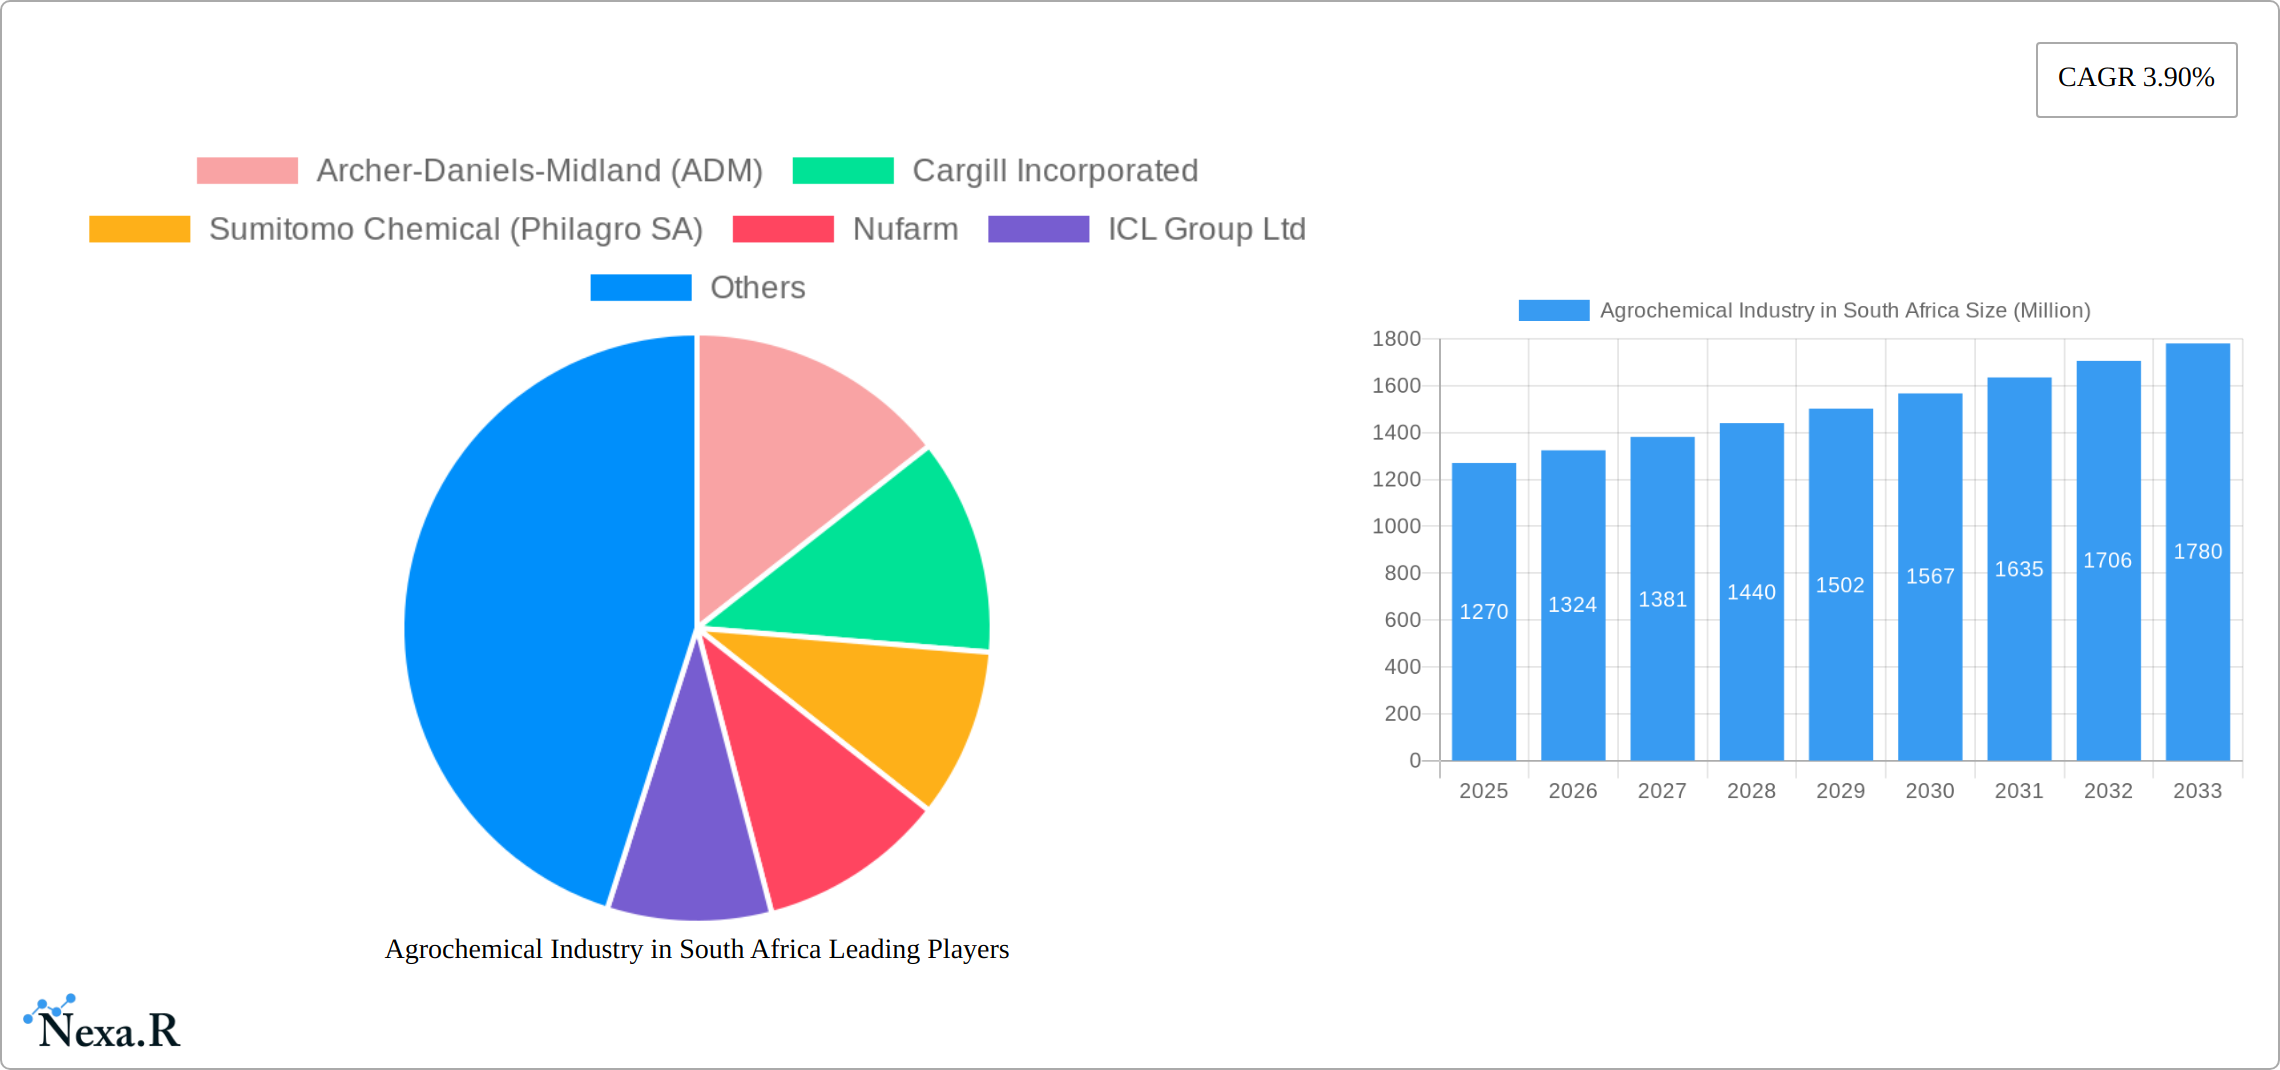
Agrochemical Industry in South Africa Market Size (In Billion)
The South African agrochemical market's structure reveals that crop-based applications hold the dominant share, reflecting the nation's strong agricultural focus. While fruit and vegetable production contribute significantly, the turf and ornamental grass sector is also growing. The fertilizer segment likely commands the largest market share due to South Africa’s extensive arable land. South Africa's unique climate and agricultural landscape also drive demand for specific types of pesticides tailored to combat prevalent pests and diseases. The competitive landscape shows both multinational corporations and local players contributing, with multinational corporations likely holding a larger market share due to their resources and established distribution networks. Importantly, the market’s future success hinges on addressing sustainable development goals, integrating environmentally friendly agrochemicals, and supporting smallholder farmers to access modern agricultural inputs. This balanced approach will contribute to the long-term health and sustainability of both the South African agrochemical sector and its agricultural economy.
Agrochemical Industry in South Africa Company Market Share
South Africa Agrochemical Industry Report: 2019-2033
This comprehensive report provides a detailed analysis of the South African agrochemical market, encompassing market dynamics, growth trends, regional performance, product landscapes, key players, and future outlooks. The study period spans 2019-2033, with 2025 serving as the base and estimated year. This report is essential for industry professionals, investors, and stakeholders seeking to understand and capitalize on opportunities within this dynamic sector. The report segments the market by type (Fertilizers, Pesticides, Adjuvants, Plant Growth Regulators) and application (Crop-based, Fruits and Vegetables, Non-crop-based, Turf and Ornamental Grass, Other Major Crops).
Agrochemical Industry in South Africa Market Dynamics & Structure
The South African agrochemical market presents a moderately concentrated landscape, featuring a dynamic interplay between multinational corporations and domestic players vying for market share. While precise figures for 2024 are pending verification, the market's value is substantial, reflecting the nation's significant agricultural sector. This concentration is shaped by economies of scale, advanced technological capabilities, and robust distribution networks. The pursuit of higher yields, enhanced crop protection, and the adoption of sustainable farming methods fuel technological innovation within the industry. However, challenges remain, including substantial R&D expenses, regulatory hurdles, and limited access to cutting-edge technologies for smaller companies. The regulatory framework, primarily overseen by the Department of Agriculture, Land Reform and Rural Development (DALRRD), significantly influences market trends through product registration processes, environmental protection measures, and stringent safety standards. Competitive pressures arise from substitute products, such as biopesticides and organic farming approaches, although their market penetration remains comparatively small. The end-user demographic, comprising a blend of large commercial farms and smaller-scale producers, creates diverse demand patterns for various agrochemical products. Mergers and acquisitions (M&A) activity has shown moderate levels in recent years, with a notable number of deals recorded between 2019 and 2024, predominantly focused on consolidating distribution channels and broadening product portfolios. Further analysis is needed to quantify the exact market size and concentration levels for 2024.
- Market size (2024): (Data pending verification)
- Market Concentration (2024): (Data pending verification)
- Number of M&A deals (2019-2024): (Data pending verification)
- Major regulatory body: Department of Agriculture, Land Reform and Rural Development (DALRRD)
Agrochemical Industry in South Africa Growth Trends & Insights
The South African agrochemical market experienced a Compound Annual Growth Rate (CAGR) of xx% during the historical period (2019-2024). This growth is attributed to factors such as increasing agricultural production, rising demand for food, and the adoption of modern farming techniques. Technological disruptions, particularly in precision agriculture and digital farming technologies, are enhancing efficiency and driving adoption rates. However, economic fluctuations, climate variability, and water scarcity pose challenges to market growth. Consumer behavior is shifting towards sustainable and environmentally friendly agrochemical products, presenting both opportunities and challenges for industry players. The market penetration of advanced technologies remains relatively low, creating opportunities for technological advancements and product innovation. The forecast period (2025-2033) projects a CAGR of xx%, driven by government initiatives promoting agricultural development and investment in the sector. Specific metrics will be further detailed within the full report.
Dominant Regions, Countries, or Segments in Agrochemical Industry in South Africa
Within the South African agrochemical market, fertilizers and pesticides constitute the dominant segments, driven by substantial demand from key agricultural regions such as Mpumalanga, KwaZulu-Natal, and the Free State. Crop-based applications hold the largest market share, reflecting the prevalence of field crops like maize, wheat, and sugarcane. Key growth drivers include:
- Supportive government policies fostering agricultural development.
- Increased investments in irrigation infrastructure.
- Expansion of export-oriented agriculture.
- Rising demand for high-yield crop varieties.
The dominance of these segments is largely attributed to their widespread application across diverse crops and their significant contribution to improved agricultural yields. However, the growth potential of other segments, including non-crop applications (fruits, vegetables, turf, and ornamental grasses) and adjuvants and plant growth regulators, presents substantial future growth opportunities, warranting closer attention.
Agrochemical Industry in South Africa Product Landscape
The South African agrochemical market showcases a diverse range of products, characterized by continuous innovation in formulation, efficacy, and environmental compatibility. New product introductions focus on improving crop protection, enhancing nutrient delivery, and mitigating environmental risks. Advancements include the development of targeted pesticides, biological control agents, and nutrient-efficient fertilizers. Companies are increasingly focusing on developing products with improved safety profiles and reduced environmental impact, aligning with sustainability goals. Unique selling propositions include increased efficacy, improved crop yield, and reduced environmental footprint.
Key Drivers, Barriers & Challenges in Agrochemical Industry in South Africa
Key Drivers: Increasing agricultural production, government support for agricultural modernization, and growing demand for food are key drivers. Technological advancements in precision farming enhance efficiency and yield.
Challenges: Supply chain disruptions, fluctuating commodity prices, stringent regulatory requirements, and water scarcity pose significant challenges. Competition from generic products and biopesticides also impacts profitability. These factors negatively impact market growth with an estimated impact of xx% on overall market growth in 2024.
Emerging Opportunities in Agrochemical Industry in South Africa
The growing demand for sustainable and organic agricultural products presents opportunities for biopesticides and organic fertilizers. Precision agriculture technologies and digital farming solutions are expanding rapidly, offering opportunities for improved efficiency and resource management. The development of drought-resistant and disease-resistant crop varieties is opening new markets for specialized agrochemicals.
Growth Accelerators in the Agrochemical Industry in South Africa Industry
Technological advancements in product formulation, precise application techniques, and the integration of digital farming tools are significantly accelerating market growth. Strategic collaborations between agrochemical companies and agricultural technology providers are driving innovation and efficiency. Furthermore, expanding into underserved markets, such as smaller-scale farming communities, presents considerable growth potential, requiring tailored solutions and outreach programs.
Key Players Shaping the Agrochemical Industry in South Africa Market
- Archer-Daniels-Midland (ADM) ADM
- Cargill Incorporated Cargill
- Sumitomo Chemical (Philagro SA)
- Nufarm Nufarm
- ICL Group Ltd ICL
- UPL Limited UPL
- BASF SE BASF
- FMC Corporation FMC
- Sociedad Química y Minera de Chile (SQM) SQM
- Belaruskali
- Sasol Limited Sasol
- K+S AG K+S
- ADAMA Ltd ADAMA
- Uralkal
- CF Industries Holdings CF Industries
- OCP Group OCP
- Land O' Lakes (Villa Crop Protection (Pty) Ltd)
- Yara International ASA Yara
- Syngenta AG Syngenta
- Nutrien Ltd Nutrien
- Corteva Agriscience Corteva
- Bayer CropScience AG Bayer
Notable Milestones in Agrochemical Industry in South Africa Sector
- 2020: Introduction of revised regulations concerning pesticide registration, impacting product approval processes and market entry strategies.
- 2021: Launch of a government-led initiative promoting sustainable agricultural practices, influencing industry focus and investment in eco-friendly solutions.
- 2022: A series of mergers and acquisitions involving smaller agrochemical companies reshaped the competitive landscape and market consolidation.
- 2023: A significant investment in precision agriculture technologies by a major industry player marked a key step towards technological advancements and efficiency gains.
In-Depth Agrochemical Industry in South Africa Market Outlook
The South African agrochemical market is poised for continued growth, driven by technological advancements, increasing agricultural investment, and evolving consumer preferences. The forecast period (2025-2033) presents significant opportunities for companies to expand their market share by focusing on sustainable products, innovative technologies, and effective distribution networks. Strategic partnerships and investments in research and development will be crucial for success in this competitive market. The increasing focus on sustainable agricultural practices and environmental protection will shape the future product development and market dynamics, with a specific focus on precision application techniques and bio-based solutions.
Agrochemical Industry in South Africa Segmentation
- 1. Production Analysis
- 2. Consumption Analysis
- 3. Import Market Analysis (Value & Volume)
- 4. Export Market Analysis (Value & Volume)
- 5. Price Trend Analysis
Agrochemical Industry in South Africa Segmentation By Geography
-
1. North America
- 1.1. United States
- 1.2. Canada
- 1.3. Mexico
-
2. South America
- 2.1. Brazil
- 2.2. Argentina
- 2.3. Rest of South America
-
3. Europe
- 3.1. United Kingdom
- 3.2. Germany
- 3.3. France
- 3.4. Italy
- 3.5. Spain
- 3.6. Russia
- 3.7. Benelux
- 3.8. Nordics
- 3.9. Rest of Europe
-
4. Middle East & Africa
- 4.1. Turkey
- 4.2. Israel
- 4.3. GCC
- 4.4. North Africa
- 4.5. South Africa
- 4.6. Rest of Middle East & Africa
-
5. Asia Pacific
- 5.1. China
- 5.2. India
- 5.3. Japan
- 5.4. South Korea
- 5.5. ASEAN
- 5.6. Oceania
- 5.7. Rest of Asia Pacific
Agrochemical Industry in South Africa Regional Market Share
Geographic Coverage of Agrochemical Industry in South Africa
Agrochemical Industry in South Africa REPORT HIGHLIGHTS
| Aspects | Details |
|---|---|
| Study Period | 2020-2034 |
| Base Year | 2025 |
| Estimated Year | 2026 |
| Forecast Period | 2026-2034 |
| Historical Period | 2020-2025 |
| Growth Rate | CAGR of 3.90% from 2020-2034 |
| Segmentation |
|
Table of Contents
- 1. Introduction
- 1.1. Research Scope
- 1.2. Market Segmentation
- 1.3. Research Methodology
- 1.4. Definitions and Assumptions
- 2. Executive Summary
- 2.1. Introduction
- 3. Market Dynamics
- 3.1. Introduction
- 3.2. Market Drivers
- 3.2.1. Adoption of Organic and Eco-friendly Farming Practices; Declining Area of Arable Land and Rising Food Security Concerns
- 3.3. Market Restrains
- 3.3.1. High Demand for Conventional and Synthetic Products; Lack of Awareness and Other Factors Limiting the Adoption of Agricultural Inoculants
- 3.4. Market Trends
- 3.4.1. Increasing Adoption of Bio-based Agrochemicals
- 4. Market Factor Analysis
- 4.1. Porters Five Forces
- 4.2. Supply/Value Chain
- 4.3. PESTEL analysis
- 4.4. Market Entropy
- 4.5. Patent/Trademark Analysis
- 5. Global Agrochemical Industry in South Africa Analysis, Insights and Forecast, 2020-2032
- 5.1. Market Analysis, Insights and Forecast - by Production Analysis
- 5.2. Market Analysis, Insights and Forecast - by Consumption Analysis
- 5.3. Market Analysis, Insights and Forecast - by Import Market Analysis (Value & Volume)
- 5.4. Market Analysis, Insights and Forecast - by Export Market Analysis (Value & Volume)
- 5.5. Market Analysis, Insights and Forecast - by Price Trend Analysis
- 5.6. Market Analysis, Insights and Forecast - by Region
- 5.6.1. North America
- 5.6.2. South America
- 5.6.3. Europe
- 5.6.4. Middle East & Africa
- 5.6.5. Asia Pacific
- 5.1. Market Analysis, Insights and Forecast - by Production Analysis
- 6. North America Agrochemical Industry in South Africa Analysis, Insights and Forecast, 2020-2032
- 6.1. Market Analysis, Insights and Forecast - by Production Analysis
- 6.2. Market Analysis, Insights and Forecast - by Consumption Analysis
- 6.3. Market Analysis, Insights and Forecast - by Import Market Analysis (Value & Volume)
- 6.4. Market Analysis, Insights and Forecast - by Export Market Analysis (Value & Volume)
- 6.5. Market Analysis, Insights and Forecast - by Price Trend Analysis
- 6.1. Market Analysis, Insights and Forecast - by Production Analysis
- 7. South America Agrochemical Industry in South Africa Analysis, Insights and Forecast, 2020-2032
- 7.1. Market Analysis, Insights and Forecast - by Production Analysis
- 7.2. Market Analysis, Insights and Forecast - by Consumption Analysis
- 7.3. Market Analysis, Insights and Forecast - by Import Market Analysis (Value & Volume)
- 7.4. Market Analysis, Insights and Forecast - by Export Market Analysis (Value & Volume)
- 7.5. Market Analysis, Insights and Forecast - by Price Trend Analysis
- 7.1. Market Analysis, Insights and Forecast - by Production Analysis
- 8. Europe Agrochemical Industry in South Africa Analysis, Insights and Forecast, 2020-2032
- 8.1. Market Analysis, Insights and Forecast - by Production Analysis
- 8.2. Market Analysis, Insights and Forecast - by Consumption Analysis
- 8.3. Market Analysis, Insights and Forecast - by Import Market Analysis (Value & Volume)
- 8.4. Market Analysis, Insights and Forecast - by Export Market Analysis (Value & Volume)
- 8.5. Market Analysis, Insights and Forecast - by Price Trend Analysis
- 8.1. Market Analysis, Insights and Forecast - by Production Analysis
- 9. Middle East & Africa Agrochemical Industry in South Africa Analysis, Insights and Forecast, 2020-2032
- 9.1. Market Analysis, Insights and Forecast - by Production Analysis
- 9.2. Market Analysis, Insights and Forecast - by Consumption Analysis
- 9.3. Market Analysis, Insights and Forecast - by Import Market Analysis (Value & Volume)
- 9.4. Market Analysis, Insights and Forecast - by Export Market Analysis (Value & Volume)
- 9.5. Market Analysis, Insights and Forecast - by Price Trend Analysis
- 9.1. Market Analysis, Insights and Forecast - by Production Analysis
- 10. Asia Pacific Agrochemical Industry in South Africa Analysis, Insights and Forecast, 2020-2032
- 10.1. Market Analysis, Insights and Forecast - by Production Analysis
- 10.2. Market Analysis, Insights and Forecast - by Consumption Analysis
- 10.3. Market Analysis, Insights and Forecast - by Import Market Analysis (Value & Volume)
- 10.4. Market Analysis, Insights and Forecast - by Export Market Analysis (Value & Volume)
- 10.5. Market Analysis, Insights and Forecast - by Price Trend Analysis
- 10.1. Market Analysis, Insights and Forecast - by Production Analysis
- 11. Competitive Analysis
- 11.1. Global Market Share Analysis 2025
- 11.2. Company Profiles
- 11.2.1 Archer-Daniels-Midland (ADM)
- 11.2.1.1. Overview
- 11.2.1.2. Products
- 11.2.1.3. SWOT Analysis
- 11.2.1.4. Recent Developments
- 11.2.1.5. Financials (Based on Availability)
- 11.2.2 Cargill Incorporated
- 11.2.2.1. Overview
- 11.2.2.2. Products
- 11.2.2.3. SWOT Analysis
- 11.2.2.4. Recent Developments
- 11.2.2.5. Financials (Based on Availability)
- 11.2.3 Sumitomo Chemical (Philagro SA)
- 11.2.3.1. Overview
- 11.2.3.2. Products
- 11.2.3.3. SWOT Analysis
- 11.2.3.4. Recent Developments
- 11.2.3.5. Financials (Based on Availability)
- 11.2.4 Nufarm
- 11.2.4.1. Overview
- 11.2.4.2. Products
- 11.2.4.3. SWOT Analysis
- 11.2.4.4. Recent Developments
- 11.2.4.5. Financials (Based on Availability)
- 11.2.5 ICL Group Ltd
- 11.2.5.1. Overview
- 11.2.5.2. Products
- 11.2.5.3. SWOT Analysis
- 11.2.5.4. Recent Developments
- 11.2.5.5. Financials (Based on Availability)
- 11.2.6 UPL Limited
- 11.2.6.1. Overview
- 11.2.6.2. Products
- 11.2.6.3. SWOT Analysis
- 11.2.6.4. Recent Developments
- 11.2.6.5. Financials (Based on Availability)
- 11.2.7 BASF SE
- 11.2.7.1. Overview
- 11.2.7.2. Products
- 11.2.7.3. SWOT Analysis
- 11.2.7.4. Recent Developments
- 11.2.7.5. Financials (Based on Availability)
- 11.2.8 FMC Corporation
- 11.2.8.1. Overview
- 11.2.8.2. Products
- 11.2.8.3. SWOT Analysis
- 11.2.8.4. Recent Developments
- 11.2.8.5. Financials (Based on Availability)
- 11.2.9 Sociedad Química y Minera de Chile (SQM)
- 11.2.9.1. Overview
- 11.2.9.2. Products
- 11.2.9.3. SWOT Analysis
- 11.2.9.4. Recent Developments
- 11.2.9.5. Financials (Based on Availability)
- 11.2.10 Belaruskali
- 11.2.10.1. Overview
- 11.2.10.2. Products
- 11.2.10.3. SWOT Analysis
- 11.2.10.4. Recent Developments
- 11.2.10.5. Financials (Based on Availability)
- 11.2.11 Sasol Limited
- 11.2.11.1. Overview
- 11.2.11.2. Products
- 11.2.11.3. SWOT Analysis
- 11.2.11.4. Recent Developments
- 11.2.11.5. Financials (Based on Availability)
- 11.2.12 K+S AG
- 11.2.12.1. Overview
- 11.2.12.2. Products
- 11.2.12.3. SWOT Analysis
- 11.2.12.4. Recent Developments
- 11.2.12.5. Financials (Based on Availability)
- 11.2.13 ADAMA Ltd
- 11.2.13.1. Overview
- 11.2.13.2. Products
- 11.2.13.3. SWOT Analysis
- 11.2.13.4. Recent Developments
- 11.2.13.5. Financials (Based on Availability)
- 11.2.14 Uralkal
- 11.2.14.1. Overview
- 11.2.14.2. Products
- 11.2.14.3. SWOT Analysis
- 11.2.14.4. Recent Developments
- 11.2.14.5. Financials (Based on Availability)
- 11.2.15 CF Industries Holdings
- 11.2.15.1. Overview
- 11.2.15.2. Products
- 11.2.15.3. SWOT Analysis
- 11.2.15.4. Recent Developments
- 11.2.15.5. Financials (Based on Availability)
- 11.2.16 OCP Group
- 11.2.16.1. Overview
- 11.2.16.2. Products
- 11.2.16.3. SWOT Analysis
- 11.2.16.4. Recent Developments
- 11.2.16.5. Financials (Based on Availability)
- 11.2.17 Land O' Lakes (Villa Crop Protection (Pty) Ltd
- 11.2.17.1. Overview
- 11.2.17.2. Products
- 11.2.17.3. SWOT Analysis
- 11.2.17.4. Recent Developments
- 11.2.17.5. Financials (Based on Availability)
- 11.2.18 Yara International ASA
- 11.2.18.1. Overview
- 11.2.18.2. Products
- 11.2.18.3. SWOT Analysis
- 11.2.18.4. Recent Developments
- 11.2.18.5. Financials (Based on Availability)
- 11.2.19 Syngenta AG
- 11.2.19.1. Overview
- 11.2.19.2. Products
- 11.2.19.3. SWOT Analysis
- 11.2.19.4. Recent Developments
- 11.2.19.5. Financials (Based on Availability)
- 11.2.20 Nutrien Ltd
- 11.2.20.1. Overview
- 11.2.20.2. Products
- 11.2.20.3. SWOT Analysis
- 11.2.20.4. Recent Developments
- 11.2.20.5. Financials (Based on Availability)
- 11.2.21 Corteva Agriscience
- 11.2.21.1. Overview
- 11.2.21.2. Products
- 11.2.21.3. SWOT Analysis
- 11.2.21.4. Recent Developments
- 11.2.21.5. Financials (Based on Availability)
- 11.2.22 Bayer CropScience AG
- 11.2.22.1. Overview
- 11.2.22.2. Products
- 11.2.22.3. SWOT Analysis
- 11.2.22.4. Recent Developments
- 11.2.22.5. Financials (Based on Availability)
- 11.2.1 Archer-Daniels-Midland (ADM)
List of Figures
- Figure 1: Global Agrochemical Industry in South Africa Revenue Breakdown (Million, %) by Region 2025 & 2033
- Figure 2: North America Agrochemical Industry in South Africa Revenue (Million), by Production Analysis 2025 & 2033
- Figure 3: North America Agrochemical Industry in South Africa Revenue Share (%), by Production Analysis 2025 & 2033
- Figure 4: North America Agrochemical Industry in South Africa Revenue (Million), by Consumption Analysis 2025 & 2033
- Figure 5: North America Agrochemical Industry in South Africa Revenue Share (%), by Consumption Analysis 2025 & 2033
- Figure 6: North America Agrochemical Industry in South Africa Revenue (Million), by Import Market Analysis (Value & Volume) 2025 & 2033
- Figure 7: North America Agrochemical Industry in South Africa Revenue Share (%), by Import Market Analysis (Value & Volume) 2025 & 2033
- Figure 8: North America Agrochemical Industry in South Africa Revenue (Million), by Export Market Analysis (Value & Volume) 2025 & 2033
- Figure 9: North America Agrochemical Industry in South Africa Revenue Share (%), by Export Market Analysis (Value & Volume) 2025 & 2033
- Figure 10: North America Agrochemical Industry in South Africa Revenue (Million), by Price Trend Analysis 2025 & 2033
- Figure 11: North America Agrochemical Industry in South Africa Revenue Share (%), by Price Trend Analysis 2025 & 2033
- Figure 12: North America Agrochemical Industry in South Africa Revenue (Million), by Country 2025 & 2033
- Figure 13: North America Agrochemical Industry in South Africa Revenue Share (%), by Country 2025 & 2033
- Figure 14: South America Agrochemical Industry in South Africa Revenue (Million), by Production Analysis 2025 & 2033
- Figure 15: South America Agrochemical Industry in South Africa Revenue Share (%), by Production Analysis 2025 & 2033
- Figure 16: South America Agrochemical Industry in South Africa Revenue (Million), by Consumption Analysis 2025 & 2033
- Figure 17: South America Agrochemical Industry in South Africa Revenue Share (%), by Consumption Analysis 2025 & 2033
- Figure 18: South America Agrochemical Industry in South Africa Revenue (Million), by Import Market Analysis (Value & Volume) 2025 & 2033
- Figure 19: South America Agrochemical Industry in South Africa Revenue Share (%), by Import Market Analysis (Value & Volume) 2025 & 2033
- Figure 20: South America Agrochemical Industry in South Africa Revenue (Million), by Export Market Analysis (Value & Volume) 2025 & 2033
- Figure 21: South America Agrochemical Industry in South Africa Revenue Share (%), by Export Market Analysis (Value & Volume) 2025 & 2033
- Figure 22: South America Agrochemical Industry in South Africa Revenue (Million), by Price Trend Analysis 2025 & 2033
- Figure 23: South America Agrochemical Industry in South Africa Revenue Share (%), by Price Trend Analysis 2025 & 2033
- Figure 24: South America Agrochemical Industry in South Africa Revenue (Million), by Country 2025 & 2033
- Figure 25: South America Agrochemical Industry in South Africa Revenue Share (%), by Country 2025 & 2033
- Figure 26: Europe Agrochemical Industry in South Africa Revenue (Million), by Production Analysis 2025 & 2033
- Figure 27: Europe Agrochemical Industry in South Africa Revenue Share (%), by Production Analysis 2025 & 2033
- Figure 28: Europe Agrochemical Industry in South Africa Revenue (Million), by Consumption Analysis 2025 & 2033
- Figure 29: Europe Agrochemical Industry in South Africa Revenue Share (%), by Consumption Analysis 2025 & 2033
- Figure 30: Europe Agrochemical Industry in South Africa Revenue (Million), by Import Market Analysis (Value & Volume) 2025 & 2033
- Figure 31: Europe Agrochemical Industry in South Africa Revenue Share (%), by Import Market Analysis (Value & Volume) 2025 & 2033
- Figure 32: Europe Agrochemical Industry in South Africa Revenue (Million), by Export Market Analysis (Value & Volume) 2025 & 2033
- Figure 33: Europe Agrochemical Industry in South Africa Revenue Share (%), by Export Market Analysis (Value & Volume) 2025 & 2033
- Figure 34: Europe Agrochemical Industry in South Africa Revenue (Million), by Price Trend Analysis 2025 & 2033
- Figure 35: Europe Agrochemical Industry in South Africa Revenue Share (%), by Price Trend Analysis 2025 & 2033
- Figure 36: Europe Agrochemical Industry in South Africa Revenue (Million), by Country 2025 & 2033
- Figure 37: Europe Agrochemical Industry in South Africa Revenue Share (%), by Country 2025 & 2033
- Figure 38: Middle East & Africa Agrochemical Industry in South Africa Revenue (Million), by Production Analysis 2025 & 2033
- Figure 39: Middle East & Africa Agrochemical Industry in South Africa Revenue Share (%), by Production Analysis 2025 & 2033
- Figure 40: Middle East & Africa Agrochemical Industry in South Africa Revenue (Million), by Consumption Analysis 2025 & 2033
- Figure 41: Middle East & Africa Agrochemical Industry in South Africa Revenue Share (%), by Consumption Analysis 2025 & 2033
- Figure 42: Middle East & Africa Agrochemical Industry in South Africa Revenue (Million), by Import Market Analysis (Value & Volume) 2025 & 2033
- Figure 43: Middle East & Africa Agrochemical Industry in South Africa Revenue Share (%), by Import Market Analysis (Value & Volume) 2025 & 2033
- Figure 44: Middle East & Africa Agrochemical Industry in South Africa Revenue (Million), by Export Market Analysis (Value & Volume) 2025 & 2033
- Figure 45: Middle East & Africa Agrochemical Industry in South Africa Revenue Share (%), by Export Market Analysis (Value & Volume) 2025 & 2033
- Figure 46: Middle East & Africa Agrochemical Industry in South Africa Revenue (Million), by Price Trend Analysis 2025 & 2033
- Figure 47: Middle East & Africa Agrochemical Industry in South Africa Revenue Share (%), by Price Trend Analysis 2025 & 2033
- Figure 48: Middle East & Africa Agrochemical Industry in South Africa Revenue (Million), by Country 2025 & 2033
- Figure 49: Middle East & Africa Agrochemical Industry in South Africa Revenue Share (%), by Country 2025 & 2033
- Figure 50: Asia Pacific Agrochemical Industry in South Africa Revenue (Million), by Production Analysis 2025 & 2033
- Figure 51: Asia Pacific Agrochemical Industry in South Africa Revenue Share (%), by Production Analysis 2025 & 2033
- Figure 52: Asia Pacific Agrochemical Industry in South Africa Revenue (Million), by Consumption Analysis 2025 & 2033
- Figure 53: Asia Pacific Agrochemical Industry in South Africa Revenue Share (%), by Consumption Analysis 2025 & 2033
- Figure 54: Asia Pacific Agrochemical Industry in South Africa Revenue (Million), by Import Market Analysis (Value & Volume) 2025 & 2033
- Figure 55: Asia Pacific Agrochemical Industry in South Africa Revenue Share (%), by Import Market Analysis (Value & Volume) 2025 & 2033
- Figure 56: Asia Pacific Agrochemical Industry in South Africa Revenue (Million), by Export Market Analysis (Value & Volume) 2025 & 2033
- Figure 57: Asia Pacific Agrochemical Industry in South Africa Revenue Share (%), by Export Market Analysis (Value & Volume) 2025 & 2033
- Figure 58: Asia Pacific Agrochemical Industry in South Africa Revenue (Million), by Price Trend Analysis 2025 & 2033
- Figure 59: Asia Pacific Agrochemical Industry in South Africa Revenue Share (%), by Price Trend Analysis 2025 & 2033
- Figure 60: Asia Pacific Agrochemical Industry in South Africa Revenue (Million), by Country 2025 & 2033
- Figure 61: Asia Pacific Agrochemical Industry in South Africa Revenue Share (%), by Country 2025 & 2033
List of Tables
- Table 1: Global Agrochemical Industry in South Africa Revenue Million Forecast, by Production Analysis 2020 & 2033
- Table 2: Global Agrochemical Industry in South Africa Revenue Million Forecast, by Consumption Analysis 2020 & 2033
- Table 3: Global Agrochemical Industry in South Africa Revenue Million Forecast, by Import Market Analysis (Value & Volume) 2020 & 2033
- Table 4: Global Agrochemical Industry in South Africa Revenue Million Forecast, by Export Market Analysis (Value & Volume) 2020 & 2033
- Table 5: Global Agrochemical Industry in South Africa Revenue Million Forecast, by Price Trend Analysis 2020 & 2033
- Table 6: Global Agrochemical Industry in South Africa Revenue Million Forecast, by Region 2020 & 2033
- Table 7: Global Agrochemical Industry in South Africa Revenue Million Forecast, by Production Analysis 2020 & 2033
- Table 8: Global Agrochemical Industry in South Africa Revenue Million Forecast, by Consumption Analysis 2020 & 2033
- Table 9: Global Agrochemical Industry in South Africa Revenue Million Forecast, by Import Market Analysis (Value & Volume) 2020 & 2033
- Table 10: Global Agrochemical Industry in South Africa Revenue Million Forecast, by Export Market Analysis (Value & Volume) 2020 & 2033
- Table 11: Global Agrochemical Industry in South Africa Revenue Million Forecast, by Price Trend Analysis 2020 & 2033
- Table 12: Global Agrochemical Industry in South Africa Revenue Million Forecast, by Country 2020 & 2033
- Table 13: United States Agrochemical Industry in South Africa Revenue (Million) Forecast, by Application 2020 & 2033
- Table 14: Canada Agrochemical Industry in South Africa Revenue (Million) Forecast, by Application 2020 & 2033
- Table 15: Mexico Agrochemical Industry in South Africa Revenue (Million) Forecast, by Application 2020 & 2033
- Table 16: Global Agrochemical Industry in South Africa Revenue Million Forecast, by Production Analysis 2020 & 2033
- Table 17: Global Agrochemical Industry in South Africa Revenue Million Forecast, by Consumption Analysis 2020 & 2033
- Table 18: Global Agrochemical Industry in South Africa Revenue Million Forecast, by Import Market Analysis (Value & Volume) 2020 & 2033
- Table 19: Global Agrochemical Industry in South Africa Revenue Million Forecast, by Export Market Analysis (Value & Volume) 2020 & 2033
- Table 20: Global Agrochemical Industry in South Africa Revenue Million Forecast, by Price Trend Analysis 2020 & 2033
- Table 21: Global Agrochemical Industry in South Africa Revenue Million Forecast, by Country 2020 & 2033
- Table 22: Brazil Agrochemical Industry in South Africa Revenue (Million) Forecast, by Application 2020 & 2033
- Table 23: Argentina Agrochemical Industry in South Africa Revenue (Million) Forecast, by Application 2020 & 2033
- Table 24: Rest of South America Agrochemical Industry in South Africa Revenue (Million) Forecast, by Application 2020 & 2033
- Table 25: Global Agrochemical Industry in South Africa Revenue Million Forecast, by Production Analysis 2020 & 2033
- Table 26: Global Agrochemical Industry in South Africa Revenue Million Forecast, by Consumption Analysis 2020 & 2033
- Table 27: Global Agrochemical Industry in South Africa Revenue Million Forecast, by Import Market Analysis (Value & Volume) 2020 & 2033
- Table 28: Global Agrochemical Industry in South Africa Revenue Million Forecast, by Export Market Analysis (Value & Volume) 2020 & 2033
- Table 29: Global Agrochemical Industry in South Africa Revenue Million Forecast, by Price Trend Analysis 2020 & 2033
- Table 30: Global Agrochemical Industry in South Africa Revenue Million Forecast, by Country 2020 & 2033
- Table 31: United Kingdom Agrochemical Industry in South Africa Revenue (Million) Forecast, by Application 2020 & 2033
- Table 32: Germany Agrochemical Industry in South Africa Revenue (Million) Forecast, by Application 2020 & 2033
- Table 33: France Agrochemical Industry in South Africa Revenue (Million) Forecast, by Application 2020 & 2033
- Table 34: Italy Agrochemical Industry in South Africa Revenue (Million) Forecast, by Application 2020 & 2033
- Table 35: Spain Agrochemical Industry in South Africa Revenue (Million) Forecast, by Application 2020 & 2033
- Table 36: Russia Agrochemical Industry in South Africa Revenue (Million) Forecast, by Application 2020 & 2033
- Table 37: Benelux Agrochemical Industry in South Africa Revenue (Million) Forecast, by Application 2020 & 2033
- Table 38: Nordics Agrochemical Industry in South Africa Revenue (Million) Forecast, by Application 2020 & 2033
- Table 39: Rest of Europe Agrochemical Industry in South Africa Revenue (Million) Forecast, by Application 2020 & 2033
- Table 40: Global Agrochemical Industry in South Africa Revenue Million Forecast, by Production Analysis 2020 & 2033
- Table 41: Global Agrochemical Industry in South Africa Revenue Million Forecast, by Consumption Analysis 2020 & 2033
- Table 42: Global Agrochemical Industry in South Africa Revenue Million Forecast, by Import Market Analysis (Value & Volume) 2020 & 2033
- Table 43: Global Agrochemical Industry in South Africa Revenue Million Forecast, by Export Market Analysis (Value & Volume) 2020 & 2033
- Table 44: Global Agrochemical Industry in South Africa Revenue Million Forecast, by Price Trend Analysis 2020 & 2033
- Table 45: Global Agrochemical Industry in South Africa Revenue Million Forecast, by Country 2020 & 2033
- Table 46: Turkey Agrochemical Industry in South Africa Revenue (Million) Forecast, by Application 2020 & 2033
- Table 47: Israel Agrochemical Industry in South Africa Revenue (Million) Forecast, by Application 2020 & 2033
- Table 48: GCC Agrochemical Industry in South Africa Revenue (Million) Forecast, by Application 2020 & 2033
- Table 49: North Africa Agrochemical Industry in South Africa Revenue (Million) Forecast, by Application 2020 & 2033
- Table 50: South Africa Agrochemical Industry in South Africa Revenue (Million) Forecast, by Application 2020 & 2033
- Table 51: Rest of Middle East & Africa Agrochemical Industry in South Africa Revenue (Million) Forecast, by Application 2020 & 2033
- Table 52: Global Agrochemical Industry in South Africa Revenue Million Forecast, by Production Analysis 2020 & 2033
- Table 53: Global Agrochemical Industry in South Africa Revenue Million Forecast, by Consumption Analysis 2020 & 2033
- Table 54: Global Agrochemical Industry in South Africa Revenue Million Forecast, by Import Market Analysis (Value & Volume) 2020 & 2033
- Table 55: Global Agrochemical Industry in South Africa Revenue Million Forecast, by Export Market Analysis (Value & Volume) 2020 & 2033
- Table 56: Global Agrochemical Industry in South Africa Revenue Million Forecast, by Price Trend Analysis 2020 & 2033
- Table 57: Global Agrochemical Industry in South Africa Revenue Million Forecast, by Country 2020 & 2033
- Table 58: China Agrochemical Industry in South Africa Revenue (Million) Forecast, by Application 2020 & 2033
- Table 59: India Agrochemical Industry in South Africa Revenue (Million) Forecast, by Application 2020 & 2033
- Table 60: Japan Agrochemical Industry in South Africa Revenue (Million) Forecast, by Application 2020 & 2033
- Table 61: South Korea Agrochemical Industry in South Africa Revenue (Million) Forecast, by Application 2020 & 2033
- Table 62: ASEAN Agrochemical Industry in South Africa Revenue (Million) Forecast, by Application 2020 & 2033
- Table 63: Oceania Agrochemical Industry in South Africa Revenue (Million) Forecast, by Application 2020 & 2033
- Table 64: Rest of Asia Pacific Agrochemical Industry in South Africa Revenue (Million) Forecast, by Application 2020 & 2033
Frequently Asked Questions
1. What is the projected Compound Annual Growth Rate (CAGR) of the Agrochemical Industry in South Africa?
The projected CAGR is approximately 3.90%.
2. Which companies are prominent players in the Agrochemical Industry in South Africa?
Key companies in the market include Archer-Daniels-Midland (ADM), Cargill Incorporated, Sumitomo Chemical (Philagro SA), Nufarm, ICL Group Ltd, UPL Limited, BASF SE, FMC Corporation, Sociedad Química y Minera de Chile (SQM), Belaruskali, Sasol Limited, K+S AG, ADAMA Ltd, Uralkal, CF Industries Holdings, OCP Group, Land O' Lakes (Villa Crop Protection (Pty) Ltd, Yara International ASA, Syngenta AG, Nutrien Ltd, Corteva Agriscience, Bayer CropScience AG.
3. What are the main segments of the Agrochemical Industry in South Africa?
The market segments include Production Analysis, Consumption Analysis, Import Market Analysis (Value & Volume), Export Market Analysis (Value & Volume), Price Trend Analysis.
4. Can you provide details about the market size?
The market size is estimated to be USD 1.27 Million as of 2022.
5. What are some drivers contributing to market growth?
Adoption of Organic and Eco-friendly Farming Practices; Declining Area of Arable Land and Rising Food Security Concerns.
6. What are the notable trends driving market growth?
Increasing Adoption of Bio-based Agrochemicals.
7. Are there any restraints impacting market growth?
High Demand for Conventional and Synthetic Products; Lack of Awareness and Other Factors Limiting the Adoption of Agricultural Inoculants.
8. Can you provide examples of recent developments in the market?
N/A
9. What pricing options are available for accessing the report?
Pricing options include single-user, multi-user, and enterprise licenses priced at USD 3800, USD 4500, and USD 5800 respectively.
10. Is the market size provided in terms of value or volume?
The market size is provided in terms of value, measured in Million.
11. Are there any specific market keywords associated with the report?
Yes, the market keyword associated with the report is "Agrochemical Industry in South Africa," which aids in identifying and referencing the specific market segment covered.
12. How do I determine which pricing option suits my needs best?
The pricing options vary based on user requirements and access needs. Individual users may opt for single-user licenses, while businesses requiring broader access may choose multi-user or enterprise licenses for cost-effective access to the report.
13. Are there any additional resources or data provided in the Agrochemical Industry in South Africa report?
While the report offers comprehensive insights, it's advisable to review the specific contents or supplementary materials provided to ascertain if additional resources or data are available.
14. How can I stay updated on further developments or reports in the Agrochemical Industry in South Africa?
To stay informed about further developments, trends, and reports in the Agrochemical Industry in South Africa, consider subscribing to industry newsletters, following relevant companies and organizations, or regularly checking reputable industry news sources and publications.
Methodology
Step 1 - Identification of Relevant Samples Size from Population Database


Step 2 - Approaches for Defining Global Market Size (Value, Volume* & Price*)

Note*: In applicable scenarios
Step 3 - Data Sources
Primary Research
- Web Analytics
- Survey Reports
- Research Institute
- Latest Research Reports
- Opinion Leaders
Secondary Research
- Annual Reports
- White Paper
- Latest Press Release
- Industry Association
- Paid Database
- Investor Presentations

Step 4 - Data Triangulation
Involves using different sources of information in order to increase the validity of a study
These sources are likely to be stakeholders in a program - participants, other researchers, program staff, other community members, and so on.
Then we put all data in single framework & apply various statistical tools to find out the dynamic on the market.
During the analysis stage, feedback from the stakeholder groups would be compared to determine areas of agreement as well as areas of divergence