

Key Insights
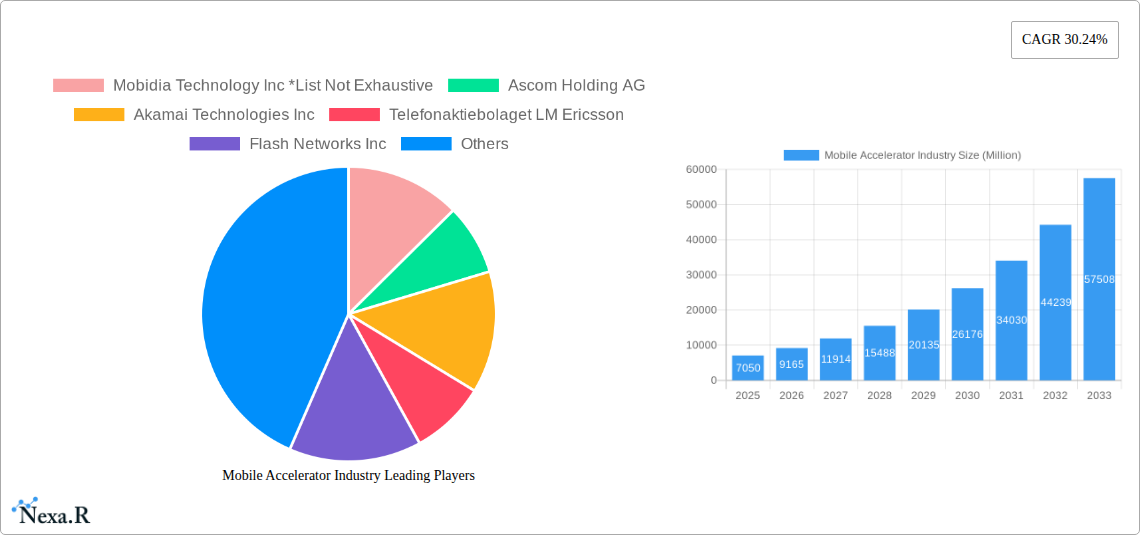
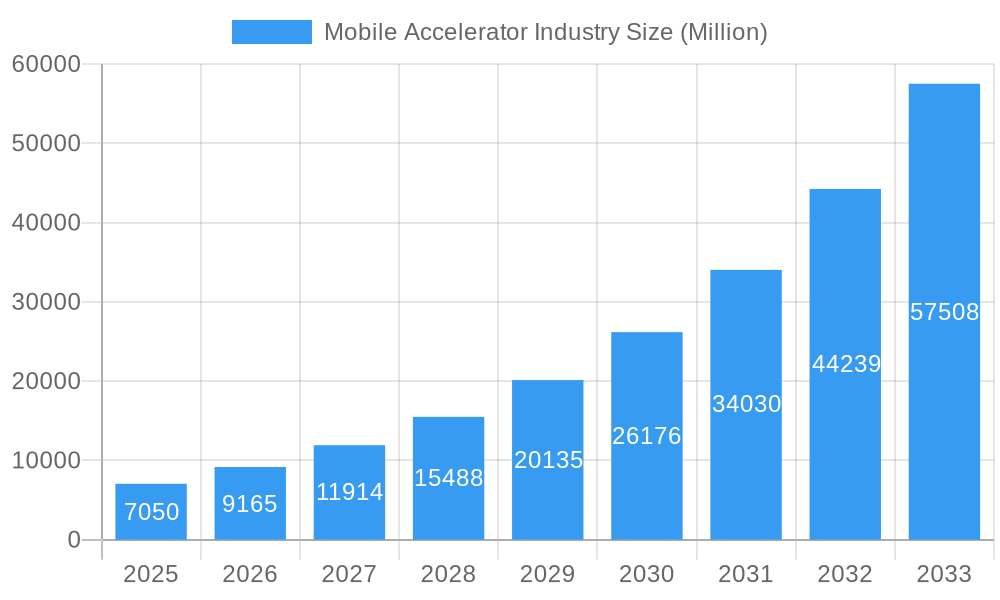
The mobile accelerator market, valued at $7.05 billion in 2025, is experiencing robust growth, projected to expand at a compound annual growth rate (CAGR) of 30.24% from 2025 to 2033. This surge is driven by the escalating adoption of mobile devices for diverse applications, including gaming, e-commerce, and social networking. The increasing demand for seamless and high-speed mobile experiences, particularly in data-intensive applications like streaming and augmented reality, fuels the market's expansion. Furthermore, the proliferation of 5G networks provides a significant boost, enabling faster data transfer rates and enhanced mobile application performance. Significant advancements in mobile accelerator technologies, including improved algorithms and hardware optimization, contribute to this growth trajectory. Segmentation reveals a strong preference for smartphones as the primary device type, while content/web application acceleration leads the type segment. North America and Asia Pacific are currently the dominant regions, driven by early 5G adoption and a large mobile user base. However, other regions are rapidly catching up, presenting lucrative opportunities for market expansion.
Mobile Accelerator Industry Market Size (In Billion)
The market's growth is not without challenges. Concerns around data security and privacy, especially within mobile applications, pose a restraint. The high cost of implementation and maintenance of advanced mobile accelerator solutions can also limit adoption, particularly among smaller businesses. Competition among established players and emerging startups is intense, necessitating continuous innovation and strategic partnerships to maintain a competitive edge. Despite these challenges, the long-term outlook for the mobile accelerator market remains positive, fuelled by ongoing technological advancements, increasing mobile data consumption, and the expanding adoption of high-speed mobile networks globally. Further diversification into new applications, such as Internet of Things (IoT) devices, will also contribute significantly to market growth over the forecast period.
Mobile Accelerator Industry Company Market Share
Mobile Accelerator Industry Market Report: 2019-2033
This comprehensive report provides a detailed analysis of the Mobile Accelerator industry, encompassing market dynamics, growth trends, regional segmentation, product landscape, key players, and future outlook. The study period covers 2019-2033, with 2025 as the base year and a forecast period of 2025-2033. The report utilizes data from the historical period (2019-2024) and incorporates insights from leading industry players like Mobidia Technology Inc, Ascom Holding AG, Akamai Technologies Inc, Telefonaktiebolaget LM Ericsson, Flash Networks Inc, F5 Networks Inc, Juniper Networks Inc, Huawei Technologies Co Ltd, Riverbed Technologies Inc, Rockstart Inc, and Qualcomm Inc. The report segments the market by device (Smartphones, Tablets, Other Devices), type (Content/Web Applications, Content Delivery Network Acceleration, WAN Optimization, Mobile Application Accelerator, Device/User End Acceleration, Other Types), and application (Gaming, M-Commerce, Location-based Services, Social Networking, Music & Messaging, Other Applications).
Mobile Accelerator Industry Market Dynamics & Structure
The mobile accelerator market is characterized by moderate concentration, with a few major players holding significant market share, while numerous smaller players compete in niche segments. Technological innovation, particularly in 5G and edge computing, is a primary growth driver. Regulatory frameworks concerning data privacy and security significantly impact market dynamics. Competitive substitutes include software-defined networking (SDN) solutions and cloud-based acceleration services. The end-user demographic is diverse, encompassing individuals, enterprises, and mobile network operators. M&A activity has been moderate, with strategic acquisitions aimed at expanding technological capabilities and market reach. The market size in 2025 is estimated at xx Million units.
- Market Concentration: Moderately concentrated, with top 5 players holding approximately xx% market share in 2025.
- Technological Innovation: 5G deployment, edge computing, and AI/ML advancements are key drivers.
- Regulatory Landscape: Data privacy regulations (e.g., GDPR) influence product development and deployment.
- Competitive Substitutes: SDN and cloud-based acceleration solutions present competitive challenges.
- M&A Activity: xx deals recorded between 2019 and 2024, with an average deal value of xx Million USD.
- Innovation Barriers: High R&D costs and the need for specialized expertise pose challenges.
Mobile Accelerator Industry Growth Trends & Insights
The global mobile accelerator market has witnessed significant growth over the past few years, driven by the proliferation of smartphones, tablets, and other mobile devices. The increasing demand for high-speed data and seamless mobile experiences fuels the adoption of mobile acceleration technologies. The market experienced a CAGR of xx% during the historical period (2019-2024) and is projected to grow at a CAGR of xx% during the forecast period (2025-2033), reaching xx Million units by 2033. This growth is being propelled by technological advancements such as 5G and edge computing, which enable faster data speeds and reduced latency. Consumer behavior shifts toward increased mobile data consumption and reliance on mobile applications further contribute to market expansion. The market penetration rate is expected to reach xx% by 2033. Technological disruptions, such as the transition to 5G networks, are reshaping the industry landscape and creating new opportunities for innovation.
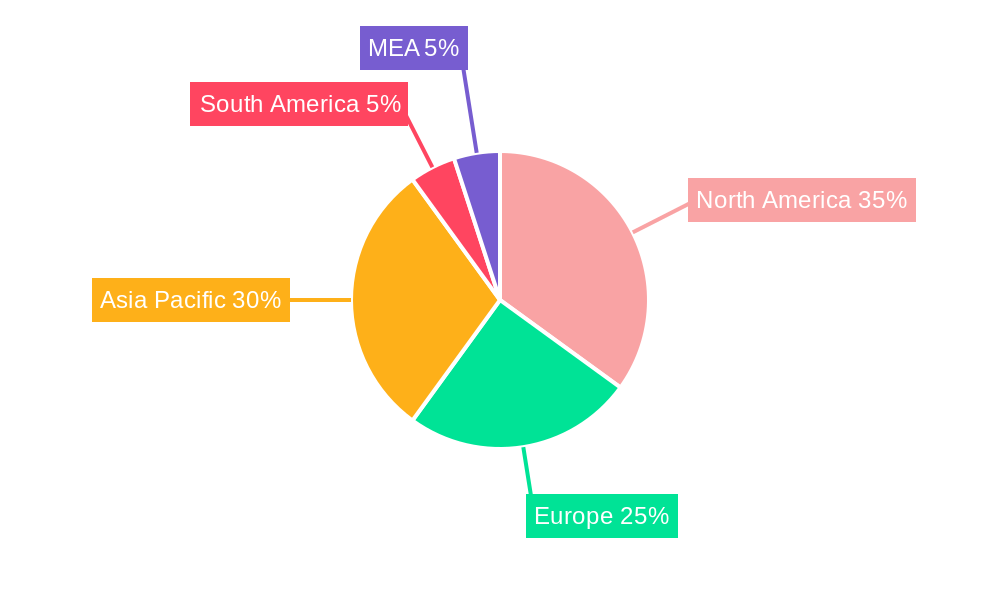
Dominant Regions, Countries, or Segments in Mobile Accelerator Industry
North America and Asia Pacific are the dominant regions in the mobile accelerator market, driven by high smartphone penetration rates and robust technological infrastructure. Within these regions, countries like the US, China, and Japan are leading the market. The smartphone segment dominates the market by device type, due to the widespread adoption of smartphones globally. Among application types, gaming, M-commerce, and social networking applications drive substantial demand for mobile accelerators. Content Delivery Network (CDN) acceleration is the leading type of mobile accelerator, as it addresses the need for fast content delivery over mobile networks.
- Key Regional Drivers:
- North America: Strong technological advancements, high mobile data consumption, and robust telecom infrastructure.
- Asia Pacific: Large and rapidly growing mobile user base, increasing smartphone penetration, and government initiatives to improve digital infrastructure.
- Leading Segments:
- By Device: Smartphones (xx Million units in 2025)
- By Type: Content Delivery Network Acceleration (xx Million units in 2025)
- By Application: Gaming Applications (xx Million units in 2025)
Mobile Accelerator Industry Product Landscape
The mobile accelerator market offers a wide range of solutions, from hardware-based accelerators to software-based optimization tools. Recent product innovations focus on enhancing performance, reducing latency, and improving security. Key features include advanced caching mechanisms, intelligent routing algorithms, and support for various mobile network technologies. Unique selling propositions often involve superior performance benchmarks, seamless integration with existing mobile infrastructure, and comprehensive security features. Technological advancements are driving the development of more efficient and sophisticated mobile acceleration solutions.
Key Drivers, Barriers & Challenges in Mobile Accelerator Industry
Key Drivers: The increasing demand for high-speed mobile data, the proliferation of mobile applications, the growth of 5G networks, and the expansion of edge computing are major drivers for the mobile accelerator market. Government initiatives to improve digital infrastructure in developing countries also contribute significantly.
Key Challenges: Competition from alternative solutions, high implementation costs, the complexity of integrating with existing networks, and security concerns pose significant challenges. Supply chain disruptions and the rising cost of components can also impact market growth. Stringent regulations around data privacy and security add further complexity.
Emerging Opportunities in Mobile Accelerator Industry
The increasing adoption of IoT devices, the rise of AR/VR applications, the expansion of 5G networks in underserved regions, and the growing demand for improved mobile gaming experiences present significant opportunities. The development of innovative mobile acceleration solutions tailored to specific industry verticals (e.g., healthcare, finance) offers further potential.
Growth Accelerators in the Mobile Accelerator Industry Industry
Strategic partnerships between mobile network operators, technology providers, and application developers are crucial for driving market growth. Technological breakthroughs in areas like AI-powered optimization and edge computing will further enhance the capabilities of mobile accelerators. Market expansion strategies targeting emerging economies and underserved regions can unlock substantial growth potential.
Key Players Shaping the Mobile Accelerator Industry Market
- Mobidia Technology Inc
- Ascom Holding AG
- Akamai Technologies Inc
- Telefonaktiebolaget LM Ericsson
- Flash Networks Inc
- F5 Networks Inc
- Juniper Networks Inc
- Huawei Technologies Co Ltd
- Riverbed Technologies Inc
- Rockstart Inc
- Qualcomm Inc
Notable Milestones in Mobile Accelerator Industry Sector
- November 2023: Huawei Technologies Co. Ltd. unveiled the OceanStor Pacific 9920 and OceanStor Dorado 2100 all-flash storage products, enhancing data center efficiency.
- October 2023: Sasken Technologies collaborated with Qualcomm Technologies, Inc. to advance IoT innovation.
In-Depth Mobile Accelerator Industry Market Outlook
The mobile accelerator market is poised for sustained growth, driven by ongoing technological advancements and the increasing demand for high-speed mobile experiences. Strategic investments in R&D, strategic partnerships, and expansion into new markets will be crucial for capitalizing on future opportunities. The market is expected to experience strong growth, particularly in regions with expanding mobile infrastructure and rising smartphone penetration. Companies focusing on innovation, efficiency, and security will be best positioned to succeed in this dynamic market.
Mobile Accelerator Industry Segmentation
-
1. Device
- 1.1. Smartphones
- 1.2. Tablets
- 1.3. Other Devices
-
2. Type
- 2.1. Content/Web Applications
- 2.2. Content Delivery Network Acceleration
- 2.3. WAN Optimization
- 2.4. Mobile Application Accelerator
- 2.5. Device/User End Acceleration
- 2.6. Other Types
-
3. Application
- 3.1. Gaming Applications
- 3.2. M-Commerce Applications
- 3.3. Location-based Service Applications
- 3.4. Social Networking Applications
- 3.5. Music and Messaging Applications
- 3.6. Other Applications
Mobile Accelerator Industry Segmentation By Geography
- 1. North America
- 2. Europe
- 3. Asia Pacific
- 4. Latin America
- 5. Middle East and Africa
Mobile Accelerator Industry Regional Market Share
Geographic Coverage of Mobile Accelerator Industry
Mobile Accelerator Industry REPORT HIGHLIGHTS
| Aspects | Details |
|---|---|
| Study Period | 2020-2034 |
| Base Year | 2025 |
| Estimated Year | 2026 |
| Forecast Period | 2026-2034 |
| Historical Period | 2020-2025 |
| Growth Rate | CAGR of 30.24% from 2020-2034 |
| Segmentation |
|
Table of Contents
- 1. Introduction
- 1.1. Research Scope
- 1.2. Market Segmentation
- 1.3. Research Objective
- 1.4. Definitions and Assumptions
- 2. Executive Summary
- 2.1. Market Snapshot
- 3. Market Dynamics
- 3.1. Market Drivers
- 3.2. Market Restrains
- 3.3. Market Trends
- 3.4. Market Opportunities
- 4. Market Factor Analysis
- 4.1. Porters Five Forces
- 4.1.1. Bargaining Power of Suppliers
- 4.1.2. Bargaining Power of Buyers
- 4.1.3. Threat of New Entrants
- 4.1.4. Threat of Substitutes
- 4.1.5. Competitive Rivalry
- 4.2. PESTEL analysis
- 4.3. BCG Analysis
- 4.3.1. Stars (High Growth, High Market Share)
- 4.3.2. Cash Cows (Low Growth, High Market Share)
- 4.3.3. Question Mark (High Growth, Low Market Share)
- 4.3.4. Dogs (Low Growth, Low Market Share)
- 4.4. Ansoff Matrix Analysis
- 4.5. Supply Chain Analysis
- 4.6. Regulatory Landscape
- 4.7. Current Market Potential and Opportunity Assessment (TAM–SAM–SOM Framework)
- 4.8. NRP Analyst Note
- 4.1. Porters Five Forces
- 5. Market Analysis, Insights and Forecast 2021-2033
- 5.1. Market Analysis, Insights and Forecast - by Device
- 5.1.1. Smartphones
- 5.1.2. Tablets
- 5.1.3. Other Devices
- 5.2. Market Analysis, Insights and Forecast - by Type
- 5.2.1. Content/Web Applications
- 5.2.2. Content Delivery Network Acceleration
- 5.2.3. WAN Optimization
- 5.2.4. Mobile Application Accelerator
- 5.2.5. Device/User End Acceleration
- 5.2.6. Other Types
- 5.3. Market Analysis, Insights and Forecast - by Application
- 5.3.1. Gaming Applications
- 5.3.2. M-Commerce Applications
- 5.3.3. Location-based Service Applications
- 5.3.4. Social Networking Applications
- 5.3.5. Music and Messaging Applications
- 5.3.6. Other Applications
- 5.4. Market Analysis, Insights and Forecast - by Region
- 5.4.1. North America
- 5.4.2. Europe
- 5.4.3. Asia Pacific
- 5.4.4. Latin America
- 5.4.5. Middle East and Africa
- 5.1. Market Analysis, Insights and Forecast - by Device
- 6. Global Mobile Accelerator Industry Analysis, Insights and Forecast, 2021-2033
- 6.1. Market Analysis, Insights and Forecast - by Device
- 6.1.1. Smartphones
- 6.1.2. Tablets
- 6.1.3. Other Devices
- 6.2. Market Analysis, Insights and Forecast - by Type
- 6.2.1. Content/Web Applications
- 6.2.2. Content Delivery Network Acceleration
- 6.2.3. WAN Optimization
- 6.2.4. Mobile Application Accelerator
- 6.2.5. Device/User End Acceleration
- 6.2.6. Other Types
- 6.3. Market Analysis, Insights and Forecast - by Application
- 6.3.1. Gaming Applications
- 6.3.2. M-Commerce Applications
- 6.3.3. Location-based Service Applications
- 6.3.4. Social Networking Applications
- 6.3.5. Music and Messaging Applications
- 6.3.6. Other Applications
- 6.1. Market Analysis, Insights and Forecast - by Device
- 7. North America Mobile Accelerator Industry Analysis, Insights and Forecast, 2020-2032
- 7.1. Market Analysis, Insights and Forecast - by Device
- 7.1.1. Smartphones
- 7.1.2. Tablets
- 7.1.3. Other Devices
- 7.2. Market Analysis, Insights and Forecast - by Type
- 7.2.1. Content/Web Applications
- 7.2.2. Content Delivery Network Acceleration
- 7.2.3. WAN Optimization
- 7.2.4. Mobile Application Accelerator
- 7.2.5. Device/User End Acceleration
- 7.2.6. Other Types
- 7.3. Market Analysis, Insights and Forecast - by Application
- 7.3.1. Gaming Applications
- 7.3.2. M-Commerce Applications
- 7.3.3. Location-based Service Applications
- 7.3.4. Social Networking Applications
- 7.3.5. Music and Messaging Applications
- 7.3.6. Other Applications
- 7.1. Market Analysis, Insights and Forecast - by Device
- 8. Europe Mobile Accelerator Industry Analysis, Insights and Forecast, 2020-2032
- 8.1. Market Analysis, Insights and Forecast - by Device
- 8.1.1. Smartphones
- 8.1.2. Tablets
- 8.1.3. Other Devices
- 8.2. Market Analysis, Insights and Forecast - by Type
- 8.2.1. Content/Web Applications
- 8.2.2. Content Delivery Network Acceleration
- 8.2.3. WAN Optimization
- 8.2.4. Mobile Application Accelerator
- 8.2.5. Device/User End Acceleration
- 8.2.6. Other Types
- 8.3. Market Analysis, Insights and Forecast - by Application
- 8.3.1. Gaming Applications
- 8.3.2. M-Commerce Applications
- 8.3.3. Location-based Service Applications
- 8.3.4. Social Networking Applications
- 8.3.5. Music and Messaging Applications
- 8.3.6. Other Applications
- 8.1. Market Analysis, Insights and Forecast - by Device
- 9. Asia Pacific Mobile Accelerator Industry Analysis, Insights and Forecast, 2020-2032
- 9.1. Market Analysis, Insights and Forecast - by Device
- 9.1.1. Smartphones
- 9.1.2. Tablets
- 9.1.3. Other Devices
- 9.2. Market Analysis, Insights and Forecast - by Type
- 9.2.1. Content/Web Applications
- 9.2.2. Content Delivery Network Acceleration
- 9.2.3. WAN Optimization
- 9.2.4. Mobile Application Accelerator
- 9.2.5. Device/User End Acceleration
- 9.2.6. Other Types
- 9.3. Market Analysis, Insights and Forecast - by Application
- 9.3.1. Gaming Applications
- 9.3.2. M-Commerce Applications
- 9.3.3. Location-based Service Applications
- 9.3.4. Social Networking Applications
- 9.3.5. Music and Messaging Applications
- 9.3.6. Other Applications
- 9.1. Market Analysis, Insights and Forecast - by Device
- 10. Latin America Mobile Accelerator Industry Analysis, Insights and Forecast, 2020-2032
- 10.1. Market Analysis, Insights and Forecast - by Device
- 10.1.1. Smartphones
- 10.1.2. Tablets
- 10.1.3. Other Devices
- 10.2. Market Analysis, Insights and Forecast - by Type
- 10.2.1. Content/Web Applications
- 10.2.2. Content Delivery Network Acceleration
- 10.2.3. WAN Optimization
- 10.2.4. Mobile Application Accelerator
- 10.2.5. Device/User End Acceleration
- 10.2.6. Other Types
- 10.3. Market Analysis, Insights and Forecast - by Application
- 10.3.1. Gaming Applications
- 10.3.2. M-Commerce Applications
- 10.3.3. Location-based Service Applications
- 10.3.4. Social Networking Applications
- 10.3.5. Music and Messaging Applications
- 10.3.6. Other Applications
- 10.1. Market Analysis, Insights and Forecast - by Device
- 11. Middle East and Africa Mobile Accelerator Industry Analysis, Insights and Forecast, 2020-2032
- 11.1. Market Analysis, Insights and Forecast - by Device
- 11.1.1. Smartphones
- 11.1.2. Tablets
- 11.1.3. Other Devices
- 11.2. Market Analysis, Insights and Forecast - by Type
- 11.2.1. Content/Web Applications
- 11.2.2. Content Delivery Network Acceleration
- 11.2.3. WAN Optimization
- 11.2.4. Mobile Application Accelerator
- 11.2.5. Device/User End Acceleration
- 11.2.6. Other Types
- 11.3. Market Analysis, Insights and Forecast - by Application
- 11.3.1. Gaming Applications
- 11.3.2. M-Commerce Applications
- 11.3.3. Location-based Service Applications
- 11.3.4. Social Networking Applications
- 11.3.5. Music and Messaging Applications
- 11.3.6. Other Applications
- 11.1. Market Analysis, Insights and Forecast - by Device
- 12. Competitive Analysis
- 12.1. Company Profiles
- 12.1.1 Mobidia Technology Inc *List Not Exhaustive
- 12.1.1.1. Company Overview
- 12.1.1.2. Products
- 12.1.1.3. Company Financials
- 12.1.1.4. SWOT Analysis
- 12.1.2 Ascom Holding AG
- 12.1.2.1. Company Overview
- 12.1.2.2. Products
- 12.1.2.3. Company Financials
- 12.1.2.4. SWOT Analysis
- 12.1.3 Akamai Technologies Inc
- 12.1.3.1. Company Overview
- 12.1.3.2. Products
- 12.1.3.3. Company Financials
- 12.1.3.4. SWOT Analysis
- 12.1.4 Telefonaktiebolaget LM Ericsson
- 12.1.4.1. Company Overview
- 12.1.4.2. Products
- 12.1.4.3. Company Financials
- 12.1.4.4. SWOT Analysis
- 12.1.5 Flash Networks Inc
- 12.1.5.1. Company Overview
- 12.1.5.2. Products
- 12.1.5.3. Company Financials
- 12.1.5.4. SWOT Analysis
- 12.1.6 F5 Networks Inc
- 12.1.6.1. Company Overview
- 12.1.6.2. Products
- 12.1.6.3. Company Financials
- 12.1.6.4. SWOT Analysis
- 12.1.7 Juniper Networks Inc
- 12.1.7.1. Company Overview
- 12.1.7.2. Products
- 12.1.7.3. Company Financials
- 12.1.7.4. SWOT Analysis
- 12.1.8 Huawei Technologies Co Ltd
- 12.1.8.1. Company Overview
- 12.1.8.2. Products
- 12.1.8.3. Company Financials
- 12.1.8.4. SWOT Analysis
- 12.1.9 Riverbed Technologies Inc
- 12.1.9.1. Company Overview
- 12.1.9.2. Products
- 12.1.9.3. Company Financials
- 12.1.9.4. SWOT Analysis
- 12.1.10 Rockstart Inc
- 12.1.10.1. Company Overview
- 12.1.10.2. Products
- 12.1.10.3. Company Financials
- 12.1.10.4. SWOT Analysis
- 12.1.11 Qualcomm Inc
- 12.1.11.1. Company Overview
- 12.1.11.2. Products
- 12.1.11.3. Company Financials
- 12.1.11.4. SWOT Analysis
- 12.1.1 Mobidia Technology Inc *List Not Exhaustive
- 12.2. Market Entropy
- 12.2.1 Company's Key Areas Served
- 12.2.2 Recent Developments
- 12.3. Company Market Share Analysis 2025
- 12.3.1 Top 5 Companies Market Share Analysis
- 12.3.2 Top 3 Companies Market Share Analysis
- 12.4. List of Potential Customers
- 13. Research Methodology
List of Figures
- Figure 1: Global Mobile Accelerator Industry Revenue Breakdown (Million, %) by Region 2025 & 2033
- Figure 2: North America Mobile Accelerator Industry Revenue (Million), by Device 2025 & 2033
- Figure 3: North America Mobile Accelerator Industry Revenue Share (%), by Device 2025 & 2033
- Figure 4: North America Mobile Accelerator Industry Revenue (Million), by Type 2025 & 2033
- Figure 5: North America Mobile Accelerator Industry Revenue Share (%), by Type 2025 & 2033
- Figure 6: North America Mobile Accelerator Industry Revenue (Million), by Application 2025 & 2033
- Figure 7: North America Mobile Accelerator Industry Revenue Share (%), by Application 2025 & 2033
- Figure 8: North America Mobile Accelerator Industry Revenue (Million), by Country 2025 & 2033
- Figure 9: North America Mobile Accelerator Industry Revenue Share (%), by Country 2025 & 2033
- Figure 10: Europe Mobile Accelerator Industry Revenue (Million), by Device 2025 & 2033
- Figure 11: Europe Mobile Accelerator Industry Revenue Share (%), by Device 2025 & 2033
- Figure 12: Europe Mobile Accelerator Industry Revenue (Million), by Type 2025 & 2033
- Figure 13: Europe Mobile Accelerator Industry Revenue Share (%), by Type 2025 & 2033
- Figure 14: Europe Mobile Accelerator Industry Revenue (Million), by Application 2025 & 2033
- Figure 15: Europe Mobile Accelerator Industry Revenue Share (%), by Application 2025 & 2033
- Figure 16: Europe Mobile Accelerator Industry Revenue (Million), by Country 2025 & 2033
- Figure 17: Europe Mobile Accelerator Industry Revenue Share (%), by Country 2025 & 2033
- Figure 18: Asia Pacific Mobile Accelerator Industry Revenue (Million), by Device 2025 & 2033
- Figure 19: Asia Pacific Mobile Accelerator Industry Revenue Share (%), by Device 2025 & 2033
- Figure 20: Asia Pacific Mobile Accelerator Industry Revenue (Million), by Type 2025 & 2033
- Figure 21: Asia Pacific Mobile Accelerator Industry Revenue Share (%), by Type 2025 & 2033
- Figure 22: Asia Pacific Mobile Accelerator Industry Revenue (Million), by Application 2025 & 2033
- Figure 23: Asia Pacific Mobile Accelerator Industry Revenue Share (%), by Application 2025 & 2033
- Figure 24: Asia Pacific Mobile Accelerator Industry Revenue (Million), by Country 2025 & 2033
- Figure 25: Asia Pacific Mobile Accelerator Industry Revenue Share (%), by Country 2025 & 2033
- Figure 26: Latin America Mobile Accelerator Industry Revenue (Million), by Device 2025 & 2033
- Figure 27: Latin America Mobile Accelerator Industry Revenue Share (%), by Device 2025 & 2033
- Figure 28: Latin America Mobile Accelerator Industry Revenue (Million), by Type 2025 & 2033
- Figure 29: Latin America Mobile Accelerator Industry Revenue Share (%), by Type 2025 & 2033
- Figure 30: Latin America Mobile Accelerator Industry Revenue (Million), by Application 2025 & 2033
- Figure 31: Latin America Mobile Accelerator Industry Revenue Share (%), by Application 2025 & 2033
- Figure 32: Latin America Mobile Accelerator Industry Revenue (Million), by Country 2025 & 2033
- Figure 33: Latin America Mobile Accelerator Industry Revenue Share (%), by Country 2025 & 2033
- Figure 34: Middle East and Africa Mobile Accelerator Industry Revenue (Million), by Device 2025 & 2033
- Figure 35: Middle East and Africa Mobile Accelerator Industry Revenue Share (%), by Device 2025 & 2033
- Figure 36: Middle East and Africa Mobile Accelerator Industry Revenue (Million), by Type 2025 & 2033
- Figure 37: Middle East and Africa Mobile Accelerator Industry Revenue Share (%), by Type 2025 & 2033
- Figure 38: Middle East and Africa Mobile Accelerator Industry Revenue (Million), by Application 2025 & 2033
- Figure 39: Middle East and Africa Mobile Accelerator Industry Revenue Share (%), by Application 2025 & 2033
- Figure 40: Middle East and Africa Mobile Accelerator Industry Revenue (Million), by Country 2025 & 2033
- Figure 41: Middle East and Africa Mobile Accelerator Industry Revenue Share (%), by Country 2025 & 2033
List of Tables
- Table 1: Global Mobile Accelerator Industry Revenue Million Forecast, by Device 2020 & 2033
- Table 2: Global Mobile Accelerator Industry Revenue Million Forecast, by Type 2020 & 2033
- Table 3: Global Mobile Accelerator Industry Revenue Million Forecast, by Application 2020 & 2033
- Table 4: Global Mobile Accelerator Industry Revenue Million Forecast, by Region 2020 & 2033
- Table 5: Global Mobile Accelerator Industry Revenue Million Forecast, by Device 2020 & 2033
- Table 6: Global Mobile Accelerator Industry Revenue Million Forecast, by Type 2020 & 2033
- Table 7: Global Mobile Accelerator Industry Revenue Million Forecast, by Application 2020 & 2033
- Table 8: Global Mobile Accelerator Industry Revenue Million Forecast, by Country 2020 & 2033
- Table 9: Global Mobile Accelerator Industry Revenue Million Forecast, by Device 2020 & 2033
- Table 10: Global Mobile Accelerator Industry Revenue Million Forecast, by Type 2020 & 2033
- Table 11: Global Mobile Accelerator Industry Revenue Million Forecast, by Application 2020 & 2033
- Table 12: Global Mobile Accelerator Industry Revenue Million Forecast, by Country 2020 & 2033
- Table 13: Global Mobile Accelerator Industry Revenue Million Forecast, by Device 2020 & 2033
- Table 14: Global Mobile Accelerator Industry Revenue Million Forecast, by Type 2020 & 2033
- Table 15: Global Mobile Accelerator Industry Revenue Million Forecast, by Application 2020 & 2033
- Table 16: Global Mobile Accelerator Industry Revenue Million Forecast, by Country 2020 & 2033
- Table 17: Global Mobile Accelerator Industry Revenue Million Forecast, by Device 2020 & 2033
- Table 18: Global Mobile Accelerator Industry Revenue Million Forecast, by Type 2020 & 2033
- Table 19: Global Mobile Accelerator Industry Revenue Million Forecast, by Application 2020 & 2033
- Table 20: Global Mobile Accelerator Industry Revenue Million Forecast, by Country 2020 & 2033
- Table 21: Global Mobile Accelerator Industry Revenue Million Forecast, by Device 2020 & 2033
- Table 22: Global Mobile Accelerator Industry Revenue Million Forecast, by Type 2020 & 2033
- Table 23: Global Mobile Accelerator Industry Revenue Million Forecast, by Application 2020 & 2033
- Table 24: Global Mobile Accelerator Industry Revenue Million Forecast, by Country 2020 & 2033
Frequently Asked Questions
1. What is the projected Compound Annual Growth Rate (CAGR) of the Mobile Accelerator Industry?
The projected CAGR is approximately 30.24%.
2. Which companies are prominent players in the Mobile Accelerator Industry?
Key companies in the market include Mobidia Technology Inc *List Not Exhaustive, Ascom Holding AG, Akamai Technologies Inc, Telefonaktiebolaget LM Ericsson, Flash Networks Inc, F5 Networks Inc, Juniper Networks Inc, Huawei Technologies Co Ltd, Riverbed Technologies Inc, Rockstart Inc, Qualcomm Inc.
3. What are the main segments of the Mobile Accelerator Industry?
The market segments include Device, Type, Application.
4. Can you provide details about the market size?
The market size is estimated to be USD 7.05 Million as of 2022.
5. What are some drivers contributing to market growth?
Increasing Mobile Traffic and Mobile Marketing Trends.
6. What are the notable trends driving market growth?
Increasing Mobile Traffic and Mobile Marketing Trends is Expected to Drive the Market Growth.
7. Are there any restraints impacting market growth?
Security Challenges as the Data is shared with Third-party Vendors.
8. Can you provide examples of recent developments in the market?
November 2023 - Huawei Technologies Co. Ltd unveiled two new all-flash storage products, the OceanStor Pacific 9920 and OceanStor Dorado 2100, to promote the industry vision of All Flash for All Scenarios. The products have been designed to help customers build more efficient and reliable data centers.
9. What pricing options are available for accessing the report?
Pricing options include single-user, multi-user, and enterprise licenses priced at USD 4750, USD 5250, and USD 8750 respectively.
10. Is the market size provided in terms of value or volume?
The market size is provided in terms of value, measured in Million.
11. Are there any specific market keywords associated with the report?
Yes, the market keyword associated with the report is "Mobile Accelerator Industry," which aids in identifying and referencing the specific market segment covered.
12. How do I determine which pricing option suits my needs best?
The pricing options vary based on user requirements and access needs. Individual users may opt for single-user licenses, while businesses requiring broader access may choose multi-user or enterprise licenses for cost-effective access to the report.
13. Are there any additional resources or data provided in the Mobile Accelerator Industry report?
While the report offers comprehensive insights, it's advisable to review the specific contents or supplementary materials provided to ascertain if additional resources or data are available.
14. How can I stay updated on further developments or reports in the Mobile Accelerator Industry?
To stay informed about further developments, trends, and reports in the Mobile Accelerator Industry, consider subscribing to industry newsletters, following relevant companies and organizations, or regularly checking reputable industry news sources and publications.
Methodology
Step 1 - Identification of Relevant Samples Size from Population Database


Step 2 - Approaches for Defining Global Market Size (Value, Volume* & Price*)

Note*: In applicable scenarios
Step 3 - Data Sources
Primary Research
- Web Analytics
- Survey Reports
- Research Institute
- Latest Research Reports
- Opinion Leaders
Secondary Research
- Annual Reports
- White Paper
- Latest Press Release
- Industry Association
- Paid Database
- Investor Presentations

Step 4 - Data Triangulation
Involves using different sources of information in order to increase the validity of a study
These sources are likely to be stakeholders in a program - participants, other researchers, program staff, other community members, and so on.
Then we put all data in single framework & apply various statistical tools to find out the dynamic on the market.
During the analysis stage, feedback from the stakeholder groups would be compared to determine areas of agreement as well as areas of divergence