

Key Insights
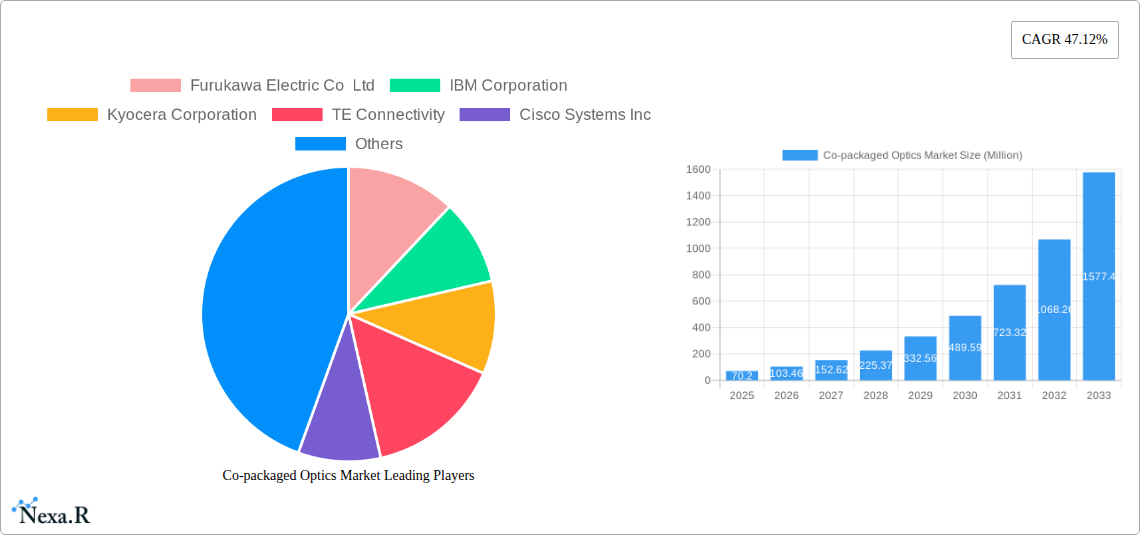
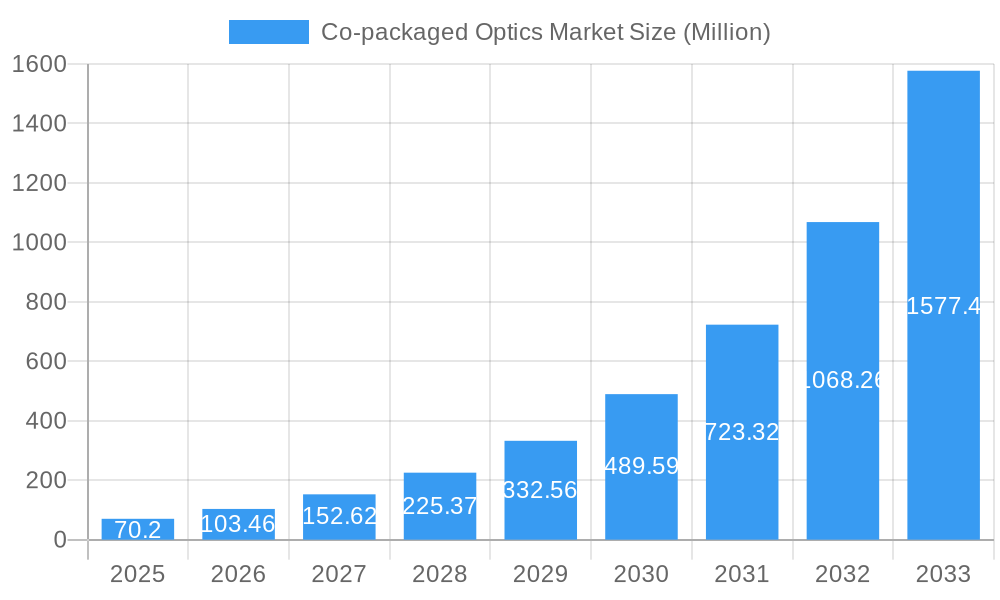
The co-packaged optics market is experiencing explosive growth, projected to reach $70.20 million in 2025 and exhibiting a remarkable Compound Annual Growth Rate (CAGR) of 47.12%. This surge is driven primarily by the increasing demand for higher bandwidth and faster data transmission speeds in data centers and high-performance computing environments. The miniaturization and integration capabilities of co-packaged optics offer significant advantages over traditional approaches, leading to reduced costs, improved performance, and enhanced energy efficiency. Key trends shaping this market include the growing adoption of 400G and 800G Ethernet technologies, the rise of cloud computing and its associated infrastructure requirements, and the increasing prevalence of artificial intelligence and machine learning applications demanding significant data processing power. While challenges remain, such as the complexity of integrating optical and electronic components and the potential for increased manufacturing costs, the overall market outlook is exceptionally positive. North America, particularly the United States, is currently a dominant player, but the Asia-Pacific region, fueled by strong growth in China and other emerging economies, is poised for significant expansion in the coming years. This rapid growth signifies a pivotal shift in optical networking, where co-packaged optics are becoming essential for enabling next-generation data center infrastructure.
Co-packaged Optics Market Market Size (In Million)
The competitive landscape is highly dynamic, with established players like Cisco, IBM, and Broadcom competing alongside innovative startups such as Ayar Labs. Strategic partnerships and mergers and acquisitions are expected to become increasingly prevalent as companies strive to gain a competitive edge in this rapidly evolving market. The continued miniaturization of optical components, the development of more advanced packaging technologies, and the exploration of new optical materials will further fuel market expansion. Furthermore, the integration of co-packaged optics into other emerging technologies like 5G networks and autonomous vehicles is anticipated to unlock new avenues for growth in the years to come. The market segmentation by data rates (less than 400G, 400G-800G, and above 800G) reflects the ongoing technological advancements and increasing demand for higher bandwidth solutions, influencing the market’s trajectory towards a future dominated by high-speed data transmission.
Co-packaged Optics Market Company Market Share
Co-packaged Optics Market: A Comprehensive Report (2019-2033)
This in-depth report provides a comprehensive analysis of the Co-packaged Optics (CPO) market, encompassing market dynamics, growth trends, regional analysis, product landscape, key players, and future outlook. The report covers the parent market of optical communication and the child market of co-packaged optics, offering granular insights for strategic decision-making. The study period spans from 2019 to 2033, with 2025 serving as the base and estimated year.
Co-packaged Optics Market Dynamics & Structure
The Co-packaged Optics market is characterized by a moderately concentrated structure, with key players like Furukawa Electric, IBM, and Cisco Systems holding significant market share. However, the market is witnessing increased competition from emerging players, driven by technological advancements in silicon photonics. The report analyzes market concentration using the Herfindahl-Hirschman Index (HHI), revealing a xx value indicating a moderately competitive landscape. Mergers and acquisitions (M&A) activity has been moderate, with approximately xx deals recorded during the historical period (2019-2024), primarily focused on strengthening technological capabilities and expanding market reach.
- Technological Innovation: Rapid advancements in silicon photonics are the primary driver, enabling higher data rates and reduced costs. However, challenges remain in miniaturization and power consumption.
- Regulatory Frameworks: Government initiatives promoting digital infrastructure development positively influence market growth. However, differing regulatory landscapes across regions can pose challenges.
- Competitive Substitutes: Traditional optical transceivers represent a significant substitute, although CPO's advantages in density and power efficiency are driving adoption.
- End-User Demographics: Data centers, high-performance computing (HPC), and telecommunications are the primary end-users, with AI infrastructure emerging as a significant growth catalyst.
- M&A Trends: Strategic acquisitions are focusing on acquiring specialized technologies and expanding geographic reach, resulting in increased market consolidation.
Co-packaged Optics Market Growth Trends & Insights
The global Co-packaged Optics market is projected to experience robust growth, with a Compound Annual Growth Rate (CAGR) of xx% during the forecast period (2025-2033). Market size is estimated at xx million units in 2025, expanding to xx million units by 2033. This growth is primarily driven by the escalating demand for higher bandwidth in data centers fueled by the proliferation of cloud computing and artificial intelligence. The market penetration of CPO technology is steadily increasing, particularly in hyperscale data centers, as operators seek to optimize power efficiency and improve performance. Technological disruptions, such as advancements in silicon photonics integration and improved packaging techniques, are accelerating adoption.
Dominant Regions, Countries, or Segments in Co-packaged Optics Market
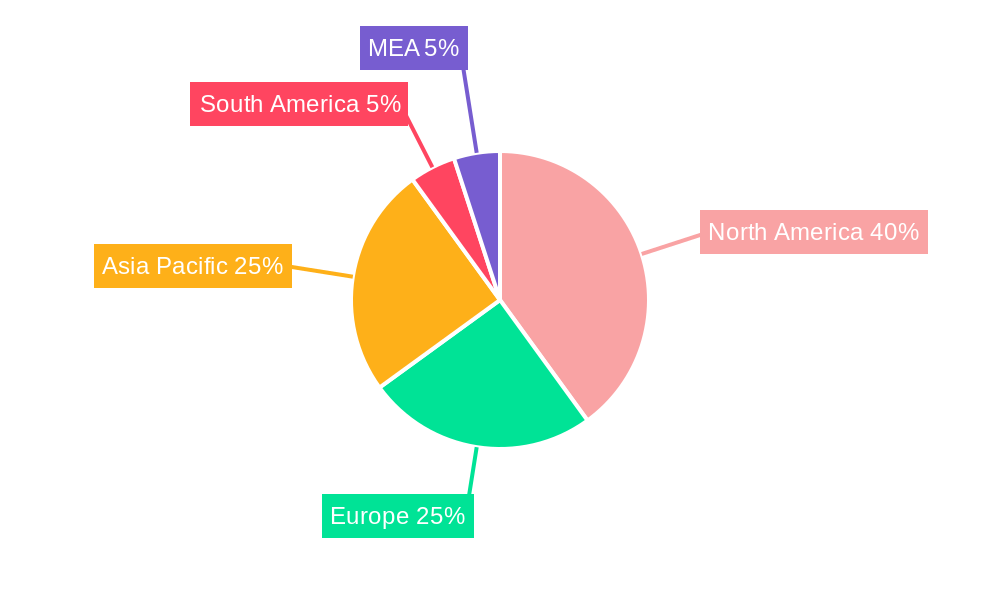
North America currently dominates the Co-packaged Optics market, driven by the high concentration of hyperscale data centers and a robust technological ecosystem. However, the Asia-Pacific region is expected to witness the fastest growth rate due to increasing investments in data center infrastructure and expanding telecommunication networks. Within data rates, the "Less than 400G" segment currently holds the largest market share, but the higher data rate segments (400G and above) are experiencing rapid growth and are expected to dominate in the coming years.
- Key Drivers for North America: Strong presence of major technology companies, high investments in R&D, well-established infrastructure.
- Key Drivers for Asia-Pacific: Rapid economic growth, expanding digital infrastructure, government support for technological advancement.
- Market Share: North America holds approximately xx% of the market share, followed by Asia-Pacific at xx%.
Co-packaged Optics Market Product Landscape
Co-packaged Optics solutions are evolving rapidly, with a focus on higher data rates, improved power efficiency, and smaller form factors. Innovations include advanced silicon photonics integration, improved thermal management techniques, and the development of more robust and reliable connectors. Key features include high bandwidth, low latency, and reduced power consumption, offering significant advantages over traditional optical transceivers.
Key Drivers, Barriers & Challenges in Co-packaged Optics Market
Key Drivers:
- The increasing demand for higher bandwidth in data centers and high-performance computing (HPC) environments is the primary driver.
- Advancements in silicon photonics technology are enabling higher data rates and reduced costs.
- Government initiatives supporting digital infrastructure development are promoting adoption.
Key Challenges:
- High initial investment costs for implementing CPO technology can be a barrier for smaller data centers.
- The complexity of integrating CPO solutions into existing infrastructure can pose challenges.
- Potential supply chain disruptions could impact the availability of components. The impact is estimated to be a xx% reduction in production during periods of significant disruption.
Emerging Opportunities in Co-packaged Optics Market
- The expanding adoption of Artificial Intelligence (AI) and machine learning (ML) applications is driving demand for high-bandwidth connectivity.
- The emergence of edge computing presents significant opportunities for deploying CPO solutions closer to the end-users.
- The development of next-generation optical technologies, such as coherent optical communication, is expected to further enhance the capabilities of CPO solutions.
Growth Accelerators in the Co-packaged Optics Market Industry
The long-term growth of the Co-packaged Optics market is being fueled by strategic collaborations between semiconductor manufacturers and optical component suppliers, leading to faster innovation and reduced production costs. Further expansion into new markets and applications, coupled with continuous advancements in silicon photonics technology, will be crucial in driving future growth. Government incentives promoting digital transformation will also play a significant role.
Key Players Shaping the Co-packaged Optics Market Market
- Furukawa Electric Co Ltd
- IBM Corporation
- Kyocera Corporation
- TE Connectivity
- Cisco Systems Inc
- Broadcom Inc
- Microsoft Corporation
- Ayar Labs Inc
- Huawei Technologies Co Ltd
- SENKO Advanced Components Inc
- Hisense Broadband Multimedia Technology Co Ltd
- Sumitomo Electric Industries Lt
- Intel Corporation
- POET Technologies
Notable Milestones in Co-packaged Optics Market Sector
- March 2024: Intel developed a 4 Tbps bidirectional fully integrated OCI chiplet based on Intel’s in-house silicon photonics technology.
- September 2023: TSMC collaborated with Broadcom and Nvidia to develop silicon photonics and co-packaged optics (CPO).
In-Depth Co-packaged Optics Market Market Outlook
The future of the Co-packaged Optics market looks bright, with continued growth driven by the insatiable demand for higher bandwidth and lower latency in data centers and beyond. Strategic partnerships, technological breakthroughs, and increased investment in R&D will be key factors shaping the market's evolution. The market presents significant opportunities for companies that can effectively address the challenges associated with the adoption of CPO technology, particularly in areas such as cost reduction and improved system integration.
Co-packaged Optics Market Segmentation
-
1. Data Rates
- 1.1. Less than 1.6 T
- 1.2. 3.2 T
- 1.3. 6.4 T
Co-packaged Optics Market Segmentation By Geography
- 1. North America
- 2. Europe
- 3. Asia
- 4. Australia and New Zealand
- 5. Latin America
- 6. Middle East and Africa
Co-packaged Optics Market Regional Market Share
Geographic Coverage of Co-packaged Optics Market
Co-packaged Optics Market REPORT HIGHLIGHTS
| Aspects | Details |
|---|---|
| Study Period | 2020-2034 |
| Base Year | 2025 |
| Estimated Year | 2026 |
| Forecast Period | 2026-2034 |
| Historical Period | 2020-2025 |
| Growth Rate | CAGR of 47.12% from 2020-2034 |
| Segmentation |
|
Table of Contents
- 1. Introduction
- 1.1. Research Scope
- 1.2. Market Segmentation
- 1.3. Research Objective
- 1.4. Definitions and Assumptions
- 2. Executive Summary
- 2.1. Market Snapshot
- 3. Market Dynamics
- 3.1. Market Drivers
- 3.2. Market Restrains
- 3.3. Market Trends
- 3.4. Market Opportunities
- 4. Market Factor Analysis
- 4.1. Porters Five Forces
- 4.1.1. Bargaining Power of Suppliers
- 4.1.2. Bargaining Power of Buyers
- 4.1.3. Threat of New Entrants
- 4.1.4. Threat of Substitutes
- 4.1.5. Competitive Rivalry
- 4.2. PESTEL analysis
- 4.3. BCG Analysis
- 4.3.1. Stars (High Growth, High Market Share)
- 4.3.2. Cash Cows (Low Growth, High Market Share)
- 4.3.3. Question Mark (High Growth, Low Market Share)
- 4.3.4. Dogs (Low Growth, Low Market Share)
- 4.4. Ansoff Matrix Analysis
- 4.5. Supply Chain Analysis
- 4.6. Regulatory Landscape
- 4.7. Current Market Potential and Opportunity Assessment (TAM–SAM–SOM Framework)
- 4.8. NRP Analyst Note
- 4.1. Porters Five Forces
- 5. Market Analysis, Insights and Forecast 2021-2033
- 5.1. Market Analysis, Insights and Forecast - by Data Rates
- 5.1.1. Less than 1.6 T
- 5.1.2. 3.2 T
- 5.1.3. 6.4 T
- 5.2. Market Analysis, Insights and Forecast - by Region
- 5.2.1. North America
- 5.2.2. Europe
- 5.2.3. Asia
- 5.2.4. Australia and New Zealand
- 5.2.5. Latin America
- 5.2.6. Middle East and Africa
- 5.1. Market Analysis, Insights and Forecast - by Data Rates
- 6. Global Co-packaged Optics Market Analysis, Insights and Forecast, 2021-2033
- 6.1. Market Analysis, Insights and Forecast - by Data Rates
- 6.1.1. Less than 1.6 T
- 6.1.2. 3.2 T
- 6.1.3. 6.4 T
- 6.1. Market Analysis, Insights and Forecast - by Data Rates
- 7. North America Co-packaged Optics Market Analysis, Insights and Forecast, 2020-2032
- 7.1. Market Analysis, Insights and Forecast - by Data Rates
- 7.1.1. Less than 1.6 T
- 7.1.2. 3.2 T
- 7.1.3. 6.4 T
- 7.1. Market Analysis, Insights and Forecast - by Data Rates
- 8. Europe Co-packaged Optics Market Analysis, Insights and Forecast, 2020-2032
- 8.1. Market Analysis, Insights and Forecast - by Data Rates
- 8.1.1. Less than 1.6 T
- 8.1.2. 3.2 T
- 8.1.3. 6.4 T
- 8.1. Market Analysis, Insights and Forecast - by Data Rates
- 9. Asia Co-packaged Optics Market Analysis, Insights and Forecast, 2020-2032
- 9.1. Market Analysis, Insights and Forecast - by Data Rates
- 9.1.1. Less than 1.6 T
- 9.1.2. 3.2 T
- 9.1.3. 6.4 T
- 9.1. Market Analysis, Insights and Forecast - by Data Rates
- 10. Australia and New Zealand Co-packaged Optics Market Analysis, Insights and Forecast, 2020-2032
- 10.1. Market Analysis, Insights and Forecast - by Data Rates
- 10.1.1. Less than 1.6 T
- 10.1.2. 3.2 T
- 10.1.3. 6.4 T
- 10.1. Market Analysis, Insights and Forecast - by Data Rates
- 11. Latin America Co-packaged Optics Market Analysis, Insights and Forecast, 2020-2032
- 11.1. Market Analysis, Insights and Forecast - by Data Rates
- 11.1.1. Less than 1.6 T
- 11.1.2. 3.2 T
- 11.1.3. 6.4 T
- 11.1. Market Analysis, Insights and Forecast - by Data Rates
- 12. Middle East and Africa Co-packaged Optics Market Analysis, Insights and Forecast, 2020-2032
- 12.1. Market Analysis, Insights and Forecast - by Data Rates
- 12.1.1. Less than 1.6 T
- 12.1.2. 3.2 T
- 12.1.3. 6.4 T
- 12.1. Market Analysis, Insights and Forecast - by Data Rates
- 13. Competitive Analysis
- 13.1. Company Profiles
- 13.1.1 Furukawa Electric Co Ltd
- 13.1.1.1. Company Overview
- 13.1.1.2. Products
- 13.1.1.3. Company Financials
- 13.1.1.4. SWOT Analysis
- 13.1.2 IBM Corporation
- 13.1.2.1. Company Overview
- 13.1.2.2. Products
- 13.1.2.3. Company Financials
- 13.1.2.4. SWOT Analysis
- 13.1.3 Kyocera Corporation
- 13.1.3.1. Company Overview
- 13.1.3.2. Products
- 13.1.3.3. Company Financials
- 13.1.3.4. SWOT Analysis
- 13.1.4 TE Connectivity
- 13.1.4.1. Company Overview
- 13.1.4.2. Products
- 13.1.4.3. Company Financials
- 13.1.4.4. SWOT Analysis
- 13.1.5 Cisco Systems Inc
- 13.1.5.1. Company Overview
- 13.1.5.2. Products
- 13.1.5.3. Company Financials
- 13.1.5.4. SWOT Analysis
- 13.1.6 Broadcom Inc
- 13.1.6.1. Company Overview
- 13.1.6.2. Products
- 13.1.6.3. Company Financials
- 13.1.6.4. SWOT Analysis
- 13.1.7 Microsoft Corporation
- 13.1.7.1. Company Overview
- 13.1.7.2. Products
- 13.1.7.3. Company Financials
- 13.1.7.4. SWOT Analysis
- 13.1.8 Ayar Labs Inc
- 13.1.8.1. Company Overview
- 13.1.8.2. Products
- 13.1.8.3. Company Financials
- 13.1.8.4. SWOT Analysis
- 13.1.9 Huawei Technologies Co Ltd
- 13.1.9.1. Company Overview
- 13.1.9.2. Products
- 13.1.9.3. Company Financials
- 13.1.9.4. SWOT Analysis
- 13.1.10 SENKO Advanced Components Inc
- 13.1.10.1. Company Overview
- 13.1.10.2. Products
- 13.1.10.3. Company Financials
- 13.1.10.4. SWOT Analysis
- 13.1.11 Hisense Broadband Multimedia Technology Co Ltd
- 13.1.11.1. Company Overview
- 13.1.11.2. Products
- 13.1.11.3. Company Financials
- 13.1.11.4. SWOT Analysis
- 13.1.12 Sumitomo Electric Industries Lt
- 13.1.12.1. Company Overview
- 13.1.12.2. Products
- 13.1.12.3. Company Financials
- 13.1.12.4. SWOT Analysis
- 13.1.13 Intel Corporation
- 13.1.13.1. Company Overview
- 13.1.13.2. Products
- 13.1.13.3. Company Financials
- 13.1.13.4. SWOT Analysis
- 13.1.14 POET Technologies
- 13.1.14.1. Company Overview
- 13.1.14.2. Products
- 13.1.14.3. Company Financials
- 13.1.14.4. SWOT Analysis
- 13.1.1 Furukawa Electric Co Ltd
- 13.2. Market Entropy
- 13.2.1 Company's Key Areas Served
- 13.2.2 Recent Developments
- 13.3. Company Market Share Analysis 2025
- 13.3.1 Top 5 Companies Market Share Analysis
- 13.3.2 Top 3 Companies Market Share Analysis
- 13.4. List of Potential Customers
- 14. Research Methodology
List of Figures
- Figure 1: Global Co-packaged Optics Market Revenue Breakdown (Million, %) by Region 2025 & 2033
- Figure 2: Global Co-packaged Optics Market Volume Breakdown (K Unit, %) by Region 2025 & 2033
- Figure 3: North America Co-packaged Optics Market Revenue (Million), by Data Rates 2025 & 2033
- Figure 4: North America Co-packaged Optics Market Volume (K Unit), by Data Rates 2025 & 2033
- Figure 5: North America Co-packaged Optics Market Revenue Share (%), by Data Rates 2025 & 2033
- Figure 6: North America Co-packaged Optics Market Volume Share (%), by Data Rates 2025 & 2033
- Figure 7: North America Co-packaged Optics Market Revenue (Million), by Country 2025 & 2033
- Figure 8: North America Co-packaged Optics Market Volume (K Unit), by Country 2025 & 2033
- Figure 9: North America Co-packaged Optics Market Revenue Share (%), by Country 2025 & 2033
- Figure 10: North America Co-packaged Optics Market Volume Share (%), by Country 2025 & 2033
- Figure 11: Europe Co-packaged Optics Market Revenue (Million), by Data Rates 2025 & 2033
- Figure 12: Europe Co-packaged Optics Market Volume (K Unit), by Data Rates 2025 & 2033
- Figure 13: Europe Co-packaged Optics Market Revenue Share (%), by Data Rates 2025 & 2033
- Figure 14: Europe Co-packaged Optics Market Volume Share (%), by Data Rates 2025 & 2033
- Figure 15: Europe Co-packaged Optics Market Revenue (Million), by Country 2025 & 2033
- Figure 16: Europe Co-packaged Optics Market Volume (K Unit), by Country 2025 & 2033
- Figure 17: Europe Co-packaged Optics Market Revenue Share (%), by Country 2025 & 2033
- Figure 18: Europe Co-packaged Optics Market Volume Share (%), by Country 2025 & 2033
- Figure 19: Asia Co-packaged Optics Market Revenue (Million), by Data Rates 2025 & 2033
- Figure 20: Asia Co-packaged Optics Market Volume (K Unit), by Data Rates 2025 & 2033
- Figure 21: Asia Co-packaged Optics Market Revenue Share (%), by Data Rates 2025 & 2033
- Figure 22: Asia Co-packaged Optics Market Volume Share (%), by Data Rates 2025 & 2033
- Figure 23: Asia Co-packaged Optics Market Revenue (Million), by Country 2025 & 2033
- Figure 24: Asia Co-packaged Optics Market Volume (K Unit), by Country 2025 & 2033
- Figure 25: Asia Co-packaged Optics Market Revenue Share (%), by Country 2025 & 2033
- Figure 26: Asia Co-packaged Optics Market Volume Share (%), by Country 2025 & 2033
- Figure 27: Australia and New Zealand Co-packaged Optics Market Revenue (Million), by Data Rates 2025 & 2033
- Figure 28: Australia and New Zealand Co-packaged Optics Market Volume (K Unit), by Data Rates 2025 & 2033
- Figure 29: Australia and New Zealand Co-packaged Optics Market Revenue Share (%), by Data Rates 2025 & 2033
- Figure 30: Australia and New Zealand Co-packaged Optics Market Volume Share (%), by Data Rates 2025 & 2033
- Figure 31: Australia and New Zealand Co-packaged Optics Market Revenue (Million), by Country 2025 & 2033
- Figure 32: Australia and New Zealand Co-packaged Optics Market Volume (K Unit), by Country 2025 & 2033
- Figure 33: Australia and New Zealand Co-packaged Optics Market Revenue Share (%), by Country 2025 & 2033
- Figure 34: Australia and New Zealand Co-packaged Optics Market Volume Share (%), by Country 2025 & 2033
- Figure 35: Latin America Co-packaged Optics Market Revenue (Million), by Data Rates 2025 & 2033
- Figure 36: Latin America Co-packaged Optics Market Volume (K Unit), by Data Rates 2025 & 2033
- Figure 37: Latin America Co-packaged Optics Market Revenue Share (%), by Data Rates 2025 & 2033
- Figure 38: Latin America Co-packaged Optics Market Volume Share (%), by Data Rates 2025 & 2033
- Figure 39: Latin America Co-packaged Optics Market Revenue (Million), by Country 2025 & 2033
- Figure 40: Latin America Co-packaged Optics Market Volume (K Unit), by Country 2025 & 2033
- Figure 41: Latin America Co-packaged Optics Market Revenue Share (%), by Country 2025 & 2033
- Figure 42: Latin America Co-packaged Optics Market Volume Share (%), by Country 2025 & 2033
- Figure 43: Middle East and Africa Co-packaged Optics Market Revenue (Million), by Data Rates 2025 & 2033
- Figure 44: Middle East and Africa Co-packaged Optics Market Volume (K Unit), by Data Rates 2025 & 2033
- Figure 45: Middle East and Africa Co-packaged Optics Market Revenue Share (%), by Data Rates 2025 & 2033
- Figure 46: Middle East and Africa Co-packaged Optics Market Volume Share (%), by Data Rates 2025 & 2033
- Figure 47: Middle East and Africa Co-packaged Optics Market Revenue (Million), by Country 2025 & 2033
- Figure 48: Middle East and Africa Co-packaged Optics Market Volume (K Unit), by Country 2025 & 2033
- Figure 49: Middle East and Africa Co-packaged Optics Market Revenue Share (%), by Country 2025 & 2033
- Figure 50: Middle East and Africa Co-packaged Optics Market Volume Share (%), by Country 2025 & 2033
List of Tables
- Table 1: Global Co-packaged Optics Market Revenue Million Forecast, by Data Rates 2020 & 2033
- Table 2: Global Co-packaged Optics Market Volume K Unit Forecast, by Data Rates 2020 & 2033
- Table 3: Global Co-packaged Optics Market Revenue Million Forecast, by Region 2020 & 2033
- Table 4: Global Co-packaged Optics Market Volume K Unit Forecast, by Region 2020 & 2033
- Table 5: Global Co-packaged Optics Market Revenue Million Forecast, by Data Rates 2020 & 2033
- Table 6: Global Co-packaged Optics Market Volume K Unit Forecast, by Data Rates 2020 & 2033
- Table 7: Global Co-packaged Optics Market Revenue Million Forecast, by Country 2020 & 2033
- Table 8: Global Co-packaged Optics Market Volume K Unit Forecast, by Country 2020 & 2033
- Table 9: Global Co-packaged Optics Market Revenue Million Forecast, by Data Rates 2020 & 2033
- Table 10: Global Co-packaged Optics Market Volume K Unit Forecast, by Data Rates 2020 & 2033
- Table 11: Global Co-packaged Optics Market Revenue Million Forecast, by Country 2020 & 2033
- Table 12: Global Co-packaged Optics Market Volume K Unit Forecast, by Country 2020 & 2033
- Table 13: Global Co-packaged Optics Market Revenue Million Forecast, by Data Rates 2020 & 2033
- Table 14: Global Co-packaged Optics Market Volume K Unit Forecast, by Data Rates 2020 & 2033
- Table 15: Global Co-packaged Optics Market Revenue Million Forecast, by Country 2020 & 2033
- Table 16: Global Co-packaged Optics Market Volume K Unit Forecast, by Country 2020 & 2033
- Table 17: Global Co-packaged Optics Market Revenue Million Forecast, by Data Rates 2020 & 2033
- Table 18: Global Co-packaged Optics Market Volume K Unit Forecast, by Data Rates 2020 & 2033
- Table 19: Global Co-packaged Optics Market Revenue Million Forecast, by Country 2020 & 2033
- Table 20: Global Co-packaged Optics Market Volume K Unit Forecast, by Country 2020 & 2033
- Table 21: Global Co-packaged Optics Market Revenue Million Forecast, by Data Rates 2020 & 2033
- Table 22: Global Co-packaged Optics Market Volume K Unit Forecast, by Data Rates 2020 & 2033
- Table 23: Global Co-packaged Optics Market Revenue Million Forecast, by Country 2020 & 2033
- Table 24: Global Co-packaged Optics Market Volume K Unit Forecast, by Country 2020 & 2033
- Table 25: Global Co-packaged Optics Market Revenue Million Forecast, by Data Rates 2020 & 2033
- Table 26: Global Co-packaged Optics Market Volume K Unit Forecast, by Data Rates 2020 & 2033
- Table 27: Global Co-packaged Optics Market Revenue Million Forecast, by Country 2020 & 2033
- Table 28: Global Co-packaged Optics Market Volume K Unit Forecast, by Country 2020 & 2033
Frequently Asked Questions
1. What is the projected Compound Annual Growth Rate (CAGR) of the Co-packaged Optics Market?
The projected CAGR is approximately 47.12%.
2. Which companies are prominent players in the Co-packaged Optics Market?
Key companies in the market include Furukawa Electric Co Ltd, IBM Corporation, Kyocera Corporation, TE Connectivity, Cisco Systems Inc, Broadcom Inc, Microsoft Corporation, Ayar Labs Inc, Huawei Technologies Co Ltd, SENKO Advanced Components Inc, Hisense Broadband Multimedia Technology Co Ltd, Sumitomo Electric Industries Lt, Intel Corporation, POET Technologies.
3. What are the main segments of the Co-packaged Optics Market?
The market segments include Data Rates.
4. Can you provide details about the market size?
The market size is estimated to be USD 70.20 Million as of 2022.
5. What are some drivers contributing to market growth?
Increase in Adoption of Smart Devices and Rise in Data Traffic; Growth in the Importance of Mega Data Centers; Growth in High-performance Computing.
6. What are the notable trends driving market growth?
Growth in High-performance Computing.
7. Are there any restraints impacting market growth?
Increase in Network Complexity; Device Compatibility and Sustainability Issues.
8. Can you provide examples of recent developments in the market?
March 2024: Intel developed a 4 Tbps bidirectional fully integrated OCI chiplet based on Intel’s in-house silicon photonics technology. This chiplet, or tile, contains a single silicon photonics integrated circuit (PIC) with integrated lasers, an electrical IC (EIC), and a path to incorporate a detachable/re-usable optical connector. The purpose of this development is to address the AI infrastructure’s significant need for bandwidth and to enable future scalability.
9. What pricing options are available for accessing the report?
Pricing options include single-user, multi-user, and enterprise licenses priced at USD 4750, USD 5250, and USD 8750 respectively.
10. Is the market size provided in terms of value or volume?
The market size is provided in terms of value, measured in Million and volume, measured in K Unit.
11. Are there any specific market keywords associated with the report?
Yes, the market keyword associated with the report is "Co-packaged Optics Market," which aids in identifying and referencing the specific market segment covered.
12. How do I determine which pricing option suits my needs best?
The pricing options vary based on user requirements and access needs. Individual users may opt for single-user licenses, while businesses requiring broader access may choose multi-user or enterprise licenses for cost-effective access to the report.
13. Are there any additional resources or data provided in the Co-packaged Optics Market report?
While the report offers comprehensive insights, it's advisable to review the specific contents or supplementary materials provided to ascertain if additional resources or data are available.
14. How can I stay updated on further developments or reports in the Co-packaged Optics Market?
To stay informed about further developments, trends, and reports in the Co-packaged Optics Market, consider subscribing to industry newsletters, following relevant companies and organizations, or regularly checking reputable industry news sources and publications.
Methodology
Step 1 - Identification of Relevant Samples Size from Population Database


Step 2 - Approaches for Defining Global Market Size (Value, Volume* & Price*)

Note*: In applicable scenarios
Step 3 - Data Sources
Primary Research
- Web Analytics
- Survey Reports
- Research Institute
- Latest Research Reports
- Opinion Leaders
Secondary Research
- Annual Reports
- White Paper
- Latest Press Release
- Industry Association
- Paid Database
- Investor Presentations

Step 4 - Data Triangulation
Involves using different sources of information in order to increase the validity of a study
These sources are likely to be stakeholders in a program - participants, other researchers, program staff, other community members, and so on.
Then we put all data in single framework & apply various statistical tools to find out the dynamic on the market.
During the analysis stage, feedback from the stakeholder groups would be compared to determine areas of agreement as well as areas of divergence