

Key Insights
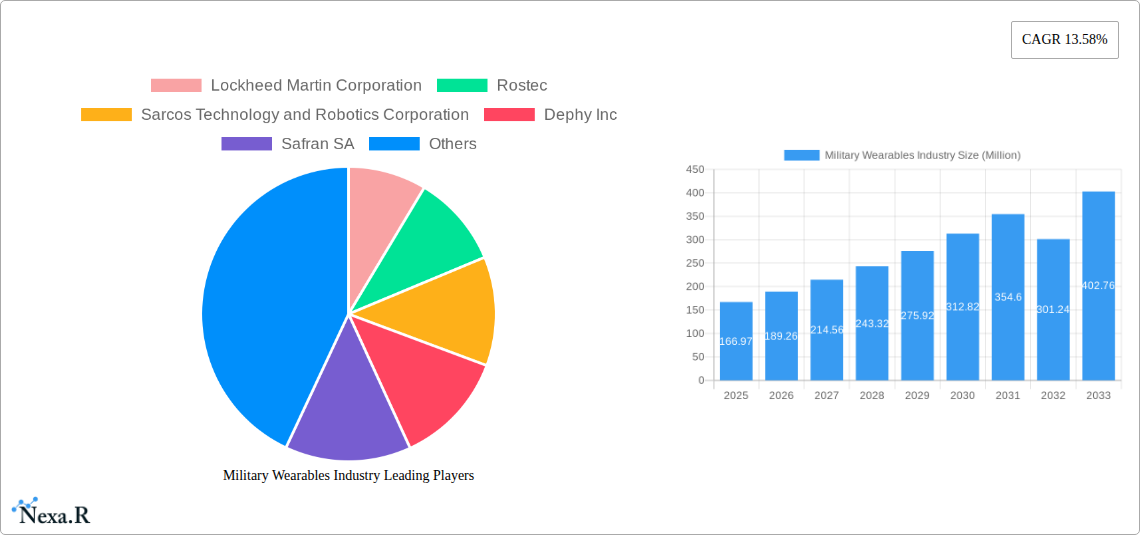
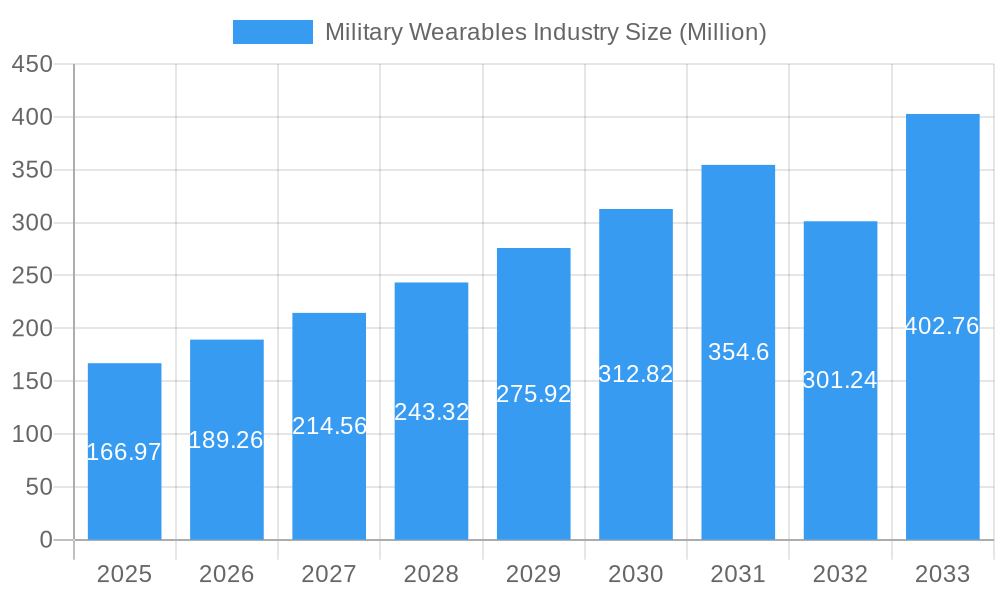
The military wearables market, valued at $166.97 million in 2025, is poised for significant growth, exhibiting a Compound Annual Growth Rate (CAGR) of 13.58% from 2025 to 2033. This expansion is driven by several key factors. Firstly, the increasing demand for enhanced soldier capabilities in modern warfare fuels the adoption of advanced technologies like exoskeletons for increased strength and endurance, and smart fabrics integrated with sensors for improved situational awareness and health monitoring. Secondly, ongoing technological advancements in areas such as miniaturization, improved battery life, and enhanced sensor technologies are leading to lighter, more efficient, and versatile military wearables. Governments worldwide are investing heavily in research and development to improve soldier protection and performance, further accelerating market growth. The market segmentation reveals a strong preference for full-body exoskeletons, offering comprehensive protection and functionality, and active exoskeletons, prioritizing power and operational efficiency over passive models. North America and Europe are currently leading the market due to high military spending and advanced technological capabilities; however, the Asia-Pacific region is predicted to witness substantial growth in the coming years due to increasing defense budgets and modernization efforts. Competition is fierce, with major players such as Lockheed Martin, Rostec, and Sarcos Robotics actively developing and deploying cutting-edge military wearable technologies.
Military Wearables Industry Market Size (In Million)
The market's growth trajectory is projected to continue strongly throughout the forecast period. Challenges remain, such as high initial investment costs for advanced technologies, potential integration issues with existing military equipment, and concerns surrounding the ethical implications of enhanced combat capabilities. However, ongoing innovation and the continuous drive to enhance operational efficiency and soldier safety will likely overcome these hurdles. The market is witnessing a shift towards more specialized and integrated systems, combining multiple functionalities within a single wearable device. This trend, along with increased adoption of data analytics and AI for enhanced decision-making, will significantly shape the future of the military wearables market. The key to success for companies in this sector lies in developing robust, reliable, and adaptable solutions that meet the evolving needs of modern military operations.
Military Wearables Industry Company Market Share
Military Wearables Industry Market Report: 2019-2033
This comprehensive report provides a detailed analysis of the Military Wearables market, encompassing market dynamics, growth trends, regional insights, product landscape, challenges, opportunities, and key players. The study period spans from 2019 to 2033, with a focus on the 2025-2033 forecast period. This report is crucial for industry professionals, investors, and strategists seeking a deep understanding of this rapidly evolving sector. The parent market is the broader military technology sector, while the child market focuses specifically on wearable technologies for military applications. The market is valued in Million units.
Military Wearables Industry Market Dynamics & Structure
The military wearables market is characterized by moderate concentration, with key players like Lockheed Martin Corporation, Rostec, and BAE Systems plc holding significant market share (estimated at xx% combined in 2025). Technological innovation, particularly in areas such as power source efficiency and sensor integration, is a key growth driver. Stringent regulatory frameworks regarding safety and performance standards influence market dynamics. Competition from traditional military equipment and the emergence of advanced materials act as substitutes. The end-user demographic largely comprises military personnel across various branches and specializations. M&A activity is relatively high, with an estimated xx deals in the past 5 years, mainly driven by consolidation and technology acquisition.
- Market Concentration: Moderately concentrated, with top 3 players holding xx% market share in 2025.
- Technological Innovation: Focus on enhanced power efficiency, miniaturization, and improved sensor integration.
- Regulatory Frameworks: Stringent safety and performance standards impacting product development and deployment.
- Competitive Substitutes: Traditional military equipment and advanced materials present competitive alternatives.
- End-User Demographics: Primarily military personnel across different branches and specializations.
- M&A Trends: xx M&A deals in the past 5 years, driven by consolidation and technology acquisition.
Military Wearables Industry Growth Trends & Insights
The global military wearables market exhibited a Compound Annual Growth Rate (CAGR) of xx% during the historical period (2019-2024) and is projected to maintain a CAGR of xx% from 2025 to 2033, reaching a market size of xx million units by 2033. This growth is fueled by increasing military spending, technological advancements leading to improved performance and functionality, and a growing recognition of the strategic advantages of wearable technology in enhancing soldier capabilities. Market penetration is currently at xx% and is expected to increase significantly by 2033 due to the adoption of advanced exoskeletons and sensor systems. Technological disruptions, particularly in areas such as AI and machine learning, are further accelerating market expansion.
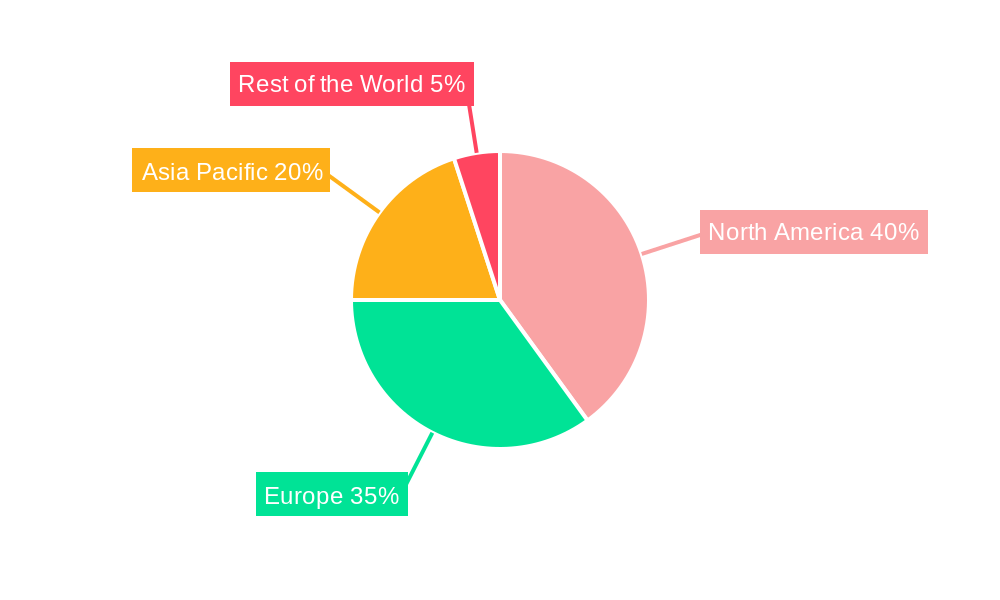
Dominant Regions, Countries, or Segments in Military Wearables Industry
The North American region currently dominates the military wearables market, holding a xx% market share in 2025, followed by Europe and Asia-Pacific. Within the segmentation:
- Type: The Full-body Exoskeleton segment is experiencing the fastest growth, driven by its capacity for enhanced mobility and protection.
- Power: Active Exoskeletons are gaining popularity due to their superior strength augmentation capabilities, albeit at a higher cost compared to passive counterparts.
Key Drivers for North American Dominance:
- High military spending
- Robust technological infrastructure
- Strong presence of key players and research institutions
Growth Potential in Asia-Pacific:
- Increasing military modernization efforts
- Rising demand for advanced military technologies
- Potential for cost-effective manufacturing
Military Wearables Industry Product Landscape
Military wearables encompass a range of products, from full-body and partial-body exoskeletons offering enhanced strength and endurance to advanced sensor systems providing real-time situational awareness. Active exoskeletons provide power assistance, while passive exoskeletons leverage user movement for support. Key innovations focus on weight reduction, improved ergonomics, increased battery life, and enhanced data integration capabilities. Unique selling propositions often revolve around superior mobility, protection, and enhanced situational awareness.
Key Drivers, Barriers & Challenges in Military Wearables Industry
Key Drivers:
- Increasing military expenditure globally.
- Technological advancements leading to improved performance and reliability.
- Growing demand for enhanced soldier capabilities on the battlefield.
- Need for improved situational awareness and communication.
Challenges and Restraints:
- High initial investment costs for advanced systems.
- Concerns about weight, size, and comfort of wearable devices.
- Potential for malfunctions or equipment failures in harsh environments.
- Supply chain disruptions impacting the availability of crucial components.
Emerging Opportunities in Military Wearables Industry
- Development of lightweight, energy-efficient exoskeletons for enhanced mobility.
- Integration of advanced sensor technologies for improved situational awareness.
- Expansion into new applications, such as medical evacuation and disaster relief.
- Growing demand for wearable systems with enhanced connectivity and data analytics capabilities.
Growth Accelerators in the Military Wearables Industry Industry
Technological advancements, particularly in materials science and power systems, are major growth accelerators. Strategic partnerships between technology companies and military organizations facilitate faster product development and deployment. Expansion into new markets, especially in developing countries with growing military budgets, also presents significant opportunities. Furthermore, the integration of AI and machine learning capabilities in wearables is expected to drive considerable growth.
Key Players Shaping the Military Wearables Industry Market
- Lockheed Martin Corporation
- Rostec
- Sarcos Technology and Robotics Corporation
- Dephy Inc
- Safran SA
- ASELSAN A S
- Mawashi Science & Technology
- SRI International
- BAE Systems plc
- Bionic Power Inc
Notable Milestones in Military Wearables Industry Sector
- September 2023: NCSIST unveils a new powered exoskeleton suit for wartime and disaster relief.
- August 2022: DEVCOM funds HeroWear and Vanderbilt University for SABER passive exoskeleton development.
- October 2021: Taiwan unveils a locally-made powered exoskeleton suit for military and disaster response.
In-Depth Military Wearables Industry Market Outlook
The future of the military wearables market looks promising, driven by continuous technological innovation and growing demand for advanced military technologies. Strategic partnerships and government investments will further stimulate growth. The focus on lighter, more efficient, and versatile wearable solutions will attract considerable investment and drive market expansion. The market is poised for significant growth, with opportunities for companies offering innovative products and solutions to address the evolving needs of the military.
Military Wearables Industry Segmentation
- 1. Production Analysis
- 2. Consumption Analysis
- 3. Import Market Analysis (Value & Volume)
- 4. Export Market Analysis (Value & Volume)
- 5. Price Trend Analysis
Military Wearables Industry Segmentation By Geography
-
1. North America
- 1.1. United States
- 1.2. Canada
- 1.3. Mexico
-
2. South America
- 2.1. Brazil
- 2.2. Argentina
- 2.3. Rest of South America
-
3. Europe
- 3.1. United Kingdom
- 3.2. Germany
- 3.3. France
- 3.4. Italy
- 3.5. Spain
- 3.6. Russia
- 3.7. Benelux
- 3.8. Nordics
- 3.9. Rest of Europe
-
4. Middle East & Africa
- 4.1. Turkey
- 4.2. Israel
- 4.3. GCC
- 4.4. North Africa
- 4.5. South Africa
- 4.6. Rest of Middle East & Africa
-
5. Asia Pacific
- 5.1. China
- 5.2. India
- 5.3. Japan
- 5.4. South Korea
- 5.5. ASEAN
- 5.6. Oceania
- 5.7. Rest of Asia Pacific
Military Wearables Industry Regional Market Share
Geographic Coverage of Military Wearables Industry
Military Wearables Industry REPORT HIGHLIGHTS
| Aspects | Details |
|---|---|
| Study Period | 2020-2034 |
| Base Year | 2025 |
| Estimated Year | 2026 |
| Forecast Period | 2026-2034 |
| Historical Period | 2020-2025 |
| Growth Rate | CAGR of 13.58% from 2020-2034 |
| Segmentation |
|
Table of Contents
- 1. Introduction
- 1.1. Research Scope
- 1.2. Market Segmentation
- 1.3. Research Objective
- 1.4. Definitions and Assumptions
- 2. Executive Summary
- 2.1. Market Snapshot
- 3. Market Dynamics
- 3.1. Market Drivers
- 3.2. Market Restrains
- 3.3. Market Trends
- 3.4. Market Opportunities
- 4. Market Factor Analysis
- 4.1. Porters Five Forces
- 4.1.1. Bargaining Power of Suppliers
- 4.1.2. Bargaining Power of Buyers
- 4.1.3. Threat of New Entrants
- 4.1.4. Threat of Substitutes
- 4.1.5. Competitive Rivalry
- 4.2. PESTEL analysis
- 4.3. BCG Analysis
- 4.3.1. Stars (High Growth, High Market Share)
- 4.3.2. Cash Cows (Low Growth, High Market Share)
- 4.3.3. Question Mark (High Growth, Low Market Share)
- 4.3.4. Dogs (Low Growth, Low Market Share)
- 4.4. Ansoff Matrix Analysis
- 4.5. Supply Chain Analysis
- 4.6. Regulatory Landscape
- 4.7. Current Market Potential and Opportunity Assessment (TAM–SAM–SOM Framework)
- 4.8. NRP Analyst Note
- 4.1. Porters Five Forces
- 5. Market Analysis, Insights and Forecast 2021-2033
- 5.1. Market Analysis, Insights and Forecast - by Production Analysis
- 5.2. Market Analysis, Insights and Forecast - by Consumption Analysis
- 5.3. Market Analysis, Insights and Forecast - by Import Market Analysis (Value & Volume)
- 5.4. Market Analysis, Insights and Forecast - by Export Market Analysis (Value & Volume)
- 5.5. Market Analysis, Insights and Forecast - by Price Trend Analysis
- 5.6. Market Analysis, Insights and Forecast - by Region
- 5.6.1. North America
- 5.6.2. South America
- 5.6.3. Europe
- 5.6.4. Middle East & Africa
- 5.6.5. Asia Pacific
- 6. Global Military Wearables Industry Analysis, Insights and Forecast, 2021-2033
- 6.1. Market Analysis, Insights and Forecast - by Production Analysis
- 6.2. Market Analysis, Insights and Forecast - by Consumption Analysis
- 6.3. Market Analysis, Insights and Forecast - by Import Market Analysis (Value & Volume)
- 6.4. Market Analysis, Insights and Forecast - by Export Market Analysis (Value & Volume)
- 6.5. Market Analysis, Insights and Forecast - by Price Trend Analysis
- 7. North America Military Wearables Industry Analysis, Insights and Forecast, 2020-2032
- 7.1. Market Analysis, Insights and Forecast - by Production Analysis
- 7.2. Market Analysis, Insights and Forecast - by Consumption Analysis
- 7.3. Market Analysis, Insights and Forecast - by Import Market Analysis (Value & Volume)
- 7.4. Market Analysis, Insights and Forecast - by Export Market Analysis (Value & Volume)
- 7.5. Market Analysis, Insights and Forecast - by Price Trend Analysis
- 8. South America Military Wearables Industry Analysis, Insights and Forecast, 2020-2032
- 8.1. Market Analysis, Insights and Forecast - by Production Analysis
- 8.2. Market Analysis, Insights and Forecast - by Consumption Analysis
- 8.3. Market Analysis, Insights and Forecast - by Import Market Analysis (Value & Volume)
- 8.4. Market Analysis, Insights and Forecast - by Export Market Analysis (Value & Volume)
- 8.5. Market Analysis, Insights and Forecast - by Price Trend Analysis
- 9. Europe Military Wearables Industry Analysis, Insights and Forecast, 2020-2032
- 9.1. Market Analysis, Insights and Forecast - by Production Analysis
- 9.2. Market Analysis, Insights and Forecast - by Consumption Analysis
- 9.3. Market Analysis, Insights and Forecast - by Import Market Analysis (Value & Volume)
- 9.4. Market Analysis, Insights and Forecast - by Export Market Analysis (Value & Volume)
- 9.5. Market Analysis, Insights and Forecast - by Price Trend Analysis
- 10. Middle East & Africa Military Wearables Industry Analysis, Insights and Forecast, 2020-2032
- 10.1. Market Analysis, Insights and Forecast - by Production Analysis
- 10.2. Market Analysis, Insights and Forecast - by Consumption Analysis
- 10.3. Market Analysis, Insights and Forecast - by Import Market Analysis (Value & Volume)
- 10.4. Market Analysis, Insights and Forecast - by Export Market Analysis (Value & Volume)
- 10.5. Market Analysis, Insights and Forecast - by Price Trend Analysis
- 11. Asia Pacific Military Wearables Industry Analysis, Insights and Forecast, 2020-2032
- 11.1. Market Analysis, Insights and Forecast - by Production Analysis
- 11.2. Market Analysis, Insights and Forecast - by Consumption Analysis
- 11.3. Market Analysis, Insights and Forecast - by Import Market Analysis (Value & Volume)
- 11.4. Market Analysis, Insights and Forecast - by Export Market Analysis (Value & Volume)
- 11.5. Market Analysis, Insights and Forecast - by Price Trend Analysis
- 12. Competitive Analysis
- 12.1. Company Profiles
- 12.1.1 Lockheed Martin Corporation
- 12.1.1.1. Company Overview
- 12.1.1.2. Products
- 12.1.1.3. Company Financials
- 12.1.1.4. SWOT Analysis
- 12.1.2 Rostec
- 12.1.2.1. Company Overview
- 12.1.2.2. Products
- 12.1.2.3. Company Financials
- 12.1.2.4. SWOT Analysis
- 12.1.3 Sarcos Technology and Robotics Corporation
- 12.1.3.1. Company Overview
- 12.1.3.2. Products
- 12.1.3.3. Company Financials
- 12.1.3.4. SWOT Analysis
- 12.1.4 Dephy Inc
- 12.1.4.1. Company Overview
- 12.1.4.2. Products
- 12.1.4.3. Company Financials
- 12.1.4.4. SWOT Analysis
- 12.1.5 Safran SA
- 12.1.5.1. Company Overview
- 12.1.5.2. Products
- 12.1.5.3. Company Financials
- 12.1.5.4. SWOT Analysis
- 12.1.6 ASELSAN A S
- 12.1.6.1. Company Overview
- 12.1.6.2. Products
- 12.1.6.3. Company Financials
- 12.1.6.4. SWOT Analysis
- 12.1.7 Mawashi Science & Technology
- 12.1.7.1. Company Overview
- 12.1.7.2. Products
- 12.1.7.3. Company Financials
- 12.1.7.4. SWOT Analysis
- 12.1.8 SRI Internationa
- 12.1.8.1. Company Overview
- 12.1.8.2. Products
- 12.1.8.3. Company Financials
- 12.1.8.4. SWOT Analysis
- 12.1.9 BAE Systems plc
- 12.1.9.1. Company Overview
- 12.1.9.2. Products
- 12.1.9.3. Company Financials
- 12.1.9.4. SWOT Analysis
- 12.1.10 Bionic Power Inc
- 12.1.10.1. Company Overview
- 12.1.10.2. Products
- 12.1.10.3. Company Financials
- 12.1.10.4. SWOT Analysis
- 12.1.1 Lockheed Martin Corporation
- 12.2. Market Entropy
- 12.2.1 Company's Key Areas Served
- 12.2.2 Recent Developments
- 12.3. Company Market Share Analysis 2025
- 12.3.1 Top 5 Companies Market Share Analysis
- 12.3.2 Top 3 Companies Market Share Analysis
- 12.4. List of Potential Customers
- 13. Research Methodology
List of Figures
- Figure 1: Global Military Wearables Industry Revenue Breakdown (Million, %) by Region 2025 & 2033
- Figure 2: North America Military Wearables Industry Revenue (Million), by Production Analysis 2025 & 2033
- Figure 3: North America Military Wearables Industry Revenue Share (%), by Production Analysis 2025 & 2033
- Figure 4: North America Military Wearables Industry Revenue (Million), by Consumption Analysis 2025 & 2033
- Figure 5: North America Military Wearables Industry Revenue Share (%), by Consumption Analysis 2025 & 2033
- Figure 6: North America Military Wearables Industry Revenue (Million), by Import Market Analysis (Value & Volume) 2025 & 2033
- Figure 7: North America Military Wearables Industry Revenue Share (%), by Import Market Analysis (Value & Volume) 2025 & 2033
- Figure 8: North America Military Wearables Industry Revenue (Million), by Export Market Analysis (Value & Volume) 2025 & 2033
- Figure 9: North America Military Wearables Industry Revenue Share (%), by Export Market Analysis (Value & Volume) 2025 & 2033
- Figure 10: North America Military Wearables Industry Revenue (Million), by Price Trend Analysis 2025 & 2033
- Figure 11: North America Military Wearables Industry Revenue Share (%), by Price Trend Analysis 2025 & 2033
- Figure 12: North America Military Wearables Industry Revenue (Million), by Country 2025 & 2033
- Figure 13: North America Military Wearables Industry Revenue Share (%), by Country 2025 & 2033
- Figure 14: South America Military Wearables Industry Revenue (Million), by Production Analysis 2025 & 2033
- Figure 15: South America Military Wearables Industry Revenue Share (%), by Production Analysis 2025 & 2033
- Figure 16: South America Military Wearables Industry Revenue (Million), by Consumption Analysis 2025 & 2033
- Figure 17: South America Military Wearables Industry Revenue Share (%), by Consumption Analysis 2025 & 2033
- Figure 18: South America Military Wearables Industry Revenue (Million), by Import Market Analysis (Value & Volume) 2025 & 2033
- Figure 19: South America Military Wearables Industry Revenue Share (%), by Import Market Analysis (Value & Volume) 2025 & 2033
- Figure 20: South America Military Wearables Industry Revenue (Million), by Export Market Analysis (Value & Volume) 2025 & 2033
- Figure 21: South America Military Wearables Industry Revenue Share (%), by Export Market Analysis (Value & Volume) 2025 & 2033
- Figure 22: South America Military Wearables Industry Revenue (Million), by Price Trend Analysis 2025 & 2033
- Figure 23: South America Military Wearables Industry Revenue Share (%), by Price Trend Analysis 2025 & 2033
- Figure 24: South America Military Wearables Industry Revenue (Million), by Country 2025 & 2033
- Figure 25: South America Military Wearables Industry Revenue Share (%), by Country 2025 & 2033
- Figure 26: Europe Military Wearables Industry Revenue (Million), by Production Analysis 2025 & 2033
- Figure 27: Europe Military Wearables Industry Revenue Share (%), by Production Analysis 2025 & 2033
- Figure 28: Europe Military Wearables Industry Revenue (Million), by Consumption Analysis 2025 & 2033
- Figure 29: Europe Military Wearables Industry Revenue Share (%), by Consumption Analysis 2025 & 2033
- Figure 30: Europe Military Wearables Industry Revenue (Million), by Import Market Analysis (Value & Volume) 2025 & 2033
- Figure 31: Europe Military Wearables Industry Revenue Share (%), by Import Market Analysis (Value & Volume) 2025 & 2033
- Figure 32: Europe Military Wearables Industry Revenue (Million), by Export Market Analysis (Value & Volume) 2025 & 2033
- Figure 33: Europe Military Wearables Industry Revenue Share (%), by Export Market Analysis (Value & Volume) 2025 & 2033
- Figure 34: Europe Military Wearables Industry Revenue (Million), by Price Trend Analysis 2025 & 2033
- Figure 35: Europe Military Wearables Industry Revenue Share (%), by Price Trend Analysis 2025 & 2033
- Figure 36: Europe Military Wearables Industry Revenue (Million), by Country 2025 & 2033
- Figure 37: Europe Military Wearables Industry Revenue Share (%), by Country 2025 & 2033
- Figure 38: Middle East & Africa Military Wearables Industry Revenue (Million), by Production Analysis 2025 & 2033
- Figure 39: Middle East & Africa Military Wearables Industry Revenue Share (%), by Production Analysis 2025 & 2033
- Figure 40: Middle East & Africa Military Wearables Industry Revenue (Million), by Consumption Analysis 2025 & 2033
- Figure 41: Middle East & Africa Military Wearables Industry Revenue Share (%), by Consumption Analysis 2025 & 2033
- Figure 42: Middle East & Africa Military Wearables Industry Revenue (Million), by Import Market Analysis (Value & Volume) 2025 & 2033
- Figure 43: Middle East & Africa Military Wearables Industry Revenue Share (%), by Import Market Analysis (Value & Volume) 2025 & 2033
- Figure 44: Middle East & Africa Military Wearables Industry Revenue (Million), by Export Market Analysis (Value & Volume) 2025 & 2033
- Figure 45: Middle East & Africa Military Wearables Industry Revenue Share (%), by Export Market Analysis (Value & Volume) 2025 & 2033
- Figure 46: Middle East & Africa Military Wearables Industry Revenue (Million), by Price Trend Analysis 2025 & 2033
- Figure 47: Middle East & Africa Military Wearables Industry Revenue Share (%), by Price Trend Analysis 2025 & 2033
- Figure 48: Middle East & Africa Military Wearables Industry Revenue (Million), by Country 2025 & 2033
- Figure 49: Middle East & Africa Military Wearables Industry Revenue Share (%), by Country 2025 & 2033
- Figure 50: Asia Pacific Military Wearables Industry Revenue (Million), by Production Analysis 2025 & 2033
- Figure 51: Asia Pacific Military Wearables Industry Revenue Share (%), by Production Analysis 2025 & 2033
- Figure 52: Asia Pacific Military Wearables Industry Revenue (Million), by Consumption Analysis 2025 & 2033
- Figure 53: Asia Pacific Military Wearables Industry Revenue Share (%), by Consumption Analysis 2025 & 2033
- Figure 54: Asia Pacific Military Wearables Industry Revenue (Million), by Import Market Analysis (Value & Volume) 2025 & 2033
- Figure 55: Asia Pacific Military Wearables Industry Revenue Share (%), by Import Market Analysis (Value & Volume) 2025 & 2033
- Figure 56: Asia Pacific Military Wearables Industry Revenue (Million), by Export Market Analysis (Value & Volume) 2025 & 2033
- Figure 57: Asia Pacific Military Wearables Industry Revenue Share (%), by Export Market Analysis (Value & Volume) 2025 & 2033
- Figure 58: Asia Pacific Military Wearables Industry Revenue (Million), by Price Trend Analysis 2025 & 2033
- Figure 59: Asia Pacific Military Wearables Industry Revenue Share (%), by Price Trend Analysis 2025 & 2033
- Figure 60: Asia Pacific Military Wearables Industry Revenue (Million), by Country 2025 & 2033
- Figure 61: Asia Pacific Military Wearables Industry Revenue Share (%), by Country 2025 & 2033
List of Tables
- Table 1: Global Military Wearables Industry Revenue Million Forecast, by Production Analysis 2020 & 2033
- Table 2: Global Military Wearables Industry Revenue Million Forecast, by Consumption Analysis 2020 & 2033
- Table 3: Global Military Wearables Industry Revenue Million Forecast, by Import Market Analysis (Value & Volume) 2020 & 2033
- Table 4: Global Military Wearables Industry Revenue Million Forecast, by Export Market Analysis (Value & Volume) 2020 & 2033
- Table 5: Global Military Wearables Industry Revenue Million Forecast, by Price Trend Analysis 2020 & 2033
- Table 6: Global Military Wearables Industry Revenue Million Forecast, by Region 2020 & 2033
- Table 7: Global Military Wearables Industry Revenue Million Forecast, by Production Analysis 2020 & 2033
- Table 8: Global Military Wearables Industry Revenue Million Forecast, by Consumption Analysis 2020 & 2033
- Table 9: Global Military Wearables Industry Revenue Million Forecast, by Import Market Analysis (Value & Volume) 2020 & 2033
- Table 10: Global Military Wearables Industry Revenue Million Forecast, by Export Market Analysis (Value & Volume) 2020 & 2033
- Table 11: Global Military Wearables Industry Revenue Million Forecast, by Price Trend Analysis 2020 & 2033
- Table 12: Global Military Wearables Industry Revenue Million Forecast, by Country 2020 & 2033
- Table 13: United States Military Wearables Industry Revenue (Million) Forecast, by Application 2020 & 2033
- Table 14: Canada Military Wearables Industry Revenue (Million) Forecast, by Application 2020 & 2033
- Table 15: Mexico Military Wearables Industry Revenue (Million) Forecast, by Application 2020 & 2033
- Table 16: Global Military Wearables Industry Revenue Million Forecast, by Production Analysis 2020 & 2033
- Table 17: Global Military Wearables Industry Revenue Million Forecast, by Consumption Analysis 2020 & 2033
- Table 18: Global Military Wearables Industry Revenue Million Forecast, by Import Market Analysis (Value & Volume) 2020 & 2033
- Table 19: Global Military Wearables Industry Revenue Million Forecast, by Export Market Analysis (Value & Volume) 2020 & 2033
- Table 20: Global Military Wearables Industry Revenue Million Forecast, by Price Trend Analysis 2020 & 2033
- Table 21: Global Military Wearables Industry Revenue Million Forecast, by Country 2020 & 2033
- Table 22: Brazil Military Wearables Industry Revenue (Million) Forecast, by Application 2020 & 2033
- Table 23: Argentina Military Wearables Industry Revenue (Million) Forecast, by Application 2020 & 2033
- Table 24: Rest of South America Military Wearables Industry Revenue (Million) Forecast, by Application 2020 & 2033
- Table 25: Global Military Wearables Industry Revenue Million Forecast, by Production Analysis 2020 & 2033
- Table 26: Global Military Wearables Industry Revenue Million Forecast, by Consumption Analysis 2020 & 2033
- Table 27: Global Military Wearables Industry Revenue Million Forecast, by Import Market Analysis (Value & Volume) 2020 & 2033
- Table 28: Global Military Wearables Industry Revenue Million Forecast, by Export Market Analysis (Value & Volume) 2020 & 2033
- Table 29: Global Military Wearables Industry Revenue Million Forecast, by Price Trend Analysis 2020 & 2033
- Table 30: Global Military Wearables Industry Revenue Million Forecast, by Country 2020 & 2033
- Table 31: United Kingdom Military Wearables Industry Revenue (Million) Forecast, by Application 2020 & 2033
- Table 32: Germany Military Wearables Industry Revenue (Million) Forecast, by Application 2020 & 2033
- Table 33: France Military Wearables Industry Revenue (Million) Forecast, by Application 2020 & 2033
- Table 34: Italy Military Wearables Industry Revenue (Million) Forecast, by Application 2020 & 2033
- Table 35: Spain Military Wearables Industry Revenue (Million) Forecast, by Application 2020 & 2033
- Table 36: Russia Military Wearables Industry Revenue (Million) Forecast, by Application 2020 & 2033
- Table 37: Benelux Military Wearables Industry Revenue (Million) Forecast, by Application 2020 & 2033
- Table 38: Nordics Military Wearables Industry Revenue (Million) Forecast, by Application 2020 & 2033
- Table 39: Rest of Europe Military Wearables Industry Revenue (Million) Forecast, by Application 2020 & 2033
- Table 40: Global Military Wearables Industry Revenue Million Forecast, by Production Analysis 2020 & 2033
- Table 41: Global Military Wearables Industry Revenue Million Forecast, by Consumption Analysis 2020 & 2033
- Table 42: Global Military Wearables Industry Revenue Million Forecast, by Import Market Analysis (Value & Volume) 2020 & 2033
- Table 43: Global Military Wearables Industry Revenue Million Forecast, by Export Market Analysis (Value & Volume) 2020 & 2033
- Table 44: Global Military Wearables Industry Revenue Million Forecast, by Price Trend Analysis 2020 & 2033
- Table 45: Global Military Wearables Industry Revenue Million Forecast, by Country 2020 & 2033
- Table 46: Turkey Military Wearables Industry Revenue (Million) Forecast, by Application 2020 & 2033
- Table 47: Israel Military Wearables Industry Revenue (Million) Forecast, by Application 2020 & 2033
- Table 48: GCC Military Wearables Industry Revenue (Million) Forecast, by Application 2020 & 2033
- Table 49: North Africa Military Wearables Industry Revenue (Million) Forecast, by Application 2020 & 2033
- Table 50: South Africa Military Wearables Industry Revenue (Million) Forecast, by Application 2020 & 2033
- Table 51: Rest of Middle East & Africa Military Wearables Industry Revenue (Million) Forecast, by Application 2020 & 2033
- Table 52: Global Military Wearables Industry Revenue Million Forecast, by Production Analysis 2020 & 2033
- Table 53: Global Military Wearables Industry Revenue Million Forecast, by Consumption Analysis 2020 & 2033
- Table 54: Global Military Wearables Industry Revenue Million Forecast, by Import Market Analysis (Value & Volume) 2020 & 2033
- Table 55: Global Military Wearables Industry Revenue Million Forecast, by Export Market Analysis (Value & Volume) 2020 & 2033
- Table 56: Global Military Wearables Industry Revenue Million Forecast, by Price Trend Analysis 2020 & 2033
- Table 57: Global Military Wearables Industry Revenue Million Forecast, by Country 2020 & 2033
- Table 58: China Military Wearables Industry Revenue (Million) Forecast, by Application 2020 & 2033
- Table 59: India Military Wearables Industry Revenue (Million) Forecast, by Application 2020 & 2033
- Table 60: Japan Military Wearables Industry Revenue (Million) Forecast, by Application 2020 & 2033
- Table 61: South Korea Military Wearables Industry Revenue (Million) Forecast, by Application 2020 & 2033
- Table 62: ASEAN Military Wearables Industry Revenue (Million) Forecast, by Application 2020 & 2033
- Table 63: Oceania Military Wearables Industry Revenue (Million) Forecast, by Application 2020 & 2033
- Table 64: Rest of Asia Pacific Military Wearables Industry Revenue (Million) Forecast, by Application 2020 & 2033
Frequently Asked Questions
1. What is the projected Compound Annual Growth Rate (CAGR) of the Military Wearables Industry?
The projected CAGR is approximately 13.58%.
2. Which companies are prominent players in the Military Wearables Industry?
Key companies in the market include Lockheed Martin Corporation, Rostec, Sarcos Technology and Robotics Corporation, Dephy Inc, Safran SA, ASELSAN A S, Mawashi Science & Technology, SRI Internationa, BAE Systems plc, Bionic Power Inc.
3. What are the main segments of the Military Wearables Industry?
The market segments include Production Analysis, Consumption Analysis, Import Market Analysis (Value & Volume), Export Market Analysis (Value & Volume), Price Trend Analysis.
4. Can you provide details about the market size?
The market size is estimated to be USD 166.97 Million as of 2022.
5. What are some drivers contributing to market growth?
N/A
6. What are the notable trends driving market growth?
The Active Exoskeleton Segment is Expected to Witness the Highest Growth During the Forecast Period.
7. Are there any restraints impacting market growth?
N/A
8. Can you provide examples of recent developments in the market?
September 2023: The National Chung-Shan Institute of Science and Technology (NCSIST) unveiled the latest version of its in-development locally-made powered exoskeleton suit, which is a mechanized wearable system designed to be used in wartime or during post-disaster rescue and relief missions. The exoskeleton delivers the right torque at the right time to assist knee flexion and extension to reduce the energy wearers expend when crossing terrain, squatting, or kneeling, and to increase mobility and reduce fatigue.
9. What pricing options are available for accessing the report?
Pricing options include single-user, multi-user, and enterprise licenses priced at USD 4750, USD 5250, and USD 8750 respectively.
10. Is the market size provided in terms of value or volume?
The market size is provided in terms of value, measured in Million.
11. Are there any specific market keywords associated with the report?
Yes, the market keyword associated with the report is "Military Wearables Industry," which aids in identifying and referencing the specific market segment covered.
12. How do I determine which pricing option suits my needs best?
The pricing options vary based on user requirements and access needs. Individual users may opt for single-user licenses, while businesses requiring broader access may choose multi-user or enterprise licenses for cost-effective access to the report.
13. Are there any additional resources or data provided in the Military Wearables Industry report?
While the report offers comprehensive insights, it's advisable to review the specific contents or supplementary materials provided to ascertain if additional resources or data are available.
14. How can I stay updated on further developments or reports in the Military Wearables Industry?
To stay informed about further developments, trends, and reports in the Military Wearables Industry, consider subscribing to industry newsletters, following relevant companies and organizations, or regularly checking reputable industry news sources and publications.
Methodology
Step 1 - Identification of Relevant Samples Size from Population Database


Step 2 - Approaches for Defining Global Market Size (Value, Volume* & Price*)

Note*: In applicable scenarios
Step 3 - Data Sources
Primary Research
- Web Analytics
- Survey Reports
- Research Institute
- Latest Research Reports
- Opinion Leaders
Secondary Research
- Annual Reports
- White Paper
- Latest Press Release
- Industry Association
- Paid Database
- Investor Presentations

Step 4 - Data Triangulation
Involves using different sources of information in order to increase the validity of a study
These sources are likely to be stakeholders in a program - participants, other researchers, program staff, other community members, and so on.
Then we put all data in single framework & apply various statistical tools to find out the dynamic on the market.
During the analysis stage, feedback from the stakeholder groups would be compared to determine areas of agreement as well as areas of divergence