

Key Insights
The North America remote sensing satellites market is poised for substantial growth, projecting a compound annual growth rate (CAGR) of 11.59%. The market size is estimated to reach $25.37 billion by the base year, 2025. This expansion is propelled by escalating demand for high-resolution imagery across commercial, defense, and governmental sectors, alongside significant technological advancements. Innovations in satellite technology are yielding more compact, cost-effective, and higher-performing satellites, broadening accessibility for diverse users. The increasing need for precise geospatial data in applications such as precision agriculture, urban planning, environmental monitoring, and disaster management further fuels market demand. Government initiatives supporting space exploration and national security also play a crucial role in market expansion. Key market segments include satellite mass (with 100-500kg and 500-1000kg segments anticipated to lead), orbit class (Low Earth Orbit (LEO) is expected to dominate due to cost-efficiency and rapid data acquisition), and satellite subsystems (Propulsion Hardware and Propellant, Satellite Bus & Subsystems, and Solar Array & Power Hardware are vital components). Intense competition exists among established players like Lockheed Martin and Northrop Grumman, and emerging companies such as Planet Labs and Spire Global. Despite challenges including rising launch costs and regulatory complexities, the market outlook remains robust, driven by continuous technological innovation and a growing demand for geospatial intelligence.
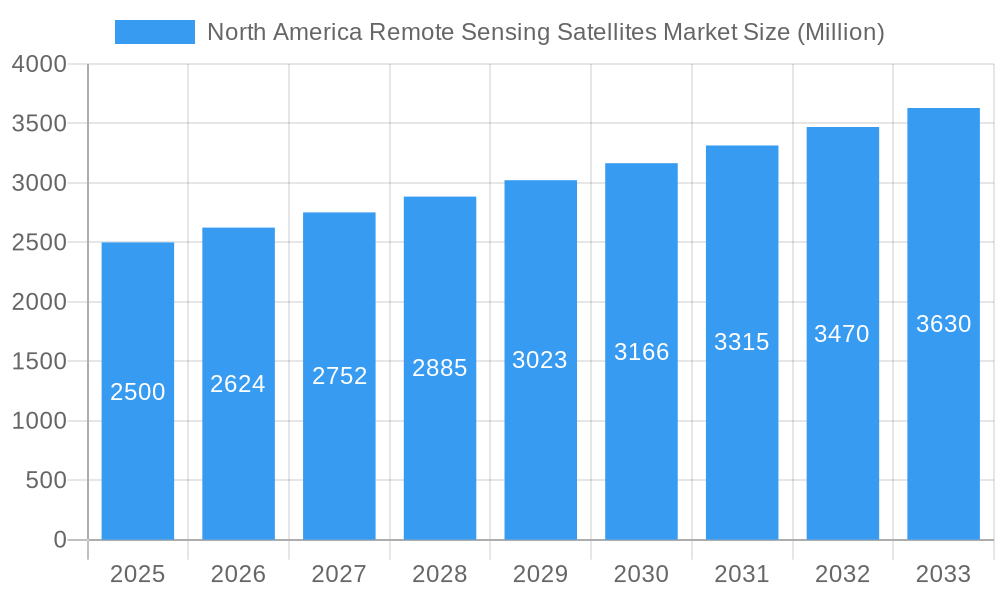
North America Remote Sensing Satellites Market Market Size (In Billion)
The North American region, led by the United States, commands a significant share of the global remote sensing satellites market, attributed to its advanced technological infrastructure, comprehensive space capabilities, and substantial investments in defense and intelligence. Canada and Mexico also contribute to the regional market. The market is projected to continue its upward trajectory, fueled by ongoing technological advancements and expanding applications across various industries. Factors such as the cyclical nature of government expenditure and potential competition from alternative geospatial data sources require careful consideration. The forecast period of 2025-2033 anticipates sustained growth, with the exact pace influenced by technological breakthroughs, regulatory shifts, and overall economic conditions.
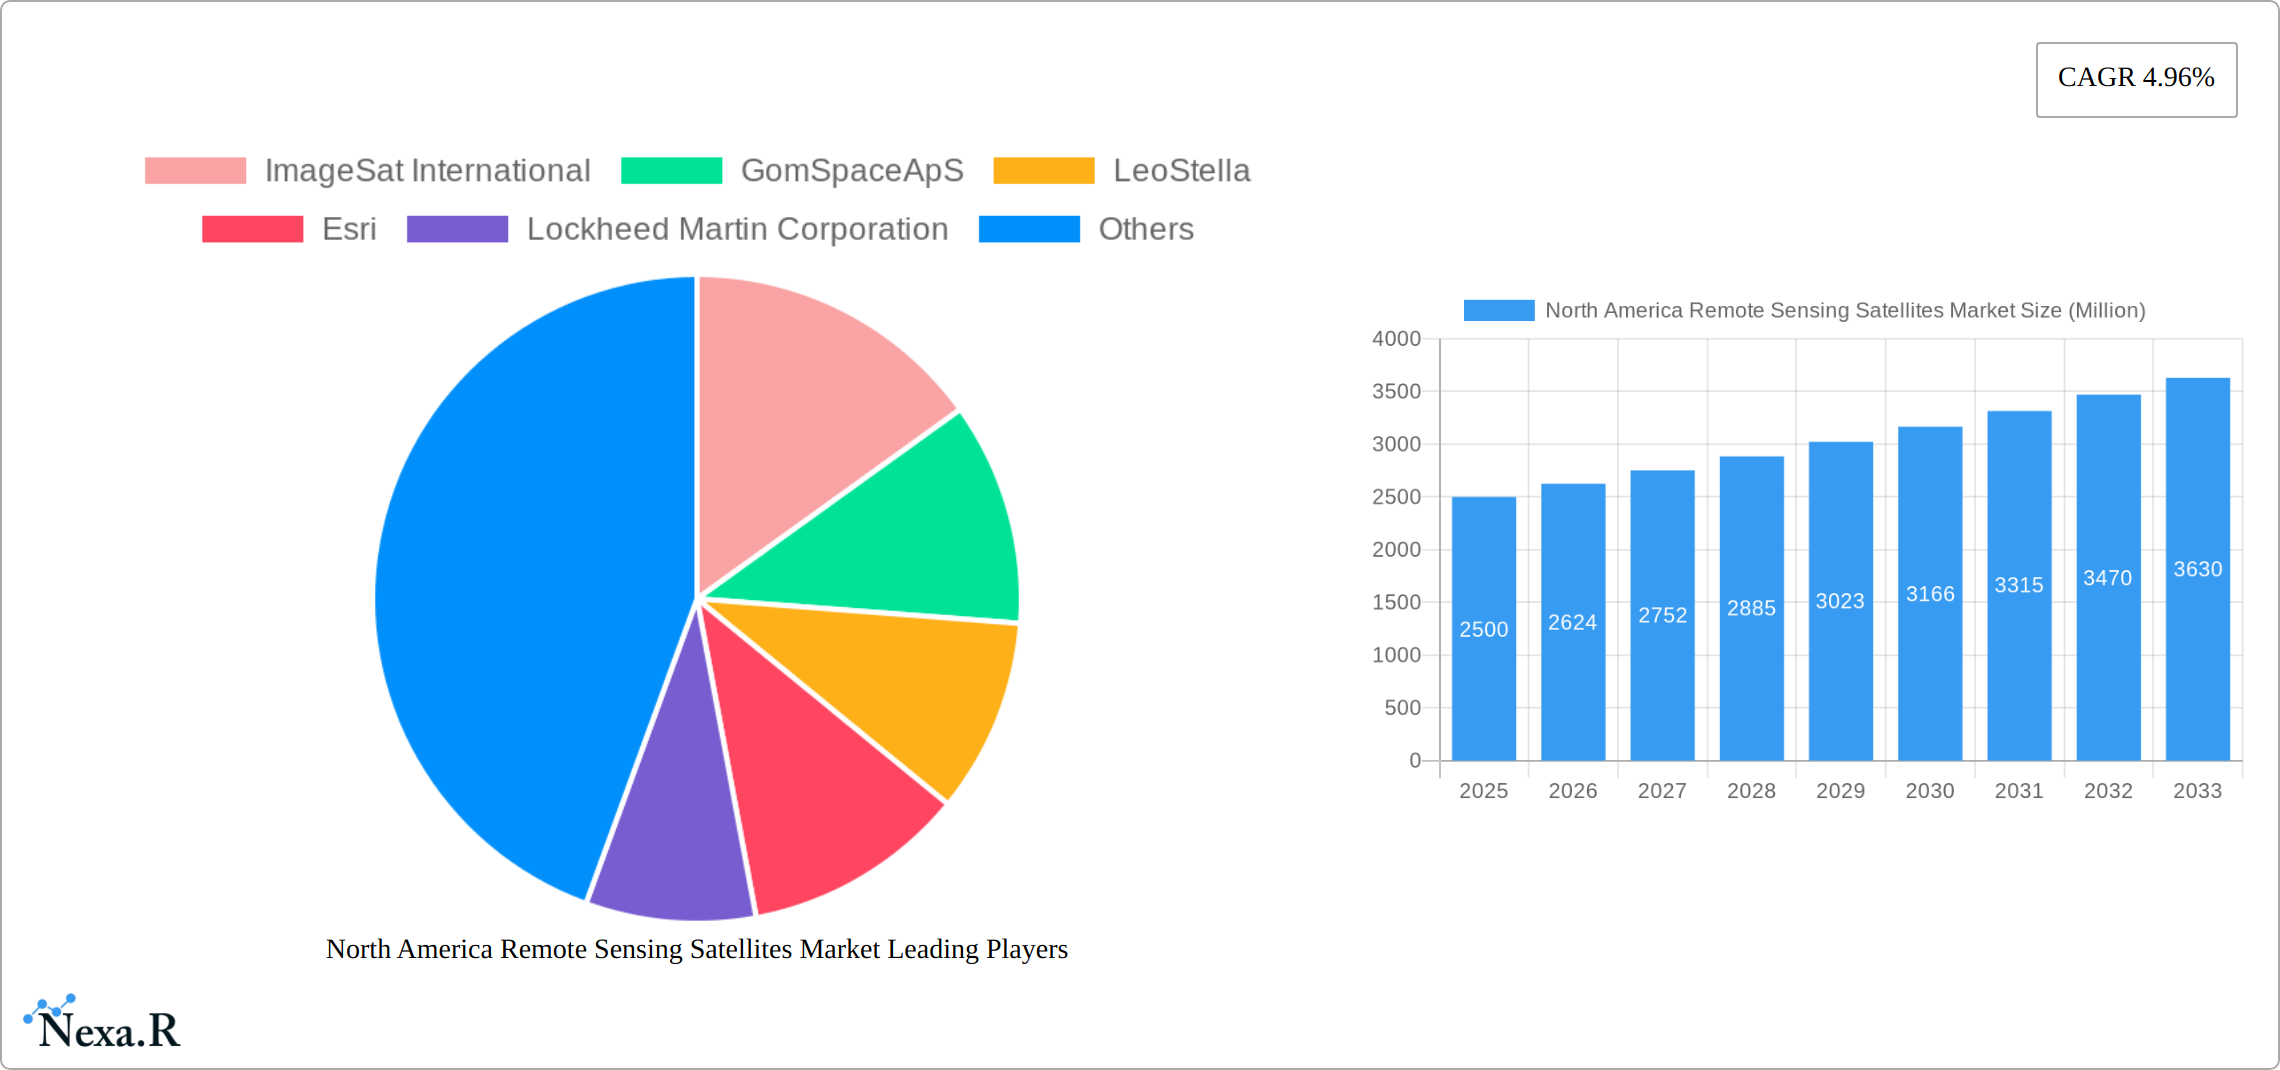
North America Remote Sensing Satellites Market Company Market Share
North America Remote Sensing Satellites Market: A Comprehensive Report (2019-2033)
This comprehensive report provides an in-depth analysis of the North America remote sensing satellites market, encompassing market dynamics, growth trends, key players, and future projections. The study period covers 2019-2033, with 2025 as the base and estimated year. The report segments the market by end-user (Commercial, Military & Government, Other), satellite mass (Below 10 Kg, 10-100kg, 100-500kg, 500-1000kg, above 1000kg), orbit class (LEO, MEO, GEO), and satellite subsystems (Propulsion Hardware and Propellant, Satellite Bus & Subsystems, Solar Array & Power Hardware, Structures, Harness & Mechanisms). The report leverages extensive primary and secondary research to deliver actionable insights for industry professionals. The market is projected to reach xx Million by 2033.
North America Remote Sensing Satellites Market Dynamics & Structure
The North American remote sensing satellites market is characterized by a moderately concentrated structure, with a few major players holding significant market share. Technological innovation, particularly in areas like higher-resolution imaging, miniaturization, and improved data processing, is a key driver of market growth. Stringent regulatory frameworks governing satellite launches and data usage influence market dynamics. The market also experiences competitive pressure from alternative technologies, such as aerial drones and advanced ground-based sensors. The increasing demand for real-time data across diverse sectors fuels market expansion. Mergers and acquisitions (M&A) activity, driven by the need for consolidation and technological expertise, is expected to shape the market landscape. The historical period (2019-2024) showed a xx% CAGR, and the forecast period (2025-2033) is projected to achieve a xx% CAGR.
- Market Concentration: Moderately concentrated, with top 5 players holding approximately xx% market share in 2025.
- Technological Innovation: Focus on higher resolution, improved data analytics, and miniaturization of satellites.
- Regulatory Framework: Stringent regulations regarding satellite launches and data security.
- Competitive Substitutes: Aerial drones, LiDAR, and advanced ground-based sensors pose competitive challenges.
- End-User Demographics: Significant growth driven by commercial and government sectors.
- M&A Trends: Consolidation is expected to continue with a projected xx M&A deals in the next 5 years.
North America Remote Sensing Satellites Market Growth Trends & Insights
The North America remote sensing satellites market has witnessed significant growth over the historical period (2019-2024), driven primarily by increasing demand from diverse sectors such as defense, agriculture, environmental monitoring, and urban planning. The market experienced a Compound Annual Growth Rate (CAGR) of xx% during this period. Technological advancements, such as the development of smaller, more cost-effective satellites, have contributed to market expansion. The rising adoption of cloud-based data processing and analytics solutions further fuels growth. Consumer behavior shifts toward data-driven decision-making across various sectors amplify market expansion. Market penetration is expected to reach xx% by 2033. The increasing accessibility of high-resolution satellite imagery is transforming various industries, impacting the market positively.
Dominant Regions, Countries, or Segments in North America Remote Sensing Satellites Market
The United States dominates the North America remote sensing satellites market, driven by robust government funding for defense and space exploration programs and a thriving commercial sector. Within the segments, the commercial end-user sector holds a significant share, demonstrating a strong market demand for remote sensing data. The LEO (Low Earth Orbit) segment is experiencing substantial growth, thanks to its cost-effectiveness and improved data acquisition capabilities. The 100-500kg satellite mass segment dominates due to its optimal balance between payload capacity and launch costs. The satellite bus and subsystems segment holds the largest share in the satellite subsystems category because of its crucial role in satellite functionality.
- Key Drivers:
- Robust government funding (primarily in the US) for space exploration and defense.
- High demand for real-time data across various commercial sectors.
- Increasing adoption of cloud-based data processing and analytics.
- Technological advancements in satellite miniaturization and data acquisition.
- Dominant Segments:
- Region: United States.
- End-User: Commercial.
- Satellite Mass: 100-500 kg.
- Orbit Class: LEO.
- Satellite Subsystem: Satellite Bus & Subsystems.
North America Remote Sensing Satellites Market Product Landscape
The North America remote sensing satellites market is characterized by a sophisticated and expanding product portfolio. This includes advanced high-resolution optical satellites offering unparalleled detail, and robust radar satellites capable of penetrating cloud cover and operating day or night. Hyperspectral imaging satellites are increasingly vital for detailed material identification and analysis, while the rise of smallsats and constellations provides cost-effective and agile solutions for specific missions. These diverse offerings are instrumental across a wide array of critical applications, from optimizing yields in precision agriculture and ensuring the integrity of vital infrastructure, to facilitating rapid and effective disaster response and bolstering national defense capabilities. Key technological advancements driving this market include significant improvements in spectral resolution for more nuanced data, enhanced data processing algorithms for quicker insights, and the ongoing miniaturization of satellite components, which contributes to more affordable and accessible satellite technology. The unique selling propositions of these products lie in their ability to deliver near real-time data acquisition, exceptionally high-resolution imagery, and the development of customized data solutions meticulously tailored to meet the precise requirements of individual clients and diverse applications.
Key Drivers, Barriers & Challenges in North America Remote Sensing Satellites Market
Key Drivers:
- Increasing demand for high-resolution imagery across various sectors.
- Technological advancements in satellite miniaturization and data analytics.
- Growing adoption of cloud-based data processing and analytics solutions.
- Government initiatives and funding for space exploration and national security.
Challenges & Restraints:
- High launch costs and operational expenses can impede market expansion.
- Regulatory hurdles and licensing requirements for satellite operations pose constraints.
- Intense competition from established players and new entrants can impact profitability.
- Dependence on robust ground infrastructure for data processing and distribution.
Emerging Opportunities in North America Remote Sensing Satellites Market
Emerging opportunities lie in the increasing demand for data analytics and AI-driven insights from satellite imagery. The integration of IoT (Internet of Things) sensors with satellite data offers vast potential for improved monitoring and management across various applications. The expansion into untapped markets, such as precision agriculture in developing nations and environmental monitoring in remote areas, presents considerable growth potential. New applications in areas such as autonomous vehicle navigation and smart city development offer further avenues for market expansion.
Growth Accelerators in the North America Remote Sensing Satellites Market Industry
The sustained and robust growth trajectory of the North American remote sensing satellites market is poised to be propelled by several dynamic factors. Continued breakthroughs in satellite miniaturization are leading to smaller, more agile, and cost-effective platforms. Concurrently, advancements in sensor technology are delivering enhanced resolution, spectral capabilities, and data quality. The increasing sophistication of data analytics and artificial intelligence is unlocking deeper insights from the vast amounts of data collected. Furthermore, the formation of strategic partnerships between satellite operators, data processing companies, value-added service providers, and diverse end-user industries is creating synergistic opportunities and accelerating market expansion. Government initiatives, including funding for space exploration, research and development, and policies that foster commercial space activities, are playing an instrumental role in creating a favorable ecosystem and driving overall market growth.
Key Players Shaping the North America Remote Sensing Satellites Market Market
- ImageSat International
- GomSpace ApS
- LeoStella
- Esri
- Lockheed Martin Corporation
- Ball Corporation
- Maxar Technologies Inc
- IHI Corp
- Thales Alenia Space (often referred to as Thales)
- Planet Labs Inc
- Northrop Grumman Corporation
- Spire Global Inc
- Capella Space Corp
Notable Milestones in North America Remote Sensing Satellites Market Sector
- April 2023: NASA awarded a significant Blanket Purchase Agreement (BPA) to Capella Space Corporation. This agreement facilitates the broad acquisition of high-resolution Synthetic Aperture Radar (SAR) data, greatly enhancing the availability of commercial SAR data for various governmental and scientific purposes.
- March 2023: Rocket Lab successfully launched a pair of commercial radar imaging satellites for Capella Space. This launch bolsters global monitoring capabilities, particularly for applications requiring reliable data acquisition even under challenging weather conditions, showcasing advancements in launch services and satellite deployment.
- February 2023: NASA and Esri announced a strategic partnership aimed at broadening access to NASA's extensive geospatial content. This collaboration is designed to foster innovation and facilitate research and exploration by making valuable Earth observation data more readily available to a wider community.
In-Depth North America Remote Sensing Satellites Market Outlook
The future of the North America remote sensing satellites market appears bright, with substantial growth potential driven by technological innovation, expanding applications, and increasing demand for geospatial data. Strategic partnerships and investments in advanced technologies will shape the market landscape. The focus on data analytics and AI-driven insights promises further market expansion. The market's continued evolution will be marked by the emergence of new players, innovative technologies, and an ever-widening range of applications across various industries.
North America Remote Sensing Satellites Market Segmentation
-
1. Satellite Mass
- 1.1. 10-100kg
- 1.2. 100-500kg
- 1.3. 500-1000kg
- 1.4. Below 10 Kg
- 1.5. above 1000kg
-
2. Orbit Class
- 2.1. GEO
- 2.2. LEO
- 2.3. MEO
-
3. Satellite Subsystem
- 3.1. Propulsion Hardware and Propellant
- 3.2. Satellite Bus & Subsystems
- 3.3. Solar Array & Power Hardware
- 3.4. Structures, Harness & Mechanisms
-
4. End User
- 4.1. Commercial
- 4.2. Military & Government
- 4.3. Other
North America Remote Sensing Satellites Market Segmentation By Geography
-
1. North America
- 1.1. United States
- 1.2. Canada
- 1.3. Mexico
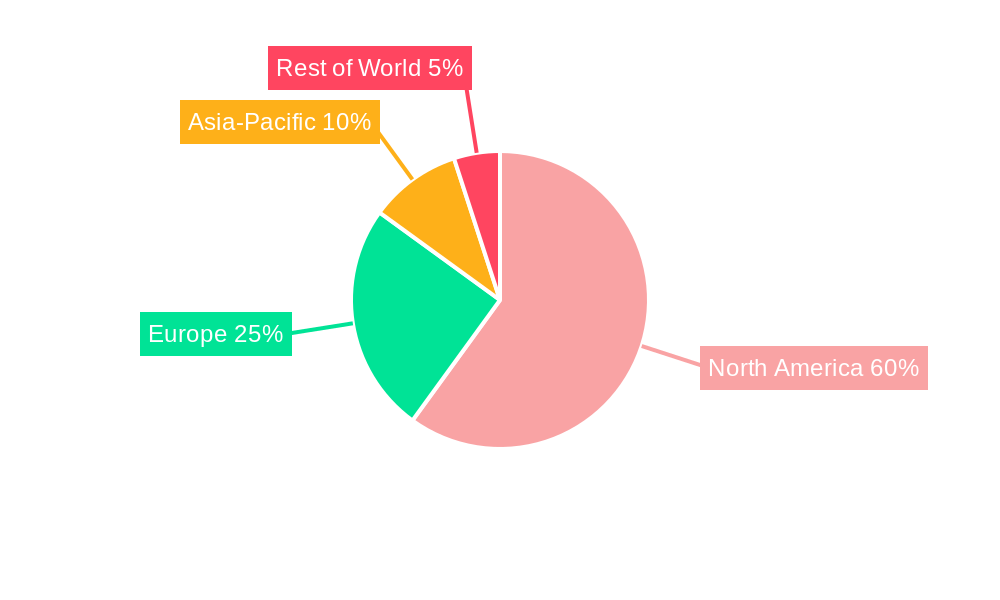
North America Remote Sensing Satellites Market Regional Market Share
Geographic Coverage of North America Remote Sensing Satellites Market
North America Remote Sensing Satellites Market REPORT HIGHLIGHTS
| Aspects | Details |
|---|---|
| Study Period | 2020-2034 |
| Base Year | 2025 |
| Estimated Year | 2026 |
| Forecast Period | 2026-2034 |
| Historical Period | 2020-2025 |
| Growth Rate | CAGR of 11.59% from 2020-2034 |
| Segmentation |
|
Table of Contents
- 1. Introduction
- 1.1. Research Scope
- 1.2. Market Segmentation
- 1.3. Research Objective
- 1.4. Definitions and Assumptions
- 2. Executive Summary
- 2.1. Market Snapshot
- 3. Market Dynamics
- 3.1. Market Drivers
- 3.2. Market Restrains
- 3.3. Market Trends
- 3.4. Market Opportunities
- 4. Market Factor Analysis
- 4.1. Porters Five Forces
- 4.1.1. Bargaining Power of Suppliers
- 4.1.2. Bargaining Power of Buyers
- 4.1.3. Threat of New Entrants
- 4.1.4. Threat of Substitutes
- 4.1.5. Competitive Rivalry
- 4.2. PESTEL analysis
- 4.3. BCG Analysis
- 4.3.1. Stars (High Growth, High Market Share)
- 4.3.2. Cash Cows (Low Growth, High Market Share)
- 4.3.3. Question Mark (High Growth, Low Market Share)
- 4.3.4. Dogs (Low Growth, Low Market Share)
- 4.4. Ansoff Matrix Analysis
- 4.5. Supply Chain Analysis
- 4.6. Regulatory Landscape
- 4.7. Current Market Potential and Opportunity Assessment (TAM–SAM–SOM Framework)
- 4.8. NRP Analyst Note
- 4.1. Porters Five Forces
- 5. Market Analysis, Insights and Forecast 2021-2033
- 5.1. Market Analysis, Insights and Forecast - by Satellite Mass
- 5.1.1. 10-100kg
- 5.1.2. 100-500kg
- 5.1.3. 500-1000kg
- 5.1.4. Below 10 Kg
- 5.1.5. above 1000kg
- 5.2. Market Analysis, Insights and Forecast - by Orbit Class
- 5.2.1. GEO
- 5.2.2. LEO
- 5.2.3. MEO
- 5.3. Market Analysis, Insights and Forecast - by Satellite Subsystem
- 5.3.1. Propulsion Hardware and Propellant
- 5.3.2. Satellite Bus & Subsystems
- 5.3.3. Solar Array & Power Hardware
- 5.3.4. Structures, Harness & Mechanisms
- 5.4. Market Analysis, Insights and Forecast - by End User
- 5.4.1. Commercial
- 5.4.2. Military & Government
- 5.4.3. Other
- 5.5. Market Analysis, Insights and Forecast - by Region
- 5.5.1. North America
- 5.1. Market Analysis, Insights and Forecast - by Satellite Mass
- 6. North America Remote Sensing Satellites Market Analysis, Insights and Forecast, 2021-2033
- 6.1. Market Analysis, Insights and Forecast - by Satellite Mass
- 6.1.1. 10-100kg
- 6.1.2. 100-500kg
- 6.1.3. 500-1000kg
- 6.1.4. Below 10 Kg
- 6.1.5. above 1000kg
- 6.2. Market Analysis, Insights and Forecast - by Orbit Class
- 6.2.1. GEO
- 6.2.2. LEO
- 6.2.3. MEO
- 6.3. Market Analysis, Insights and Forecast - by Satellite Subsystem
- 6.3.1. Propulsion Hardware and Propellant
- 6.3.2. Satellite Bus & Subsystems
- 6.3.3. Solar Array & Power Hardware
- 6.3.4. Structures, Harness & Mechanisms
- 6.4. Market Analysis, Insights and Forecast - by End User
- 6.4.1. Commercial
- 6.4.2. Military & Government
- 6.4.3. Other
- 6.1. Market Analysis, Insights and Forecast - by Satellite Mass
- 7. Competitive Analysis
- 7.1. Company Profiles
- 7.1.1 ImageSat International
- 7.1.1.1. Company Overview
- 7.1.1.2. Products
- 7.1.1.3. Company Financials
- 7.1.1.4. SWOT Analysis
- 7.1.2 GomSpaceApS
- 7.1.2.1. Company Overview
- 7.1.2.2. Products
- 7.1.2.3. Company Financials
- 7.1.2.4. SWOT Analysis
- 7.1.3 LeoStella
- 7.1.3.1. Company Overview
- 7.1.3.2. Products
- 7.1.3.3. Company Financials
- 7.1.3.4. SWOT Analysis
- 7.1.4 Esri
- 7.1.4.1. Company Overview
- 7.1.4.2. Products
- 7.1.4.3. Company Financials
- 7.1.4.4. SWOT Analysis
- 7.1.5 Lockheed Martin Corporation
- 7.1.5.1. Company Overview
- 7.1.5.2. Products
- 7.1.5.3. Company Financials
- 7.1.5.4. SWOT Analysis
- 7.1.6 Ball Corporation
- 7.1.6.1. Company Overview
- 7.1.6.2. Products
- 7.1.6.3. Company Financials
- 7.1.6.4. SWOT Analysis
- 7.1.7 Maxar Technologies Inc
- 7.1.7.1. Company Overview
- 7.1.7.2. Products
- 7.1.7.3. Company Financials
- 7.1.7.4. SWOT Analysis
- 7.1.8 IHI Corp
- 7.1.8.1. Company Overview
- 7.1.8.2. Products
- 7.1.8.3. Company Financials
- 7.1.8.4. SWOT Analysis
- 7.1.9 Thale
- 7.1.9.1. Company Overview
- 7.1.9.2. Products
- 7.1.9.3. Company Financials
- 7.1.9.4. SWOT Analysis
- 7.1.10 Planet Labs Inc
- 7.1.10.1. Company Overview
- 7.1.10.2. Products
- 7.1.10.3. Company Financials
- 7.1.10.4. SWOT Analysis
- 7.1.11 Northrop Grumman Corporation
- 7.1.11.1. Company Overview
- 7.1.11.2. Products
- 7.1.11.3. Company Financials
- 7.1.11.4. SWOT Analysis
- 7.1.12 Spire Global Inc
- 7.1.12.1. Company Overview
- 7.1.12.2. Products
- 7.1.12.3. Company Financials
- 7.1.12.4. SWOT Analysis
- 7.1.13 Capella Space Corp
- 7.1.13.1. Company Overview
- 7.1.13.2. Products
- 7.1.13.3. Company Financials
- 7.1.13.4. SWOT Analysis
- 7.1.1 ImageSat International
- 7.2. Market Entropy
- 7.2.1 Company's Key Areas Served
- 7.2.2 Recent Developments
- 7.3. Company Market Share Analysis 2025
- 7.3.1 Top 5 Companies Market Share Analysis
- 7.3.2 Top 3 Companies Market Share Analysis
- 7.4. List of Potential Customers
- 8. Research Methodology
List of Figures
- Figure 1: North America Remote Sensing Satellites Market Revenue Breakdown (billion, %) by Product 2025 & 2033
- Figure 2: North America Remote Sensing Satellites Market Share (%) by Company 2025
List of Tables
- Table 1: North America Remote Sensing Satellites Market Revenue billion Forecast, by Satellite Mass 2020 & 2033
- Table 2: North America Remote Sensing Satellites Market Revenue billion Forecast, by Orbit Class 2020 & 2033
- Table 3: North America Remote Sensing Satellites Market Revenue billion Forecast, by Satellite Subsystem 2020 & 2033
- Table 4: North America Remote Sensing Satellites Market Revenue billion Forecast, by End User 2020 & 2033
- Table 5: North America Remote Sensing Satellites Market Revenue billion Forecast, by Region 2020 & 2033
- Table 6: North America Remote Sensing Satellites Market Revenue billion Forecast, by Satellite Mass 2020 & 2033
- Table 7: North America Remote Sensing Satellites Market Revenue billion Forecast, by Orbit Class 2020 & 2033
- Table 8: North America Remote Sensing Satellites Market Revenue billion Forecast, by Satellite Subsystem 2020 & 2033
- Table 9: North America Remote Sensing Satellites Market Revenue billion Forecast, by End User 2020 & 2033
- Table 10: North America Remote Sensing Satellites Market Revenue billion Forecast, by Country 2020 & 2033
- Table 11: United States North America Remote Sensing Satellites Market Revenue (billion) Forecast, by Application 2020 & 2033
- Table 12: Canada North America Remote Sensing Satellites Market Revenue (billion) Forecast, by Application 2020 & 2033
- Table 13: Mexico North America Remote Sensing Satellites Market Revenue (billion) Forecast, by Application 2020 & 2033
Frequently Asked Questions
1. What is the projected Compound Annual Growth Rate (CAGR) of the North America Remote Sensing Satellites Market?
The projected CAGR is approximately 11.59%.
2. Which companies are prominent players in the North America Remote Sensing Satellites Market?
Key companies in the market include ImageSat International, GomSpaceApS, LeoStella, Esri, Lockheed Martin Corporation, Ball Corporation, Maxar Technologies Inc, IHI Corp, Thale, Planet Labs Inc, Northrop Grumman Corporation, Spire Global Inc, Capella Space Corp.
3. What are the main segments of the North America Remote Sensing Satellites Market?
The market segments include Satellite Mass, Orbit Class, Satellite Subsystem, End User.
4. Can you provide details about the market size?
The market size is estimated to be USD 25.37 billion as of 2022.
5. What are some drivers contributing to market growth?
N/A
6. What are the notable trends driving market growth?
OTHER KEY INDUSTRY TRENDS COVERED IN THE REPORT.
7. Are there any restraints impacting market growth?
N/A
8. Can you provide examples of recent developments in the market?
April 2023: NASA has awarded a sole source Blanket Purchase Agreement (BPA) to Capella Space Corporation of San Francisco to provide high-resolution Synthetic Aperture Radar (SAR) (0.5 meter to 1.2 meters) commercial Earth observation data products.March 2023: Rocket Lab's Electron rocket launched CapellaSpace's pair of commercial radar imaging satellites into orbit that are capable of seeing through clouds, in daylight or darkness, to monitor the planet below.February 2023: NASA and geographic information service provider Esri will grant wider access to the space agency's geospatial content for research and exploration purposes through the Space Act Agreement.
9. What pricing options are available for accessing the report?
Pricing options include single-user, multi-user, and enterprise licenses priced at USD 3800, USD 4500, and USD 5800 respectively.
10. Is the market size provided in terms of value or volume?
The market size is provided in terms of value, measured in billion.
11. Are there any specific market keywords associated with the report?
Yes, the market keyword associated with the report is "North America Remote Sensing Satellites Market," which aids in identifying and referencing the specific market segment covered.
12. How do I determine which pricing option suits my needs best?
The pricing options vary based on user requirements and access needs. Individual users may opt for single-user licenses, while businesses requiring broader access may choose multi-user or enterprise licenses for cost-effective access to the report.
13. Are there any additional resources or data provided in the North America Remote Sensing Satellites Market report?
While the report offers comprehensive insights, it's advisable to review the specific contents or supplementary materials provided to ascertain if additional resources or data are available.
14. How can I stay updated on further developments or reports in the North America Remote Sensing Satellites Market?
To stay informed about further developments, trends, and reports in the North America Remote Sensing Satellites Market, consider subscribing to industry newsletters, following relevant companies and organizations, or regularly checking reputable industry news sources and publications.
Methodology
Step 1 - Identification of Relevant Samples Size from Population Database


Step 2 - Approaches for Defining Global Market Size (Value, Volume* & Price*)

Note*: In applicable scenarios
Step 3 - Data Sources
Primary Research
- Web Analytics
- Survey Reports
- Research Institute
- Latest Research Reports
- Opinion Leaders
Secondary Research
- Annual Reports
- White Paper
- Latest Press Release
- Industry Association
- Paid Database
- Investor Presentations

Step 4 - Data Triangulation
Involves using different sources of information in order to increase the validity of a study
These sources are likely to be stakeholders in a program - participants, other researchers, program staff, other community members, and so on.
Then we put all data in single framework & apply various statistical tools to find out the dynamic on the market.
During the analysis stage, feedback from the stakeholder groups would be compared to determine areas of agreement as well as areas of divergence