

Key Insights
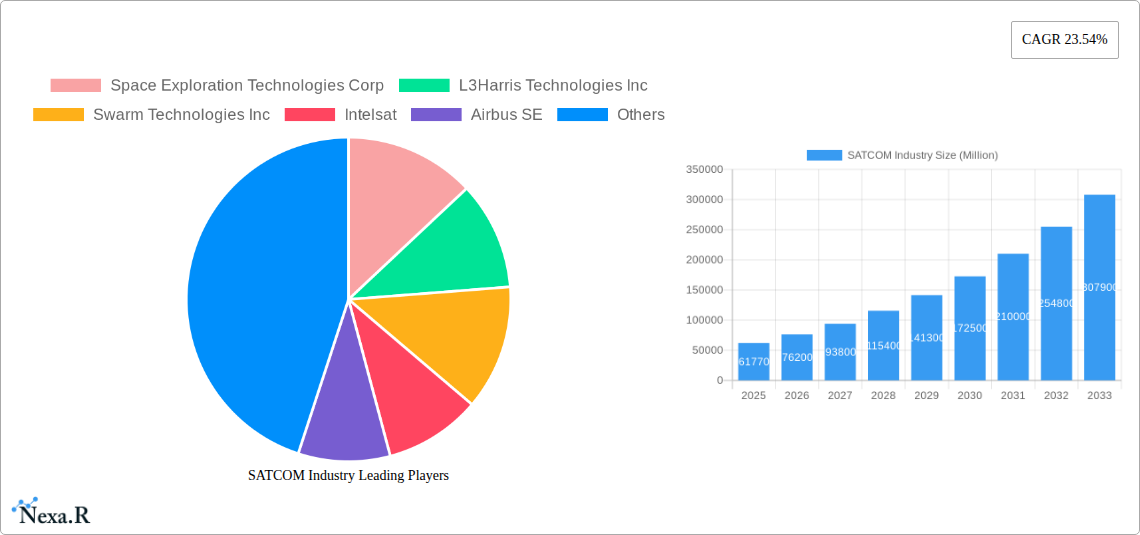
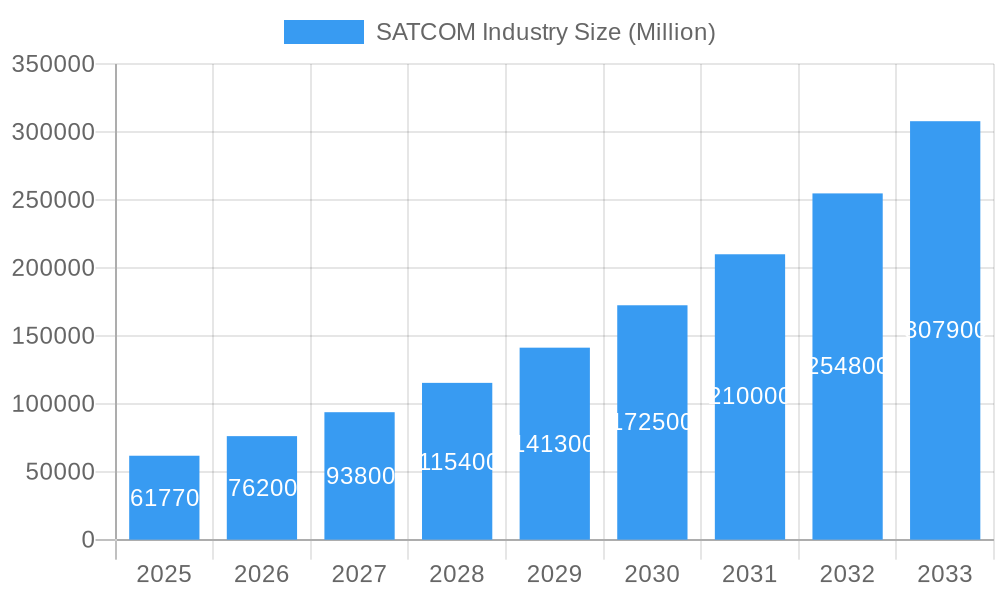
The global Satellite Communication (SATCOM) industry is exhibiting substantial expansion, fueled by escalating demand for high-bandwidth connectivity across diverse sectors. A projected Compound Annual Growth Rate (CAGR) of 23.54% is anticipated to drive significant market growth. This upward trajectory is supported by several critical factors, including the pervasive need for reliable global connectivity for the burgeoning Internet of Things (IoT) ecosystem, the expanding adoption of satellite-based broadband services in unserved and underserved regions, and the increasing demand for secure communication solutions in military and government operations. Continuous technological advancements, such as the development of higher-throughput satellites and enhanced ground segment infrastructure, are further accelerating market penetration.
SATCOM Industry Market Size (In Billion)
Market segmentation reveals a multifaceted landscape. While larger satellites (500-1000kg and above 1000kg) currently lead in value due to their superior capacity and longevity, smaller satellites (10-100kg) are experiencing rapid adoption driven by cost-effectiveness and their suitability for constellation deployment. Geostationary Earth Orbit (GEO) satellites retain a significant market share owing to their extensive coverage, whereas Low Earth Orbit (LEO) constellations are gaining momentum with their reduced latency and higher data speeds. In terms of communication type, broadcasting remains dominant, closely followed by mobile communication and satellite phone services. Commercial applications lead the end-user segment, with military and government sectors also serving as significant growth drivers. Key industry players are actively investing in innovation and new technologies to strengthen their market positions.
SATCOM Industry Company Market Share
Despite its considerable growth prospects, the SATCOM industry encounters specific challenges, including high initial investment costs for satellite development and launch, and potential impediments from regulatory frameworks and spectrum allocation. Competition from terrestrial communication technologies, particularly in densely populated areas, also warrants consideration. Nevertheless, SATCOM's inherent advantages – global reach, reliability, and security – are poised to ensure its sustained relevance and growth, especially in remote and underserved geographies. Ongoing technological advancements and evolving business models will be instrumental in overcoming existing hurdles and realizing the full potential of this dynamic market.
SATCOM Industry Market Overview
This comprehensive report offers an in-depth analysis of the global Satellite Communication (SATCOM) industry from 2019 to 2033. It covers market dynamics, growth trends, key players, and future outlook, with 2025 identified as the base and estimated year. This report is essential for industry professionals, investors, and stakeholders seeking a granular understanding of this dynamic sector. The market is segmented by satellite mass, orbit class, communication type, and end-user, providing a holistic view of the SATCOM landscape.
The global SATCOM market is projected to reach $98.28 billion by 2025, growing at a CAGR of 11%.
SATCOM Industry Market Dynamics & Structure
The Satellite Communication (SATCOM) market is a dynamic and evolving landscape, exhibiting a moderate level of concentration where established players command substantial market share. However, the rapid pace of technological innovation and the emergence of agile new entrants are continuously intensifying the competitive environment. Key drivers of this dynamism include breakthroughs in satellite technology, such as advancements in miniaturization, the development of high-throughput satellites (HTS), and the expansion of software-defined capabilities. These innovations enable significantly higher bandwidth and more flexible service delivery. Regulatory frameworks, which vary considerably across different geographical regions, play a crucial role in shaping market access, operational strategies, and spectrum allocation. The industry also witnesses ongoing mergers and acquisitions (M&A) activity, as larger entities strategically acquire smaller companies to consolidate capabilities, enhance market reach, and integrate cutting-edge technologies. While competitive terrestrial alternatives like fiber optic networks and advanced 5G services present challenges, SATCOM's inherent advantages, particularly its unparalleled ability to provide connectivity in remote, underserved, and mobile environments, ensure its sustained relevance and growth.
- Market Concentration: Moderately concentrated, with the top 5 players estimated to hold approximately 60-70% market share in 2024.
- Technological Innovation: Key drivers include advancements in Low Earth Orbit (LEO) constellations, High Throughput Satellites (HTS), software-defined satellites and radios (SDR), and the integration of AI for network optimization.
- Regulatory Frameworks: Varying licensing, spectrum allocation policies, and international agreements across regions present significant market entry barriers and operational complexities.
- M&A Activity: An average of 10-15 M&A deals per year have been recorded between 2019 and 2024, with an estimated cumulative value of approximately $5-10 billion USD, indicating strategic consolidation and capability expansion.
- End-User Demographics: Significant growth is anticipated across all sectors, with particularly strong expansion projected in the commercial enterprise, maritime, aviation, and military & government segments.
- Competitive Substitutes: Terrestrial fiber and 5G networks pose competitive challenges, especially in densely populated areas and for high-bandwidth, low-latency applications, but SATCOM remains crucial for ubiquitous coverage and specialized use cases.
SATCOM Industry Growth Trends & Insights
The global SATCOM market experienced significant growth during the historical period (2019-2024), with a CAGR of xx%. This growth is primarily attributed to increasing demand for broadband connectivity, particularly in underserved regions. The adoption rate of satellite-based communication services has increased steadily, driven by the decreasing cost of satellite technology and the rising demand for reliable connectivity. Technological disruptions, such as the emergence of mega-constellations of Low Earth Orbit (LEO) satellites, are reshaping the industry landscape, leading to increased capacity and reduced latency. Consumer behavior shifts toward higher bandwidth requirements and seamless connectivity across various devices further fuel market growth. The market is projected to maintain a robust CAGR of xx% during the forecast period (2025-2033), reaching a market size of xx million units by 2033. Market penetration is expected to reach xx% by 2033.
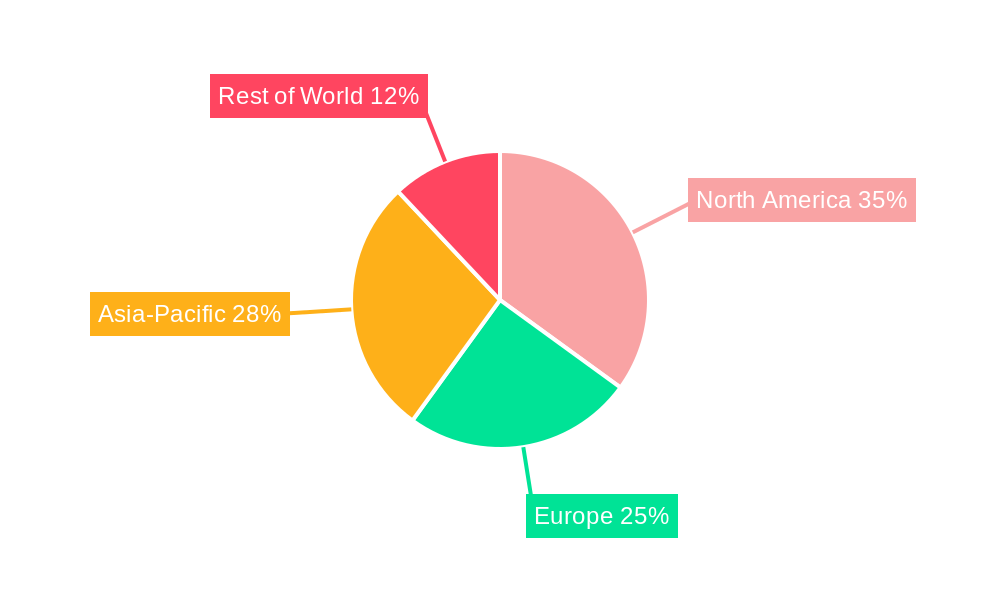
Dominant Regions, Countries, or Segments in SATCOM Industry
The North American region currently stands as the dominant force in the global SATCOM market. This leadership is propelled by substantial government investments, particularly in defense and aerospace sectors, alongside a robust and expanding ecosystem of commercial SATCOM applications. Within the broader market, the Low Earth Orbit (LEO) satellite class is experiencing an unprecedented surge in growth, largely attributed to the ambitious deployment of mega-constellations aimed at providing global broadband coverage. Concurrently, the 100-500kg satellite mass segment is demonstrating significant promise, offering a compelling balance of cost-effectiveness and adaptability for a wide array of mission profiles and applications. The Commercial end-user segment continues to be the largest contributor to overall market revenue, fueled by escalating demand for reliable internet access, burgeoning IoT deployments, and a host of innovative data-driven services.
- Key Drivers & Dominant Segments:
- North America: Dominant due to high government spending on defense and aerospace, coupled with a mature commercial market driving demand for advanced connectivity solutions.
- Europe: Experiencing strong growth driven by increasing investments in satellite-based broadband infrastructure, smart city initiatives, and governmental digital transformation projects.
- Asia-Pacific: Witnessing rapid expansion fueled by rising demand for communication services in emerging economies, increasing adoption of satellite technology for disaster management, and significant investments in national space programs.
- LEO Orbit Class: Exhibits rapid growth due to its inherent advantages of lower latency, increased bandwidth potential, and faster deployment cycles compared to Geostationary (GEO) satellites, enabling next-generation broadband and constellation services.
- 100-500kg Satellite Mass: Shows significant promise as a cost-effective and versatile platform for Earth observation, telecommunications, scientific research, and defense applications, fitting well within the trend of smaller, more numerous satellites.
- Commercial End-User: Represents the largest revenue segment, driven by high and ever-increasing demand for reliable broadband connectivity for businesses, remote workforces, the Internet of Things (IoT), media broadcasting, and other data-intensive applications.
SATCOM Industry Product Landscape
The SATCOM industry offers a comprehensive and increasingly sophisticated product portfolio designed to meet diverse connectivity needs. This landscape includes a range of essential components such as advanced high-throughput satellites (HTS), versatile small satellites, robust ground station infrastructure, and user-friendly terminal devices. Recent innovations are characterized by the development of cutting-edge satellite payloads that deliver significantly enhanced bandwidth, improved spectral efficiency, and greater adaptability. Complementing these advancements are software-defined ground segments, which offer unprecedented flexibility, scalability, and simplified network management. These products collectively enable a broad spectrum of applications, spanning traditional broadcasting and mobile communication to modern satellite internet services and critical government and military operations. The unique selling propositions in this competitive market increasingly emphasize delivering higher bandwidth capacity, lower latency, superior reliability in challenging environments, and demonstrable cost-effectiveness, often through innovative business models and technological integration.
Key Drivers, Barriers & Challenges in SATCOM Industry
Key Drivers:
- Increasing demand for high-speed broadband connectivity, especially in remote and underserved areas.
- Advancements in satellite technology, leading to improved capacity, lower latency, and reduced cost.
- Growing adoption of IoT and other data-intensive applications.
- Government initiatives promoting space exploration and satellite-based communication infrastructure.
Challenges and Restraints:
- High upfront capital investment in satellite development and launch.
- Regulatory hurdles and spectrum allocation issues.
- Competition from terrestrial communication networks (fiber, 5G).
- Supply chain complexities and potential disruptions. This is estimated to impact revenue by approximately xx million units annually.
Emerging Opportunities in SATCOM Industry
Emerging opportunities include the growth of the NewSpace industry, the increasing adoption of software-defined radios, and the expansion of satellite-based IoT applications. Untapped markets in developing countries present significant potential. Innovations in satellite constellation design and the development of more efficient and affordable user terminals will drive market growth.
Growth Accelerators in the SATCOM Industry Industry
Technological advancements, such as the development of laser communication terminals, will significantly enhance data transfer rates, driving market expansion. Strategic partnerships between satellite operators, network providers, and technology companies are crucial for developing innovative end-to-end solutions. Market expansion into underserved regions, particularly in Africa and Asia, presents significant opportunities.
Key Players Shaping the SATCOM Industry Market
- Space Exploration Technologies Corp
- L3Harris Technologies Inc
- Swarm Technologies Inc (Acquired by SpaceX)
- Intelsat
- Airbus SE
- Viasat Inc
- Cobham Limited
- China Aerospace Science and Technology Corporation (CASC)
- Thales
- SKY Perfect JSAT Corporation
- SES S A
- Maxar Technologies Inc
- Thuraya Telecommunications Company
- EchoStar Corporation
- Eutelsat
- Hughes Network Systems (A Charter Communications Company)
Notable Milestones in SATCOM Industry Sector
- January 2023: Viasat awarded a contract by the US Marine Corps for end-to-end satellite communication support. This strengthens Viasat’s position in the government sector.
- February 2023: Anuvu signed an agreement with Telesat for new antennas and ground station infrastructure, boosting high-speed connectivity solutions.
- February 2023: SES partnered with ThinKom and Hughes to launch a high-performance multi-orbit service for government aerial missions, showcasing technological advancement in the sector.
In-Depth SATCOM Industry Market Outlook
The Satellite Communication (SATCOM) industry is on a trajectory for sustained and robust growth, propelled by a confluence of factors including relentless technological advancements, the expanding scope of applications, and the ever-increasing global demand for ubiquitous connectivity. Strategic alliances, significant investments in next-generation satellite technologies (such as advanced propulsion systems, AI-driven onboard processing, and inter-satellite links), and the development of integrated ground and space segment solutions will be pivotal in shaping the future competitive landscape. The market presents abundant opportunities for innovation and expansion, particularly in bridging the digital divide in underserved regions and pioneering new applications in areas like advanced IoT, autonomous systems, and space-based intelligence. The long-term outlook for the SATCOM industry is exceptionally positive, characterized by substantial potential for market expansion, enhanced service offerings, and significant value creation for stakeholders who can effectively navigate its dynamic and technologically driven evolution.
SATCOM Industry Segmentation
-
1. Satellite Mass
- 1.1. 10-100kg
- 1.2. 100-500kg
- 1.3. 500-1000kg
- 1.4. Below 10 Kg
- 1.5. above 1000kg
-
2. Orbit Class
- 2.1. GEO
- 2.2. LEO
- 2.3. MEO
-
3. Communication Type
- 3.1. Broadcasting
- 3.2. Mobile Communication
- 3.3. Satellite Phone
- 3.4. Others
-
4. End User
- 4.1. Commercial
- 4.2. Military & Government
- 4.3. Other
SATCOM Industry Segmentation By Geography
-
1. North America
- 1.1. United States
- 1.2. Canada
- 1.3. Mexico
-
2. South America
- 2.1. Brazil
- 2.2. Argentina
- 2.3. Rest of South America
-
3. Europe
- 3.1. United Kingdom
- 3.2. Germany
- 3.3. France
- 3.4. Italy
- 3.5. Spain
- 3.6. Russia
- 3.7. Benelux
- 3.8. Nordics
- 3.9. Rest of Europe
-
4. Middle East & Africa
- 4.1. Turkey
- 4.2. Israel
- 4.3. GCC
- 4.4. North Africa
- 4.5. South Africa
- 4.6. Rest of Middle East & Africa
-
5. Asia Pacific
- 5.1. China
- 5.2. India
- 5.3. Japan
- 5.4. South Korea
- 5.5. ASEAN
- 5.6. Oceania
- 5.7. Rest of Asia Pacific
SATCOM Industry Regional Market Share
Geographic Coverage of SATCOM Industry
SATCOM Industry REPORT HIGHLIGHTS
| Aspects | Details |
|---|---|
| Study Period | 2020-2034 |
| Base Year | 2025 |
| Estimated Year | 2026 |
| Forecast Period | 2026-2034 |
| Historical Period | 2020-2025 |
| Growth Rate | CAGR of 11% from 2020-2034 |
| Segmentation |
|
Table of Contents
- 1. Introduction
- 1.1. Research Scope
- 1.2. Market Segmentation
- 1.3. Research Objective
- 1.4. Definitions and Assumptions
- 2. Executive Summary
- 2.1. Market Snapshot
- 3. Market Dynamics
- 3.1. Market Drivers
- 3.2. Market Restrains
- 3.3. Market Trends
- 3.4. Market Opportunities
- 4. Market Factor Analysis
- 4.1. Porters Five Forces
- 4.1.1. Bargaining Power of Suppliers
- 4.1.2. Bargaining Power of Buyers
- 4.1.3. Threat of New Entrants
- 4.1.4. Threat of Substitutes
- 4.1.5. Competitive Rivalry
- 4.2. PESTEL analysis
- 4.3. BCG Analysis
- 4.3.1. Stars (High Growth, High Market Share)
- 4.3.2. Cash Cows (Low Growth, High Market Share)
- 4.3.3. Question Mark (High Growth, Low Market Share)
- 4.3.4. Dogs (Low Growth, Low Market Share)
- 4.4. Ansoff Matrix Analysis
- 4.5. Supply Chain Analysis
- 4.6. Regulatory Landscape
- 4.7. Current Market Potential and Opportunity Assessment (TAM–SAM–SOM Framework)
- 4.8. NRP Analyst Note
- 4.1. Porters Five Forces
- 5. Market Analysis, Insights and Forecast 2021-2033
- 5.1. Market Analysis, Insights and Forecast - by Satellite Mass
- 5.1.1. 10-100kg
- 5.1.2. 100-500kg
- 5.1.3. 500-1000kg
- 5.1.4. Below 10 Kg
- 5.1.5. above 1000kg
- 5.2. Market Analysis, Insights and Forecast - by Orbit Class
- 5.2.1. GEO
- 5.2.2. LEO
- 5.2.3. MEO
- 5.3. Market Analysis, Insights and Forecast - by Communication Type
- 5.3.1. Broadcasting
- 5.3.2. Mobile Communication
- 5.3.3. Satellite Phone
- 5.3.4. Others
- 5.4. Market Analysis, Insights and Forecast - by End User
- 5.4.1. Commercial
- 5.4.2. Military & Government
- 5.4.3. Other
- 5.5. Market Analysis, Insights and Forecast - by Region
- 5.5.1. North America
- 5.5.2. South America
- 5.5.3. Europe
- 5.5.4. Middle East & Africa
- 5.5.5. Asia Pacific
- 5.1. Market Analysis, Insights and Forecast - by Satellite Mass
- 6. Global SATCOM Industry Analysis, Insights and Forecast, 2021-2033
- 6.1. Market Analysis, Insights and Forecast - by Satellite Mass
- 6.1.1. 10-100kg
- 6.1.2. 100-500kg
- 6.1.3. 500-1000kg
- 6.1.4. Below 10 Kg
- 6.1.5. above 1000kg
- 6.2. Market Analysis, Insights and Forecast - by Orbit Class
- 6.2.1. GEO
- 6.2.2. LEO
- 6.2.3. MEO
- 6.3. Market Analysis, Insights and Forecast - by Communication Type
- 6.3.1. Broadcasting
- 6.3.2. Mobile Communication
- 6.3.3. Satellite Phone
- 6.3.4. Others
- 6.4. Market Analysis, Insights and Forecast - by End User
- 6.4.1. Commercial
- 6.4.2. Military & Government
- 6.4.3. Other
- 6.1. Market Analysis, Insights and Forecast - by Satellite Mass
- 7. North America SATCOM Industry Analysis, Insights and Forecast, 2020-2032
- 7.1. Market Analysis, Insights and Forecast - by Satellite Mass
- 7.1.1. 10-100kg
- 7.1.2. 100-500kg
- 7.1.3. 500-1000kg
- 7.1.4. Below 10 Kg
- 7.1.5. above 1000kg
- 7.2. Market Analysis, Insights and Forecast - by Orbit Class
- 7.2.1. GEO
- 7.2.2. LEO
- 7.2.3. MEO
- 7.3. Market Analysis, Insights and Forecast - by Communication Type
- 7.3.1. Broadcasting
- 7.3.2. Mobile Communication
- 7.3.3. Satellite Phone
- 7.3.4. Others
- 7.4. Market Analysis, Insights and Forecast - by End User
- 7.4.1. Commercial
- 7.4.2. Military & Government
- 7.4.3. Other
- 7.1. Market Analysis, Insights and Forecast - by Satellite Mass
- 8. South America SATCOM Industry Analysis, Insights and Forecast, 2020-2032
- 8.1. Market Analysis, Insights and Forecast - by Satellite Mass
- 8.1.1. 10-100kg
- 8.1.2. 100-500kg
- 8.1.3. 500-1000kg
- 8.1.4. Below 10 Kg
- 8.1.5. above 1000kg
- 8.2. Market Analysis, Insights and Forecast - by Orbit Class
- 8.2.1. GEO
- 8.2.2. LEO
- 8.2.3. MEO
- 8.3. Market Analysis, Insights and Forecast - by Communication Type
- 8.3.1. Broadcasting
- 8.3.2. Mobile Communication
- 8.3.3. Satellite Phone
- 8.3.4. Others
- 8.4. Market Analysis, Insights and Forecast - by End User
- 8.4.1. Commercial
- 8.4.2. Military & Government
- 8.4.3. Other
- 8.1. Market Analysis, Insights and Forecast - by Satellite Mass
- 9. Europe SATCOM Industry Analysis, Insights and Forecast, 2020-2032
- 9.1. Market Analysis, Insights and Forecast - by Satellite Mass
- 9.1.1. 10-100kg
- 9.1.2. 100-500kg
- 9.1.3. 500-1000kg
- 9.1.4. Below 10 Kg
- 9.1.5. above 1000kg
- 9.2. Market Analysis, Insights and Forecast - by Orbit Class
- 9.2.1. GEO
- 9.2.2. LEO
- 9.2.3. MEO
- 9.3. Market Analysis, Insights and Forecast - by Communication Type
- 9.3.1. Broadcasting
- 9.3.2. Mobile Communication
- 9.3.3. Satellite Phone
- 9.3.4. Others
- 9.4. Market Analysis, Insights and Forecast - by End User
- 9.4.1. Commercial
- 9.4.2. Military & Government
- 9.4.3. Other
- 9.1. Market Analysis, Insights and Forecast - by Satellite Mass
- 10. Middle East & Africa SATCOM Industry Analysis, Insights and Forecast, 2020-2032
- 10.1. Market Analysis, Insights and Forecast - by Satellite Mass
- 10.1.1. 10-100kg
- 10.1.2. 100-500kg
- 10.1.3. 500-1000kg
- 10.1.4. Below 10 Kg
- 10.1.5. above 1000kg
- 10.2. Market Analysis, Insights and Forecast - by Orbit Class
- 10.2.1. GEO
- 10.2.2. LEO
- 10.2.3. MEO
- 10.3. Market Analysis, Insights and Forecast - by Communication Type
- 10.3.1. Broadcasting
- 10.3.2. Mobile Communication
- 10.3.3. Satellite Phone
- 10.3.4. Others
- 10.4. Market Analysis, Insights and Forecast - by End User
- 10.4.1. Commercial
- 10.4.2. Military & Government
- 10.4.3. Other
- 10.1. Market Analysis, Insights and Forecast - by Satellite Mass
- 11. Asia Pacific SATCOM Industry Analysis, Insights and Forecast, 2020-2032
- 11.1. Market Analysis, Insights and Forecast - by Satellite Mass
- 11.1.1. 10-100kg
- 11.1.2. 100-500kg
- 11.1.3. 500-1000kg
- 11.1.4. Below 10 Kg
- 11.1.5. above 1000kg
- 11.2. Market Analysis, Insights and Forecast - by Orbit Class
- 11.2.1. GEO
- 11.2.2. LEO
- 11.2.3. MEO
- 11.3. Market Analysis, Insights and Forecast - by Communication Type
- 11.3.1. Broadcasting
- 11.3.2. Mobile Communication
- 11.3.3. Satellite Phone
- 11.3.4. Others
- 11.4. Market Analysis, Insights and Forecast - by End User
- 11.4.1. Commercial
- 11.4.2. Military & Government
- 11.4.3. Other
- 11.1. Market Analysis, Insights and Forecast - by Satellite Mass
- 12. Competitive Analysis
- 12.1. Company Profiles
- 12.1.1 Space Exploration Technologies Corp
- 12.1.1.1. Company Overview
- 12.1.1.2. Products
- 12.1.1.3. Company Financials
- 12.1.1.4. SWOT Analysis
- 12.1.2 L3Harris Technologies Inc
- 12.1.2.1. Company Overview
- 12.1.2.2. Products
- 12.1.2.3. Company Financials
- 12.1.2.4. SWOT Analysis
- 12.1.3 Swarm Technologies Inc
- 12.1.3.1. Company Overview
- 12.1.3.2. Products
- 12.1.3.3. Company Financials
- 12.1.3.4. SWOT Analysis
- 12.1.4 Intelsat
- 12.1.4.1. Company Overview
- 12.1.4.2. Products
- 12.1.4.3. Company Financials
- 12.1.4.4. SWOT Analysis
- 12.1.5 Airbus SE
- 12.1.5.1. Company Overview
- 12.1.5.2. Products
- 12.1.5.3. Company Financials
- 12.1.5.4. SWOT Analysis
- 12.1.6 Viasat Inc
- 12.1.6.1. Company Overview
- 12.1.6.2. Products
- 12.1.6.3. Company Financials
- 12.1.6.4. SWOT Analysis
- 12.1.7 Cobham Limited
- 12.1.7.1. Company Overview
- 12.1.7.2. Products
- 12.1.7.3. Company Financials
- 12.1.7.4. SWOT Analysis
- 12.1.8 China Aerospace Science and Technology Corporation (CASC)
- 12.1.8.1. Company Overview
- 12.1.8.2. Products
- 12.1.8.3. Company Financials
- 12.1.8.4. SWOT Analysis
- 12.1.9 Thales
- 12.1.9.1. Company Overview
- 12.1.9.2. Products
- 12.1.9.3. Company Financials
- 12.1.9.4. SWOT Analysis
- 12.1.10 SKY Perfect JSAT Corporation
- 12.1.10.1. Company Overview
- 12.1.10.2. Products
- 12.1.10.3. Company Financials
- 12.1.10.4. SWOT Analysis
- 12.1.11 SES S A
- 12.1.11.1. Company Overview
- 12.1.11.2. Products
- 12.1.11.3. Company Financials
- 12.1.11.4. SWOT Analysis
- 12.1.12 Maxar Technologies Inc
- 12.1.12.1. Company Overview
- 12.1.12.2. Products
- 12.1.12.3. Company Financials
- 12.1.12.4. SWOT Analysis
- 12.1.13 Thuraya Telecommunications Company
- 12.1.13.1. Company Overview
- 12.1.13.2. Products
- 12.1.13.3. Company Financials
- 12.1.13.4. SWOT Analysis
- 12.1.14 EchoStar Corporation
- 12.1.14.1. Company Overview
- 12.1.14.2. Products
- 12.1.14.3. Company Financials
- 12.1.14.4. SWOT Analysis
- 12.1.1 Space Exploration Technologies Corp
- 12.2. Market Entropy
- 12.2.1 Company's Key Areas Served
- 12.2.2 Recent Developments
- 12.3. Company Market Share Analysis 2025
- 12.3.1 Top 5 Companies Market Share Analysis
- 12.3.2 Top 3 Companies Market Share Analysis
- 12.4. List of Potential Customers
- 13. Research Methodology
List of Figures
- Figure 1: Global SATCOM Industry Revenue Breakdown (billion, %) by Region 2025 & 2033
- Figure 2: North America SATCOM Industry Revenue (billion), by Satellite Mass 2025 & 2033
- Figure 3: North America SATCOM Industry Revenue Share (%), by Satellite Mass 2025 & 2033
- Figure 4: North America SATCOM Industry Revenue (billion), by Orbit Class 2025 & 2033
- Figure 5: North America SATCOM Industry Revenue Share (%), by Orbit Class 2025 & 2033
- Figure 6: North America SATCOM Industry Revenue (billion), by Communication Type 2025 & 2033
- Figure 7: North America SATCOM Industry Revenue Share (%), by Communication Type 2025 & 2033
- Figure 8: North America SATCOM Industry Revenue (billion), by End User 2025 & 2033
- Figure 9: North America SATCOM Industry Revenue Share (%), by End User 2025 & 2033
- Figure 10: North America SATCOM Industry Revenue (billion), by Country 2025 & 2033
- Figure 11: North America SATCOM Industry Revenue Share (%), by Country 2025 & 2033
- Figure 12: South America SATCOM Industry Revenue (billion), by Satellite Mass 2025 & 2033
- Figure 13: South America SATCOM Industry Revenue Share (%), by Satellite Mass 2025 & 2033
- Figure 14: South America SATCOM Industry Revenue (billion), by Orbit Class 2025 & 2033
- Figure 15: South America SATCOM Industry Revenue Share (%), by Orbit Class 2025 & 2033
- Figure 16: South America SATCOM Industry Revenue (billion), by Communication Type 2025 & 2033
- Figure 17: South America SATCOM Industry Revenue Share (%), by Communication Type 2025 & 2033
- Figure 18: South America SATCOM Industry Revenue (billion), by End User 2025 & 2033
- Figure 19: South America SATCOM Industry Revenue Share (%), by End User 2025 & 2033
- Figure 20: South America SATCOM Industry Revenue (billion), by Country 2025 & 2033
- Figure 21: South America SATCOM Industry Revenue Share (%), by Country 2025 & 2033
- Figure 22: Europe SATCOM Industry Revenue (billion), by Satellite Mass 2025 & 2033
- Figure 23: Europe SATCOM Industry Revenue Share (%), by Satellite Mass 2025 & 2033
- Figure 24: Europe SATCOM Industry Revenue (billion), by Orbit Class 2025 & 2033
- Figure 25: Europe SATCOM Industry Revenue Share (%), by Orbit Class 2025 & 2033
- Figure 26: Europe SATCOM Industry Revenue (billion), by Communication Type 2025 & 2033
- Figure 27: Europe SATCOM Industry Revenue Share (%), by Communication Type 2025 & 2033
- Figure 28: Europe SATCOM Industry Revenue (billion), by End User 2025 & 2033
- Figure 29: Europe SATCOM Industry Revenue Share (%), by End User 2025 & 2033
- Figure 30: Europe SATCOM Industry Revenue (billion), by Country 2025 & 2033
- Figure 31: Europe SATCOM Industry Revenue Share (%), by Country 2025 & 2033
- Figure 32: Middle East & Africa SATCOM Industry Revenue (billion), by Satellite Mass 2025 & 2033
- Figure 33: Middle East & Africa SATCOM Industry Revenue Share (%), by Satellite Mass 2025 & 2033
- Figure 34: Middle East & Africa SATCOM Industry Revenue (billion), by Orbit Class 2025 & 2033
- Figure 35: Middle East & Africa SATCOM Industry Revenue Share (%), by Orbit Class 2025 & 2033
- Figure 36: Middle East & Africa SATCOM Industry Revenue (billion), by Communication Type 2025 & 2033
- Figure 37: Middle East & Africa SATCOM Industry Revenue Share (%), by Communication Type 2025 & 2033
- Figure 38: Middle East & Africa SATCOM Industry Revenue (billion), by End User 2025 & 2033
- Figure 39: Middle East & Africa SATCOM Industry Revenue Share (%), by End User 2025 & 2033
- Figure 40: Middle East & Africa SATCOM Industry Revenue (billion), by Country 2025 & 2033
- Figure 41: Middle East & Africa SATCOM Industry Revenue Share (%), by Country 2025 & 2033
- Figure 42: Asia Pacific SATCOM Industry Revenue (billion), by Satellite Mass 2025 & 2033
- Figure 43: Asia Pacific SATCOM Industry Revenue Share (%), by Satellite Mass 2025 & 2033
- Figure 44: Asia Pacific SATCOM Industry Revenue (billion), by Orbit Class 2025 & 2033
- Figure 45: Asia Pacific SATCOM Industry Revenue Share (%), by Orbit Class 2025 & 2033
- Figure 46: Asia Pacific SATCOM Industry Revenue (billion), by Communication Type 2025 & 2033
- Figure 47: Asia Pacific SATCOM Industry Revenue Share (%), by Communication Type 2025 & 2033
- Figure 48: Asia Pacific SATCOM Industry Revenue (billion), by End User 2025 & 2033
- Figure 49: Asia Pacific SATCOM Industry Revenue Share (%), by End User 2025 & 2033
- Figure 50: Asia Pacific SATCOM Industry Revenue (billion), by Country 2025 & 2033
- Figure 51: Asia Pacific SATCOM Industry Revenue Share (%), by Country 2025 & 2033
List of Tables
- Table 1: Global SATCOM Industry Revenue billion Forecast, by Satellite Mass 2020 & 2033
- Table 2: Global SATCOM Industry Revenue billion Forecast, by Orbit Class 2020 & 2033
- Table 3: Global SATCOM Industry Revenue billion Forecast, by Communication Type 2020 & 2033
- Table 4: Global SATCOM Industry Revenue billion Forecast, by End User 2020 & 2033
- Table 5: Global SATCOM Industry Revenue billion Forecast, by Region 2020 & 2033
- Table 6: Global SATCOM Industry Revenue billion Forecast, by Satellite Mass 2020 & 2033
- Table 7: Global SATCOM Industry Revenue billion Forecast, by Orbit Class 2020 & 2033
- Table 8: Global SATCOM Industry Revenue billion Forecast, by Communication Type 2020 & 2033
- Table 9: Global SATCOM Industry Revenue billion Forecast, by End User 2020 & 2033
- Table 10: Global SATCOM Industry Revenue billion Forecast, by Country 2020 & 2033
- Table 11: United States SATCOM Industry Revenue (billion) Forecast, by Application 2020 & 2033
- Table 12: Canada SATCOM Industry Revenue (billion) Forecast, by Application 2020 & 2033
- Table 13: Mexico SATCOM Industry Revenue (billion) Forecast, by Application 2020 & 2033
- Table 14: Global SATCOM Industry Revenue billion Forecast, by Satellite Mass 2020 & 2033
- Table 15: Global SATCOM Industry Revenue billion Forecast, by Orbit Class 2020 & 2033
- Table 16: Global SATCOM Industry Revenue billion Forecast, by Communication Type 2020 & 2033
- Table 17: Global SATCOM Industry Revenue billion Forecast, by End User 2020 & 2033
- Table 18: Global SATCOM Industry Revenue billion Forecast, by Country 2020 & 2033
- Table 19: Brazil SATCOM Industry Revenue (billion) Forecast, by Application 2020 & 2033
- Table 20: Argentina SATCOM Industry Revenue (billion) Forecast, by Application 2020 & 2033
- Table 21: Rest of South America SATCOM Industry Revenue (billion) Forecast, by Application 2020 & 2033
- Table 22: Global SATCOM Industry Revenue billion Forecast, by Satellite Mass 2020 & 2033
- Table 23: Global SATCOM Industry Revenue billion Forecast, by Orbit Class 2020 & 2033
- Table 24: Global SATCOM Industry Revenue billion Forecast, by Communication Type 2020 & 2033
- Table 25: Global SATCOM Industry Revenue billion Forecast, by End User 2020 & 2033
- Table 26: Global SATCOM Industry Revenue billion Forecast, by Country 2020 & 2033
- Table 27: United Kingdom SATCOM Industry Revenue (billion) Forecast, by Application 2020 & 2033
- Table 28: Germany SATCOM Industry Revenue (billion) Forecast, by Application 2020 & 2033
- Table 29: France SATCOM Industry Revenue (billion) Forecast, by Application 2020 & 2033
- Table 30: Italy SATCOM Industry Revenue (billion) Forecast, by Application 2020 & 2033
- Table 31: Spain SATCOM Industry Revenue (billion) Forecast, by Application 2020 & 2033
- Table 32: Russia SATCOM Industry Revenue (billion) Forecast, by Application 2020 & 2033
- Table 33: Benelux SATCOM Industry Revenue (billion) Forecast, by Application 2020 & 2033
- Table 34: Nordics SATCOM Industry Revenue (billion) Forecast, by Application 2020 & 2033
- Table 35: Rest of Europe SATCOM Industry Revenue (billion) Forecast, by Application 2020 & 2033
- Table 36: Global SATCOM Industry Revenue billion Forecast, by Satellite Mass 2020 & 2033
- Table 37: Global SATCOM Industry Revenue billion Forecast, by Orbit Class 2020 & 2033
- Table 38: Global SATCOM Industry Revenue billion Forecast, by Communication Type 2020 & 2033
- Table 39: Global SATCOM Industry Revenue billion Forecast, by End User 2020 & 2033
- Table 40: Global SATCOM Industry Revenue billion Forecast, by Country 2020 & 2033
- Table 41: Turkey SATCOM Industry Revenue (billion) Forecast, by Application 2020 & 2033
- Table 42: Israel SATCOM Industry Revenue (billion) Forecast, by Application 2020 & 2033
- Table 43: GCC SATCOM Industry Revenue (billion) Forecast, by Application 2020 & 2033
- Table 44: North Africa SATCOM Industry Revenue (billion) Forecast, by Application 2020 & 2033
- Table 45: South Africa SATCOM Industry Revenue (billion) Forecast, by Application 2020 & 2033
- Table 46: Rest of Middle East & Africa SATCOM Industry Revenue (billion) Forecast, by Application 2020 & 2033
- Table 47: Global SATCOM Industry Revenue billion Forecast, by Satellite Mass 2020 & 2033
- Table 48: Global SATCOM Industry Revenue billion Forecast, by Orbit Class 2020 & 2033
- Table 49: Global SATCOM Industry Revenue billion Forecast, by Communication Type 2020 & 2033
- Table 50: Global SATCOM Industry Revenue billion Forecast, by End User 2020 & 2033
- Table 51: Global SATCOM Industry Revenue billion Forecast, by Country 2020 & 2033
- Table 52: China SATCOM Industry Revenue (billion) Forecast, by Application 2020 & 2033
- Table 53: India SATCOM Industry Revenue (billion) Forecast, by Application 2020 & 2033
- Table 54: Japan SATCOM Industry Revenue (billion) Forecast, by Application 2020 & 2033
- Table 55: South Korea SATCOM Industry Revenue (billion) Forecast, by Application 2020 & 2033
- Table 56: ASEAN SATCOM Industry Revenue (billion) Forecast, by Application 2020 & 2033
- Table 57: Oceania SATCOM Industry Revenue (billion) Forecast, by Application 2020 & 2033
- Table 58: Rest of Asia Pacific SATCOM Industry Revenue (billion) Forecast, by Application 2020 & 2033
Frequently Asked Questions
1. What is the projected Compound Annual Growth Rate (CAGR) of the SATCOM Industry?
The projected CAGR is approximately 11%.
2. Which companies are prominent players in the SATCOM Industry?
Key companies in the market include Space Exploration Technologies Corp, L3Harris Technologies Inc, Swarm Technologies Inc, Intelsat, Airbus SE, Viasat Inc, Cobham Limited, China Aerospace Science and Technology Corporation (CASC), Thales, SKY Perfect JSAT Corporation, SES S A, Maxar Technologies Inc, Thuraya Telecommunications Company, EchoStar Corporation.
3. What are the main segments of the SATCOM Industry?
The market segments include Satellite Mass, Orbit Class, Communication Type, End User.
4. Can you provide details about the market size?
The market size is estimated to be USD 98.28 billion as of 2022.
5. What are some drivers contributing to market growth?
N/A
6. What are the notable trends driving market growth?
OTHER KEY INDUSTRY TRENDS COVERED IN THE REPORT.
7. Are there any restraints impacting market growth?
N/A
8. Can you provide examples of recent developments in the market?
February 2023: Anuvu, a provider of high-speed connectivity solutions has signed an agreement with Telesat for new antennas and ground-station infrastructure to support the development of the Anuvu Constellation.February 2023: SES, in partnership with ThinKom and Hughes, has introduced a revolutionary high-performance multi-orbit service capable of supporting multiple solutions for government aerial missions. Open Architecture ThinKom ThinAir Ka2517 aerial satcom terminal has been successfully demonstrated on SES's Medium Earth Orbit (MEO) and Geostationary (GEO) satellite networksJanuary 2023: Satellite communications provider Viasat has been awarded a contract by the United States Marine Corps to provide end-to-end satellite communications support, extending the agreement under which it provides satellite communications solutions under managed services.
9. What pricing options are available for accessing the report?
Pricing options include single-user, multi-user, and enterprise licenses priced at USD 3800, USD 4500, and USD 5800 respectively.
10. Is the market size provided in terms of value or volume?
The market size is provided in terms of value, measured in billion.
11. Are there any specific market keywords associated with the report?
Yes, the market keyword associated with the report is "SATCOM Industry," which aids in identifying and referencing the specific market segment covered.
12. How do I determine which pricing option suits my needs best?
The pricing options vary based on user requirements and access needs. Individual users may opt for single-user licenses, while businesses requiring broader access may choose multi-user or enterprise licenses for cost-effective access to the report.
13. Are there any additional resources or data provided in the SATCOM Industry report?
While the report offers comprehensive insights, it's advisable to review the specific contents or supplementary materials provided to ascertain if additional resources or data are available.
14. How can I stay updated on further developments or reports in the SATCOM Industry?
To stay informed about further developments, trends, and reports in the SATCOM Industry, consider subscribing to industry newsletters, following relevant companies and organizations, or regularly checking reputable industry news sources and publications.
Methodology
Step 1 - Identification of Relevant Samples Size from Population Database


Step 2 - Approaches for Defining Global Market Size (Value, Volume* & Price*)

Note*: In applicable scenarios
Step 3 - Data Sources
Primary Research
- Web Analytics
- Survey Reports
- Research Institute
- Latest Research Reports
- Opinion Leaders
Secondary Research
- Annual Reports
- White Paper
- Latest Press Release
- Industry Association
- Paid Database
- Investor Presentations

Step 4 - Data Triangulation
Involves using different sources of information in order to increase the validity of a study
These sources are likely to be stakeholders in a program - participants, other researchers, program staff, other community members, and so on.
Then we put all data in single framework & apply various statistical tools to find out the dynamic on the market.
During the analysis stage, feedback from the stakeholder groups would be compared to determine areas of agreement as well as areas of divergence