

Key Insights
The Unexploded Ordnance (UXO) detection market is poised for significant expansion, fueled by escalating global defense expenditures, the critical need for land remediation in post-conflict regions, and burgeoning worldwide infrastructure development. The market is projected to reach a size of $3.15 billion by 2025, with a Compound Annual Growth Rate (CAGR) of 14.42%. Key growth drivers include advancements in sensor technologies such as ground-penetrating radar and metal detectors, the development of more efficient and portable detection systems, and the increasing integration of data analytics for enhanced accuracy. Stringent environmental regulations and heightened awareness of UXO-related risks also contribute to market momentum. The market is segmented into hardware and software, with hardware currently leading due to the inherent physical nature of UXO detection. While North America and Europe currently lead, the Asia-Pacific region is anticipated to experience substantial growth driven by infrastructure expansion and land reclamation initiatives. The competitive environment features both established industry leaders and innovative new entrants, fostering continuous technological advancement.
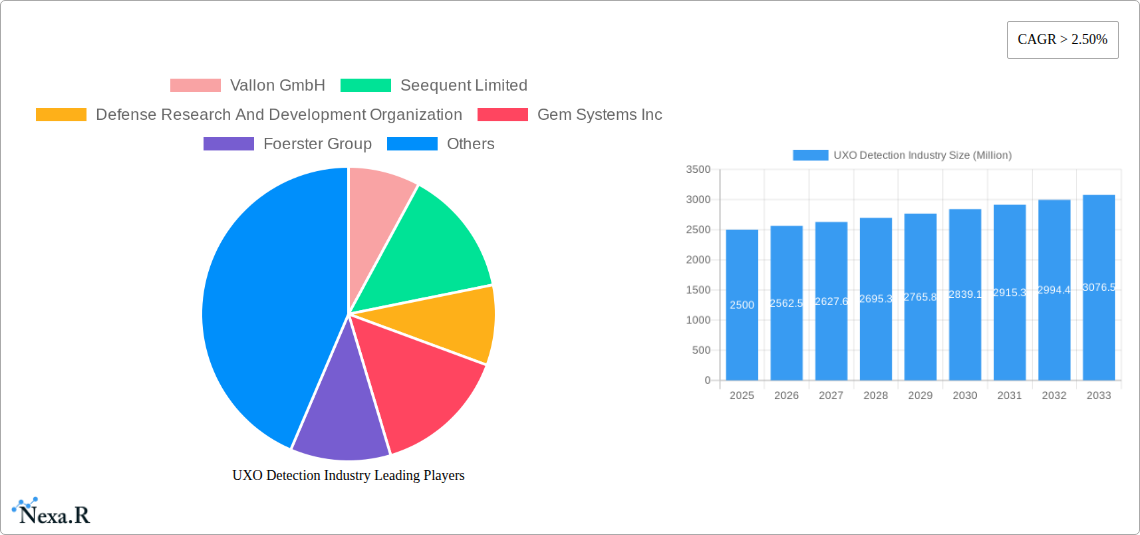
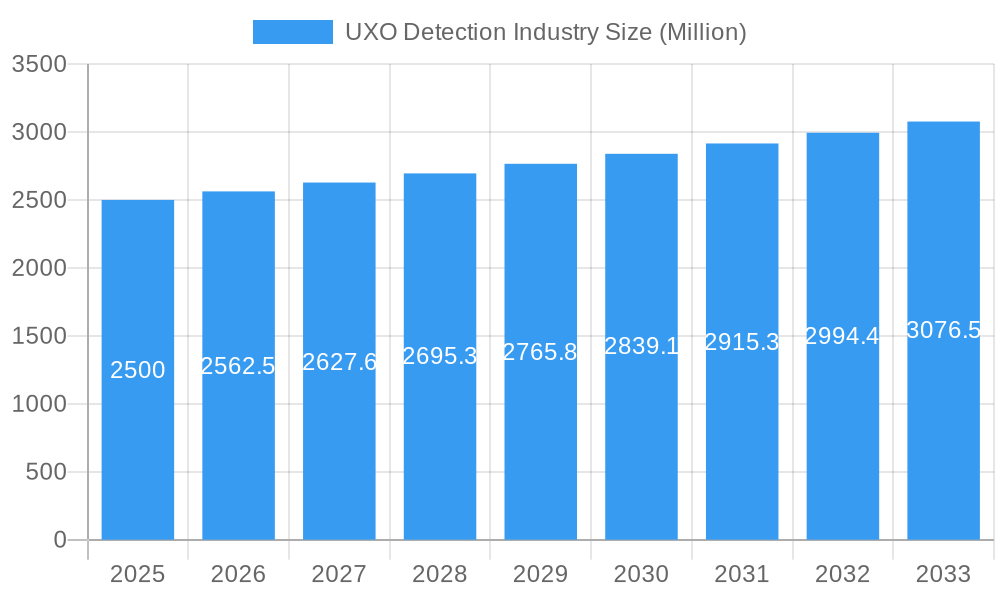
UXO Detection Industry Market Size (In Billion)
Despite a positive trajectory, the UXO detection market confronts certain challenges. Substantial upfront investment in advanced detection equipment can present a barrier, particularly for governmental and military entities. The complexity of detecting and clearing UXOs across diverse terrains and environmental conditions necessitates ongoing research and development to refine accuracy and efficiency. A shortage of skilled personnel trained to operate and interpret data from these systems also impacts broader adoption. Nevertheless, sustained investment in R&D, coupled with increased government funding and private sector collaborations, is expected to overcome these hurdles and propel market growth. The future landscape will likely be shaped by the development and integration of autonomous and AI-powered systems, promising enhanced efficiency and reduced operational risks.
UXO Detection Industry Company Market Share
UXO Detection Industry Market Report: 2019-2033
This comprehensive report provides an in-depth analysis of the UXO Detection industry, encompassing market dynamics, growth trends, regional landscapes, product innovations, and key players. With a study period spanning 2019-2033, a base year of 2025, and a forecast period of 2025-2033, this report is an indispensable resource for industry professionals, investors, and strategic decision-makers. The report segments the market by System Type (Hardware and Software), offering granular insights into market size and growth potential across different segments. The total market size in 2025 is estimated at xx Million.
UXO Detection Industry Market Dynamics & Structure
The UXO Detection market is characterized by a moderately concentrated landscape, with a few major players holding significant market share. The market is driven by technological innovations in sensor technology, data processing, and AI-powered analysis. Stringent regulatory frameworks governing UXO detection and remediation, particularly in post-conflict zones and areas with historical industrial activity, significantly impact market growth. Competitive substitutes, such as manual detection methods, are gradually being replaced by more efficient and reliable technological solutions. The end-user demographics include government agencies, defense contractors, environmental remediation firms, and private land developers. M&A activity in the sector has been moderate, with xx deals recorded in the historical period (2019-2024), representing an average of xx Million USD in deal value annually.
- Market Concentration: Moderately concentrated, with top 5 players holding approximately xx% market share in 2025.
- Technological Innovation Drivers: Advanced sensor technologies (e.g., GPR, magnetometers), AI-powered data analysis, and improved data visualization tools.
- Regulatory Frameworks: Stringent regulations concerning UXO detection and remediation practices influence market growth.
- Competitive Product Substitutes: Manual detection methods, but gradually being replaced by advanced technologies.
- End-User Demographics: Government agencies, defense contractors, environmental remediation firms, and private land developers.
- M&A Trends: Moderate M&A activity with xx deals in the historical period, averaging xx Million USD annually. Innovation barriers include high R&D costs and the need for specialized expertise.
UXO Detection Industry Growth Trends & Insights
The UXO Detection market experienced robust growth during the historical period (2019-2024), with a CAGR of xx%. This growth is primarily attributed to increasing government spending on defense and environmental remediation, coupled with rising awareness about the risks associated with unexploded ordnance. Technological advancements have significantly improved the efficiency and accuracy of UXO detection, further driving market adoption. The market penetration rate stood at xx% in 2025. Shifting consumer behavior towards safer and more sustainable land management practices is a significant factor contributing to market growth. We project a CAGR of xx% for the forecast period (2025-2033), with the market size expected to reach xx Million by 2033. The increasing demand for effective and efficient UXO detection solutions in various sectors like construction, infrastructure development, and land reclamation is also bolstering market growth. Technological disruptions, such as the integration of AI and machine learning, are anticipated to further accelerate market expansion.
Dominant Regions, Countries, or Segments in UXO Detection Industry
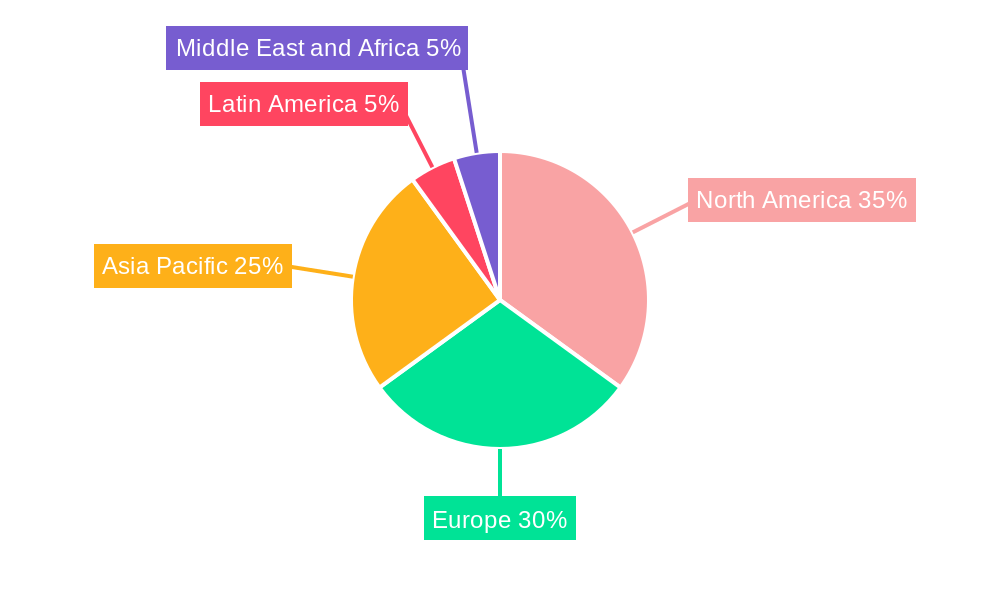
North America currently holds the largest market share in the UXO Detection industry, driven by significant government investments in defense and environmental remediation programs. Within the system type segment, Hardware dominates the market, representing xx% of the total market value in 2025, followed by Software at xx%. Europe follows North America as a key market, primarily due to a large number of post-conflict areas requiring extensive UXO clearance.
- Key Drivers in North America: High government spending on defense, stringent environmental regulations, and a strong presence of key players.
- Key Drivers in Europe: Extensive post-conflict areas requiring UXO clearance, substantial investments in infrastructure projects, and growing environmental awareness.
- Hardware Segment Dominance: High demand for advanced sensor technologies and equipment.
- Software Segment Growth: Increasing adoption of data analysis and visualization tools for improved efficiency and accuracy.
UXO Detection Industry Product Landscape
The UXO detection industry offers a range of products, including ground-penetrating radar (GPR), magnetometers, metal detectors, and specialized software for data analysis and visualization. Recent product innovations include AI-powered systems that can automate data interpretation and improve detection accuracy. Unique selling propositions revolve around improved sensitivity, portability, data processing speed, and ease of use. The integration of advanced technologies like hyperspectral imaging and LiDAR is further enhancing the performance of UXO detection systems.
Key Drivers, Barriers & Challenges in UXO Detection Industry
Key Drivers:
- Increasing government funding for defense and environmental remediation.
- Growing awareness of UXO risks and environmental concerns.
- Technological advancements in sensor technology and data analysis.
Key Challenges:
- High initial investment costs for advanced systems.
- Complex regulatory landscape and obtaining necessary permits.
- Potential supply chain disruptions impacting the availability of critical components. This results in a xx% increase in lead times for some key components, impacting overall project timelines and budgets.
Emerging Opportunities in UXO Detection Industry
Emerging opportunities lie in the development of autonomous and remotely operated UXO detection systems, the integration of advanced data analytics techniques for improved detection accuracy, and the expansion into new geographical markets with significant UXO contamination. The application of UXO detection technologies in other fields, like infrastructure development and archaeology, presents further growth potential.
Growth Accelerators in the UXO Detection Industry Industry
Technological breakthroughs, such as the development of more sensitive and robust sensors, are key growth accelerators. Strategic partnerships between technology providers and end-users are also vital for expanding market reach and ensuring effective technology deployment. Furthermore, market expansion into developing countries with significant UXO contamination will propel long-term growth.
Key Players Shaping the UXO Detection Industry Market
- Vallon GmbH
- Seequent Limited
- Defense Research And Development Organization
- Gem Systems Inc
- Foerster Group
- Schonstedt Instrument Company
- OPEC Systems Pty Ltd
- Dynasafe AB
- MRS Management Limited
Notable Milestones in UXO Detection Industry Sector
- 2020: Introduction of AI-powered UXO detection software by Gem Systems Inc.
- 2022: Acquisition of a smaller UXO detection firm by Vallon GmbH, expanding their product portfolio.
- 2023: Launch of a new generation of GPR systems by Foerster Group with significantly improved resolution.
In-Depth UXO Detection Industry Market Outlook
The future of the UXO detection industry is bright, driven by technological advancements and a growing need for effective UXO remediation. The market is poised for sustained growth, with significant opportunities in developing technologies, strategic partnerships, and expansion into new markets. Continued investment in research and development, coupled with a focus on innovative applications, will unlock further market potential and create strategic advantages for key players.
UXO Detection Industry Segmentation
-
1. System Type
- 1.1. Hardware
- 1.2. Software
UXO Detection Industry Segmentation By Geography
-
1. North America
- 1.1. United States
- 1.2. Canada
-
2. Europe
- 2.1. Germany
- 2.2. United Kingdom
- 2.3. France
- 2.4. Rest of Europe
-
3. Asia Pacific
- 3.1. India
- 3.2. China
- 3.3. Japan
- 3.4. South Korea
- 3.5. Rest of Asia Pacific
-
4. Latin America
- 4.1. Mexico
- 4.2. Brazil
- 4.3. Rest Of Latin America
-
5. Middle East and Africa
- 5.1. Saudi Arabia
- 5.2. Israel
- 5.3. Rest Of Middle East and Africa
UXO Detection Industry Regional Market Share
Geographic Coverage of UXO Detection Industry
UXO Detection Industry REPORT HIGHLIGHTS
| Aspects | Details |
|---|---|
| Study Period | 2020-2034 |
| Base Year | 2025 |
| Estimated Year | 2026 |
| Forecast Period | 2026-2034 |
| Historical Period | 2020-2025 |
| Growth Rate | CAGR of 14.42% from 2020-2034 |
| Segmentation |
|
Table of Contents
- 1. Introduction
- 1.1. Research Scope
- 1.2. Market Segmentation
- 1.3. Research Objective
- 1.4. Definitions and Assumptions
- 2. Executive Summary
- 2.1. Market Snapshot
- 3. Market Dynamics
- 3.1. Market Drivers
- 3.2. Market Restrains
- 3.3. Market Trends
- 3.4. Market Opportunities
- 4. Market Factor Analysis
- 4.1. Porters Five Forces
- 4.1.1. Bargaining Power of Suppliers
- 4.1.2. Bargaining Power of Buyers
- 4.1.3. Threat of New Entrants
- 4.1.4. Threat of Substitutes
- 4.1.5. Competitive Rivalry
- 4.2. PESTEL analysis
- 4.3. BCG Analysis
- 4.3.1. Stars (High Growth, High Market Share)
- 4.3.2. Cash Cows (Low Growth, High Market Share)
- 4.3.3. Question Mark (High Growth, Low Market Share)
- 4.3.4. Dogs (Low Growth, Low Market Share)
- 4.4. Ansoff Matrix Analysis
- 4.5. Supply Chain Analysis
- 4.6. Regulatory Landscape
- 4.7. Current Market Potential and Opportunity Assessment (TAM–SAM–SOM Framework)
- 4.8. NRP Analyst Note
- 4.1. Porters Five Forces
- 5. Market Analysis, Insights and Forecast 2021-2033
- 5.1. Market Analysis, Insights and Forecast - by System Type
- 5.1.1. Hardware
- 5.1.2. Software
- 5.2. Market Analysis, Insights and Forecast - by Region
- 5.2.1. North America
- 5.2.2. Europe
- 5.2.3. Asia Pacific
- 5.2.4. Latin America
- 5.2.5. Middle East and Africa
- 5.1. Market Analysis, Insights and Forecast - by System Type
- 6. Global UXO Detection Industry Analysis, Insights and Forecast, 2021-2033
- 6.1. Market Analysis, Insights and Forecast - by System Type
- 6.1.1. Hardware
- 6.1.2. Software
- 6.1. Market Analysis, Insights and Forecast - by System Type
- 7. North America UXO Detection Industry Analysis, Insights and Forecast, 2020-2032
- 7.1. Market Analysis, Insights and Forecast - by System Type
- 7.1.1. Hardware
- 7.1.2. Software
- 7.1. Market Analysis, Insights and Forecast - by System Type
- 8. Europe UXO Detection Industry Analysis, Insights and Forecast, 2020-2032
- 8.1. Market Analysis, Insights and Forecast - by System Type
- 8.1.1. Hardware
- 8.1.2. Software
- 8.1. Market Analysis, Insights and Forecast - by System Type
- 9. Asia Pacific UXO Detection Industry Analysis, Insights and Forecast, 2020-2032
- 9.1. Market Analysis, Insights and Forecast - by System Type
- 9.1.1. Hardware
- 9.1.2. Software
- 9.1. Market Analysis, Insights and Forecast - by System Type
- 10. Latin America UXO Detection Industry Analysis, Insights and Forecast, 2020-2032
- 10.1. Market Analysis, Insights and Forecast - by System Type
- 10.1.1. Hardware
- 10.1.2. Software
- 10.1. Market Analysis, Insights and Forecast - by System Type
- 11. Middle East and Africa UXO Detection Industry Analysis, Insights and Forecast, 2020-2032
- 11.1. Market Analysis, Insights and Forecast - by System Type
- 11.1.1. Hardware
- 11.1.2. Software
- 11.1. Market Analysis, Insights and Forecast - by System Type
- 12. Competitive Analysis
- 12.1. Company Profiles
- 12.1.1 Vallon GmbH
- 12.1.1.1. Company Overview
- 12.1.1.2. Products
- 12.1.1.3. Company Financials
- 12.1.1.4. SWOT Analysis
- 12.1.2 Seequent Limited
- 12.1.2.1. Company Overview
- 12.1.2.2. Products
- 12.1.2.3. Company Financials
- 12.1.2.4. SWOT Analysis
- 12.1.3 Defense Research And Development Organization
- 12.1.3.1. Company Overview
- 12.1.3.2. Products
- 12.1.3.3. Company Financials
- 12.1.3.4. SWOT Analysis
- 12.1.4 Gem Systems Inc
- 12.1.4.1. Company Overview
- 12.1.4.2. Products
- 12.1.4.3. Company Financials
- 12.1.4.4. SWOT Analysis
- 12.1.5 Foerster Group
- 12.1.5.1. Company Overview
- 12.1.5.2. Products
- 12.1.5.3. Company Financials
- 12.1.5.4. SWOT Analysis
- 12.1.6 Schonstedt Instrument Company
- 12.1.6.1. Company Overview
- 12.1.6.2. Products
- 12.1.6.3. Company Financials
- 12.1.6.4. SWOT Analysis
- 12.1.7 OPEC Systems Pty Ltd
- 12.1.7.1. Company Overview
- 12.1.7.2. Products
- 12.1.7.3. Company Financials
- 12.1.7.4. SWOT Analysis
- 12.1.8 Dynasafe AB
- 12.1.8.1. Company Overview
- 12.1.8.2. Products
- 12.1.8.3. Company Financials
- 12.1.8.4. SWOT Analysis
- 12.1.9 MRS Management Limited*List Not Exhaustive
- 12.1.9.1. Company Overview
- 12.1.9.2. Products
- 12.1.9.3. Company Financials
- 12.1.9.4. SWOT Analysis
- 12.1.1 Vallon GmbH
- 12.2. Market Entropy
- 12.2.1 Company's Key Areas Served
- 12.2.2 Recent Developments
- 12.3. Company Market Share Analysis 2025
- 12.3.1 Top 5 Companies Market Share Analysis
- 12.3.2 Top 3 Companies Market Share Analysis
- 12.4. List of Potential Customers
- 13. Research Methodology
List of Figures
- Figure 1: Global UXO Detection Industry Revenue Breakdown (billion, %) by Region 2025 & 2033
- Figure 2: North America UXO Detection Industry Revenue (billion), by System Type 2025 & 2033
- Figure 3: North America UXO Detection Industry Revenue Share (%), by System Type 2025 & 2033
- Figure 4: North America UXO Detection Industry Revenue (billion), by Country 2025 & 2033
- Figure 5: North America UXO Detection Industry Revenue Share (%), by Country 2025 & 2033
- Figure 6: Europe UXO Detection Industry Revenue (billion), by System Type 2025 & 2033
- Figure 7: Europe UXO Detection Industry Revenue Share (%), by System Type 2025 & 2033
- Figure 8: Europe UXO Detection Industry Revenue (billion), by Country 2025 & 2033
- Figure 9: Europe UXO Detection Industry Revenue Share (%), by Country 2025 & 2033
- Figure 10: Asia Pacific UXO Detection Industry Revenue (billion), by System Type 2025 & 2033
- Figure 11: Asia Pacific UXO Detection Industry Revenue Share (%), by System Type 2025 & 2033
- Figure 12: Asia Pacific UXO Detection Industry Revenue (billion), by Country 2025 & 2033
- Figure 13: Asia Pacific UXO Detection Industry Revenue Share (%), by Country 2025 & 2033
- Figure 14: Latin America UXO Detection Industry Revenue (billion), by System Type 2025 & 2033
- Figure 15: Latin America UXO Detection Industry Revenue Share (%), by System Type 2025 & 2033
- Figure 16: Latin America UXO Detection Industry Revenue (billion), by Country 2025 & 2033
- Figure 17: Latin America UXO Detection Industry Revenue Share (%), by Country 2025 & 2033
- Figure 18: Middle East and Africa UXO Detection Industry Revenue (billion), by System Type 2025 & 2033
- Figure 19: Middle East and Africa UXO Detection Industry Revenue Share (%), by System Type 2025 & 2033
- Figure 20: Middle East and Africa UXO Detection Industry Revenue (billion), by Country 2025 & 2033
- Figure 21: Middle East and Africa UXO Detection Industry Revenue Share (%), by Country 2025 & 2033
List of Tables
- Table 1: Global UXO Detection Industry Revenue billion Forecast, by System Type 2020 & 2033
- Table 2: Global UXO Detection Industry Revenue billion Forecast, by Region 2020 & 2033
- Table 3: Global UXO Detection Industry Revenue billion Forecast, by System Type 2020 & 2033
- Table 4: Global UXO Detection Industry Revenue billion Forecast, by Country 2020 & 2033
- Table 5: United States UXO Detection Industry Revenue (billion) Forecast, by Application 2020 & 2033
- Table 6: Canada UXO Detection Industry Revenue (billion) Forecast, by Application 2020 & 2033
- Table 7: Global UXO Detection Industry Revenue billion Forecast, by System Type 2020 & 2033
- Table 8: Global UXO Detection Industry Revenue billion Forecast, by Country 2020 & 2033
- Table 9: Germany UXO Detection Industry Revenue (billion) Forecast, by Application 2020 & 2033
- Table 10: United Kingdom UXO Detection Industry Revenue (billion) Forecast, by Application 2020 & 2033
- Table 11: France UXO Detection Industry Revenue (billion) Forecast, by Application 2020 & 2033
- Table 12: Rest of Europe UXO Detection Industry Revenue (billion) Forecast, by Application 2020 & 2033
- Table 13: Global UXO Detection Industry Revenue billion Forecast, by System Type 2020 & 2033
- Table 14: Global UXO Detection Industry Revenue billion Forecast, by Country 2020 & 2033
- Table 15: India UXO Detection Industry Revenue (billion) Forecast, by Application 2020 & 2033
- Table 16: China UXO Detection Industry Revenue (billion) Forecast, by Application 2020 & 2033
- Table 17: Japan UXO Detection Industry Revenue (billion) Forecast, by Application 2020 & 2033
- Table 18: South Korea UXO Detection Industry Revenue (billion) Forecast, by Application 2020 & 2033
- Table 19: Rest of Asia Pacific UXO Detection Industry Revenue (billion) Forecast, by Application 2020 & 2033
- Table 20: Global UXO Detection Industry Revenue billion Forecast, by System Type 2020 & 2033
- Table 21: Global UXO Detection Industry Revenue billion Forecast, by Country 2020 & 2033
- Table 22: Mexico UXO Detection Industry Revenue (billion) Forecast, by Application 2020 & 2033
- Table 23: Brazil UXO Detection Industry Revenue (billion) Forecast, by Application 2020 & 2033
- Table 24: Rest Of Latin America UXO Detection Industry Revenue (billion) Forecast, by Application 2020 & 2033
- Table 25: Global UXO Detection Industry Revenue billion Forecast, by System Type 2020 & 2033
- Table 26: Global UXO Detection Industry Revenue billion Forecast, by Country 2020 & 2033
- Table 27: Saudi Arabia UXO Detection Industry Revenue (billion) Forecast, by Application 2020 & 2033
- Table 28: Israel UXO Detection Industry Revenue (billion) Forecast, by Application 2020 & 2033
- Table 29: Rest Of Middle East and Africa UXO Detection Industry Revenue (billion) Forecast, by Application 2020 & 2033
Frequently Asked Questions
1. What is the projected Compound Annual Growth Rate (CAGR) of the UXO Detection Industry?
The projected CAGR is approximately 14.42%.
2. Which companies are prominent players in the UXO Detection Industry?
Key companies in the market include Vallon GmbH, Seequent Limited, Defense Research And Development Organization, Gem Systems Inc, Foerster Group, Schonstedt Instrument Company, OPEC Systems Pty Ltd, Dynasafe AB, MRS Management Limited*List Not Exhaustive.
3. What are the main segments of the UXO Detection Industry?
The market segments include System Type.
4. Can you provide details about the market size?
The market size is estimated to be USD 3.15 billion as of 2022.
5. What are some drivers contributing to market growth?
N/A
6. What are the notable trends driving market growth?
Hardware Segment To Exhibit The Highest Growth Rate.
7. Are there any restraints impacting market growth?
N/A
8. Can you provide examples of recent developments in the market?
N/A
9. What pricing options are available for accessing the report?
Pricing options include single-user, multi-user, and enterprise licenses priced at USD 4750, USD 5250, and USD 8750 respectively.
10. Is the market size provided in terms of value or volume?
The market size is provided in terms of value, measured in billion.
11. Are there any specific market keywords associated with the report?
Yes, the market keyword associated with the report is "UXO Detection Industry," which aids in identifying and referencing the specific market segment covered.
12. How do I determine which pricing option suits my needs best?
The pricing options vary based on user requirements and access needs. Individual users may opt for single-user licenses, while businesses requiring broader access may choose multi-user or enterprise licenses for cost-effective access to the report.
13. Are there any additional resources or data provided in the UXO Detection Industry report?
While the report offers comprehensive insights, it's advisable to review the specific contents or supplementary materials provided to ascertain if additional resources or data are available.
14. How can I stay updated on further developments or reports in the UXO Detection Industry?
To stay informed about further developments, trends, and reports in the UXO Detection Industry, consider subscribing to industry newsletters, following relevant companies and organizations, or regularly checking reputable industry news sources and publications.
Methodology
Step 1 - Identification of Relevant Samples Size from Population Database


Step 2 - Approaches for Defining Global Market Size (Value, Volume* & Price*)

Note*: In applicable scenarios
Step 3 - Data Sources
Primary Research
- Web Analytics
- Survey Reports
- Research Institute
- Latest Research Reports
- Opinion Leaders
Secondary Research
- Annual Reports
- White Paper
- Latest Press Release
- Industry Association
- Paid Database
- Investor Presentations

Step 4 - Data Triangulation
Involves using different sources of information in order to increase the validity of a study
These sources are likely to be stakeholders in a program - participants, other researchers, program staff, other community members, and so on.
Then we put all data in single framework & apply various statistical tools to find out the dynamic on the market.
During the analysis stage, feedback from the stakeholder groups would be compared to determine areas of agreement as well as areas of divergence