

Key Insights
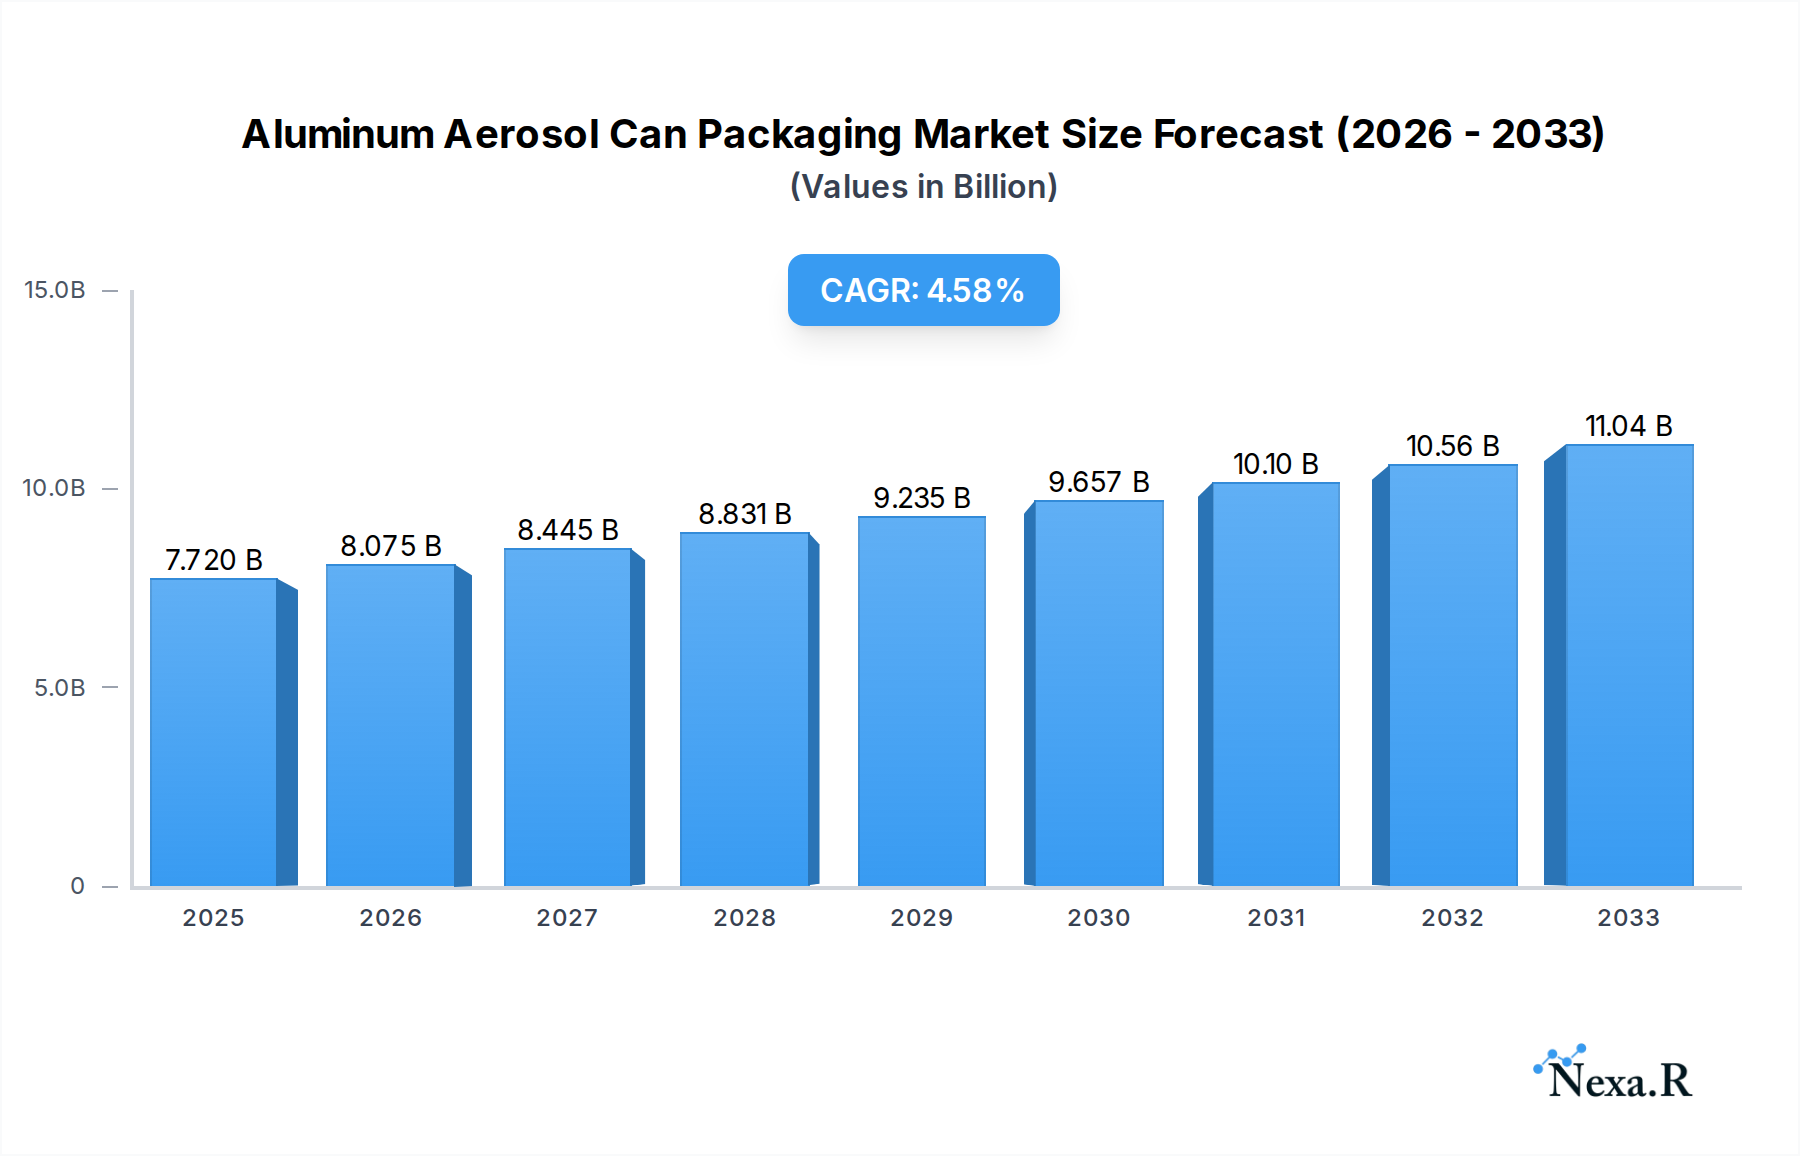
The global Aluminum Aerosol Can Packaging market is poised for substantial growth, reaching an estimated USD 7.72 billion in 2025, driven by an anticipated Compound Annual Growth Rate (CAGR) of 4.62% through 2033. This robust expansion is fueled by the increasing consumer demand for convenience and portability across various product categories, particularly in the Cosmetics & Personal Care and Household Products segments. The inherent sustainability of aluminum, its lightweight nature, and excellent barrier properties make it an increasingly favored packaging choice for brands aiming to align with eco-conscious consumer preferences. Furthermore, advancements in manufacturing technologies are enabling more efficient production and innovative designs, further stimulating market adoption. The Medical and Medicine segment is also showing promising growth, as aerosol delivery systems offer a safe and effective method for dispensing pharmaceuticals and other medical treatments.

Aluminum Aerosol Can Packaging Market Size (In Billion)
The market dynamics are further shaped by a notable shift towards smaller-sized packaging, with cans below 200ml witnessing significant traction, reflecting a growing trend in single-use and travel-sized products. While the market benefits from strong demand drivers, it also faces certain restraints. The fluctuating prices of raw materials, particularly aluminum, can impact profitability for manufacturers. Additionally, the increasing competition from alternative packaging materials, such as plastics and glass, necessitates continuous innovation and cost-efficiency in aluminum aerosol can production. However, the overall outlook remains highly positive, with key players like Ball Corporation and Trivium Packaging actively investing in research and development to enhance product offerings and expand their global footprint, particularly in high-growth regions like Asia Pacific and North America.
Aluminum Aerosol Can Packaging Company Market Share
Comprehensive Report: Aluminum Aerosol Can Packaging Market Analysis & Forecast 2019–2033
This in-depth report provides a critical analysis of the global Aluminum Aerosol Can Packaging market, offering detailed insights and robust forecasts for industry stakeholders. Spanning the historical period of 2019–2024 and projecting to 2033, with a base year of 2025, this research delves into market dynamics, growth trends, regional dominance, product landscape, key drivers, emerging opportunities, and the competitive environment. We analyze both the parent market of metal packaging and the specific child market of aluminum aerosol cans, ensuring a holistic view for strategic decision-making. All quantitative data is presented in billion units for clarity and comparability.
Aluminum Aerosol Can Packaging Market Dynamics & Structure
The global Aluminum Aerosol Can Packaging market is characterized by moderate concentration, with key players like Ball Corporation and Trivium Packaging holding significant market shares. Technological innovation, particularly in lightweighting, enhanced barrier properties, and sustainable manufacturing processes, serves as a primary driver. Regulatory frameworks, including stringent environmental standards and product safety mandates, influence material choices and manufacturing practices. Competitive product substitutes, such as plastic aerosol cans and pump spray bottles, present ongoing challenges. End-user demographics, shifting towards convenience and eco-conscious purchasing, are shaping product demand. Mergers and acquisitions (M&A) activity, while not consistently high in volume, often signal strategic consolidation and expansion.
- Market Concentration: Top players account for approximately 65% of the market share.
- Technological Innovation: Focus on advanced coatings, thinner gauges, and recyclable designs.
- Regulatory Impact: Growing emphasis on circular economy principles and reduced VOC emissions.
- Competitive Landscape: Ongoing innovation required to compete with alternative dispensing systems.
- End-User Demand: Increasing preference for premium, aesthetically pleasing, and sustainable packaging.
- M&A Activity: Sporadic, but strategically significant, with recent deals focused on expanding production capacity and geographical reach.
Aluminum Aerosol Can Packaging Growth Trends & Insights
The Aluminum Aerosol Can Packaging market is poised for robust expansion, driven by escalating demand across diverse application segments and a growing consumer preference for sustainable packaging solutions. The overall metal packaging market, serving as the parent market, provides a stable foundation, while the child market of aluminum aerosol cans exhibits dynamic growth fueled by specific end-user needs and advancements in manufacturing technology.
Market Size Evolution: The global Aluminum Aerosol Can Packaging market is projected to witness substantial growth. From a market size of an estimated 35 billion units in 2019, the market is expected to reach approximately 52 billion units by 2033. This represents a Compound Annual Growth Rate (CAGR) of roughly 4.5% over the forecast period.
Adoption Rates & Technological Disruptions: The adoption of aluminum aerosol cans is steadily increasing, particularly in the cosmetics, personal care, and household product sectors, due to their excellent barrier properties, recyclability, and premium feel. Technological disruptions, such as advancements in can manufacturing processes leading to lighter yet stronger cans and improved printing techniques for enhanced brand aesthetics, are further accelerating this adoption. The development of specialized internal coatings that ensure product integrity and compatibility is also a key factor. Furthermore, the growing awareness and consumer preference for recyclable and sustainable packaging materials are significantly boosting the appeal of aluminum aerosol cans over less sustainable alternatives.
Consumer Behavior Shifts: Evolving consumer behaviors are a critical growth engine. Consumers are increasingly prioritizing products with eco-friendly packaging, and aluminum's high recyclability rate aligns perfectly with these demands. The convenience and safety offered by aerosol cans, particularly for hygiene products, personal care items, and household sprays, continue to drive their widespread use. The perceived premium quality and brand image associated with aluminum packaging also resonate with consumers, especially in the cosmetics and luxury goods segments. The demand for single-use, portable, and effective dispensing solutions further solidifies the position of aluminum aerosol cans in the market.
Market Penetration: The market penetration of aluminum aerosol cans is expected to deepen, particularly in emerging economies where disposable incomes are rising, and the demand for packaged goods is surging. As manufacturers increasingly invest in local production capabilities and leverage economies of scale, the cost-effectiveness of aluminum aerosol cans will improve, making them more accessible to a wider range of products and consumers. The continued innovation in product formulations also necessitates advanced packaging solutions, which aluminum aerosol cans are well-equipped to provide. The sustainability narrative surrounding aluminum, a material with a well-established and efficient recycling infrastructure, is a powerful differentiator in today's environmentally conscious marketplace, ensuring its continued relevance and growth.
Dominant Regions, Countries, or Segments in Aluminum Aerosol Can Packaging
The Aluminum Aerosol Can Packaging market's dominance is a complex interplay of regional economic strengths, evolving consumer preferences, and segment-specific demand drivers. While the parent market of metal packaging sees broad-based growth, the child market of aluminum aerosol cans showcases distinct regional and segment leadership.
North America and Europe currently represent the most dominant regions, driven by mature economies with high disposable incomes and a strong consumer focus on personal care, cosmetics, and household products. These regions also have well-established recycling infrastructures and a heightened awareness of environmental sustainability, further bolstering the demand for aluminum aerosol cans. Regulatory frameworks in these areas often promote sustainable packaging solutions, giving aluminum an advantage.
Within these regions, the Cosmetics & Personal Care segment consistently leads in terms of market share and growth potential for aluminum aerosol cans. This is attributed to the premium perception of aluminum packaging, its ability to protect sensitive formulations, and the demand for convenient dispensing in products like hairsprays, deodorants, shaving foams, and sunscreens. The aesthetic appeal and brand differentiation offered by aluminum cans are crucial in this highly competitive sector.
However, significant growth is also observed in the Household Products segment, encompassing cleaning sprays, air fresheners, and insecticides. The need for safe, effective, and easy-to-use dispensing solutions drives this demand. As consumers become more discerning about product performance and packaging safety, aluminum aerosol cans offer a reliable and preferred option.
The Medical and Medicine segment, while smaller in current volume, presents a substantial growth opportunity. The inertness of aluminum, its ability to maintain product sterility, and its suitability for various pharmaceutical formulations, such as metered-dose inhalers and topical sprays, are driving increased adoption. Stringent regulatory requirements in this sector favor materials like aluminum that offer high levels of product protection and safety.
In terms of can Types, the 200ml-500ml category is currently the most dominant. This size range is optimal for a wide array of consumer products, offering a good balance between product quantity and portability. However, there is a growing trend towards smaller sizes, Less than 200ml, for travel-sized products and single-use applications, as well as larger formats More than 500ml for industrial and institutional use.
Key drivers contributing to regional and segment dominance include:
- Economic Policies: Supportive policies for manufacturing and recycling incentivize local production and market growth.
- Consumer Spending Power: Higher disposable incomes in leading regions translate to greater demand for packaged goods.
- Brand Innovation: Continuous product development and marketing strategies by brands in key segments.
- Sustainability Initiatives: Growing corporate and consumer focus on eco-friendly packaging materials.
- Infrastructure Development: Robust supply chains and efficient logistics networks facilitate market access.
- Technological Advancements: Innovations in can manufacturing, printing, and coating technologies catering to specific segment needs.
The market share of the Cosmetics & Personal Care segment is estimated to be around 40% of the total aluminum aerosol can packaging market, with Household Products following at approximately 30%. The 200ml-500ml can type holds an estimated 45% market share.
Aluminum Aerosol Can Packaging Product Landscape
The Aluminum Aerosol Can Packaging product landscape is defined by innovation focused on enhancing functionality, sustainability, and aesthetic appeal. Manufacturers are continuously developing thinner-walled yet stronger cans through advanced alloys and sophisticated forming techniques, contributing to lightweighting efforts and reduced material consumption. Specialized internal coatings are crucial for ensuring compatibility with a wide range of product formulations, from sensitive pharmaceuticals and personal care products to industrial lubricants and paints. The visual appeal is significantly enhanced through high-quality printing, including advanced graphics, matte finishes, and tactile varnishes, allowing brands to achieve premium positioning. Furthermore, the inherent recyclability of aluminum is a key product attribute, aligning with growing environmental consciousness.
Key Drivers, Barriers & Challenges in Aluminum Aerosol Can Packaging
Key Drivers:
- Sustainability and Recyclability: The high recyclability rate of aluminum, coupled with increasing consumer demand for eco-friendly packaging, is a primary growth driver.
- Product Protection and Shelf-Life: Aluminum's excellent barrier properties protect contents from light, oxygen, and moisture, extending shelf-life and maintaining product integrity, crucial for cosmetics, personal care, and pharmaceuticals.
- Convenience and Ease of Use: Aerosol cans offer a convenient, controlled, and hygienic dispensing method for a wide array of products.
- Lightweighting and Durability: Advancements in manufacturing allow for lighter yet robust cans, reducing transportation costs and material usage.
- Premium Brand Perception: Aluminum packaging is often associated with a premium image, appealing to luxury and high-end product brands.
Barriers & Challenges:
- Raw Material Price Volatility: Fluctuations in aluminum prices can impact manufacturing costs and final product pricing.
- Competition from Alternatives: Plastic aerosol cans, pump dispensers, and other packaging formats offer competitive pricing and specific functional advantages.
- Energy-Intensive Production: The primary production of aluminum is energy-intensive, though recycling significantly reduces this footprint.
- Regulatory Compliance: Evolving regulations regarding propellants, material safety, and labeling add complexity and cost.
- Supply Chain Disruptions: Global events can impact the availability and cost of raw materials and finished goods. The global supply chain for aluminum aerosol cans faced significant disruptions during the historical period, impacting production schedules and leading to price increases estimated at 15-20% for certain components.
Emerging Opportunities in Aluminum Aerosol Can Packaging
Emerging opportunities in the Aluminum Aerosol Can Packaging sector lie in the development of advanced sustainable solutions and the expansion into new application areas. Innovations in lightweighting, utilizing thinner gauges and advanced alloys, will continue to drive cost efficiencies and environmental benefits. The growing demand for personalized and single-use products presents an opportunity for smaller format aluminum aerosol cans in niche consumer segments. Furthermore, the expansion of the medical and pharmaceutical sectors, particularly in developing economies, offers significant potential for specialized aluminum aerosol packaging for metered-dose inhalers and topical treatments. The increasing focus on clean beauty and natural ingredients also favors aluminum's inertness and protective qualities.
Growth Accelerators in the Aluminum Aerosol Can Packaging Industry
Long-term growth in the Aluminum Aerosol Can Packaging industry will be significantly accelerated by continued technological advancements in material science and manufacturing processes. The development of even lighter, stronger, and more easily recyclable aluminum alloys will further enhance the material's competitive edge. Strategic partnerships between can manufacturers and chemical companies to develop and integrate more sustainable propellants and internal coatings will also be crucial. Market expansion into emerging economies, driven by rising disposable incomes and increasing consumer product penetration, will provide substantial volume growth. The increasing emphasis on circular economy principles by governments and corporations will also act as a powerful accelerator, favoring materials like aluminum with proven recycling capabilities and extensive recycling infrastructure.
Key Players Shaping the Aluminum Aerosol Can Packaging Market
- Ball Corporation
- Trivium Packaging
- CCL Containers
- TUBEX GmbH
- Moravia Cans
- LINHARDT
- ALLTUB
- ALUCON
- Jamestrong
- Aryum
- Bispharma
- Gulf Cans Industries
- Euro Asia Packaging
- Bharat Containers
- Montebello Packaging
- Condensa
Notable Milestones in Aluminum Aerosol Can Packaging Sector
- 2019: Increased investment in lightweighting technologies by major manufacturers to reduce material costs and environmental impact.
- 2020: Rise in demand for sanitizing sprays and disinfectants, boosting production of aluminum aerosol cans for household and personal care.
- 2021: Growing consumer awareness and regulatory pressure push for the development of more sustainable propellants and packaging materials.
- 2022: Focus on supply chain resilience and diversification due to global geopolitical and economic uncertainties.
- 2023: Advancements in digital printing technologies enable enhanced customization and brand differentiation on aluminum aerosol cans.
- 2024: Increased R&D efforts towards developing 100% recycled content aluminum aerosol cans to meet ambitious sustainability targets.
In-Depth Aluminum Aerosol Can Packaging Market Outlook
The outlook for the Aluminum Aerosol Can Packaging market remains highly positive, driven by a confluence of escalating demand for sustainable and convenient packaging solutions. The inherent recyclability of aluminum positions it favorably against less environmentally friendly alternatives. Continuous innovation in lightweighting and advanced barrier technologies will further enhance its appeal across diverse applications, from high-end cosmetics to essential medical products. The expansion of end-user industries in emerging economies and a growing global consciousness towards eco-friendly consumption patterns are set to fuel significant market growth over the forecast period. Strategic investments in advanced manufacturing and robust recycling infrastructure will be critical for players to capitalize on these promising opportunities and maintain a competitive edge.
Aluminum Aerosol Can Packaging Segmentation
-
1. Application
- 1.1. Cosmetics & Personal Care
- 1.2. Household Products
- 1.3. Medical and Medicine
- 1.4. Industrial
- 1.5. Others
-
2. Types
- 2.1. Less than 200ml
- 2.2. 200ml-500ml
- 2.3. More than 500ml
Aluminum Aerosol Can Packaging Segmentation By Geography
-
1. North America
- 1.1. United States
- 1.2. Canada
- 1.3. Mexico
-
2. South America
- 2.1. Brazil
- 2.2. Argentina
- 2.3. Rest of South America
-
3. Europe
- 3.1. United Kingdom
- 3.2. Germany
- 3.3. France
- 3.4. Italy
- 3.5. Spain
- 3.6. Russia
- 3.7. Benelux
- 3.8. Nordics
- 3.9. Rest of Europe
-
4. Middle East & Africa
- 4.1. Turkey
- 4.2. Israel
- 4.3. GCC
- 4.4. North Africa
- 4.5. South Africa
- 4.6. Rest of Middle East & Africa
-
5. Asia Pacific
- 5.1. China
- 5.2. India
- 5.3. Japan
- 5.4. South Korea
- 5.5. ASEAN
- 5.6. Oceania
- 5.7. Rest of Asia Pacific
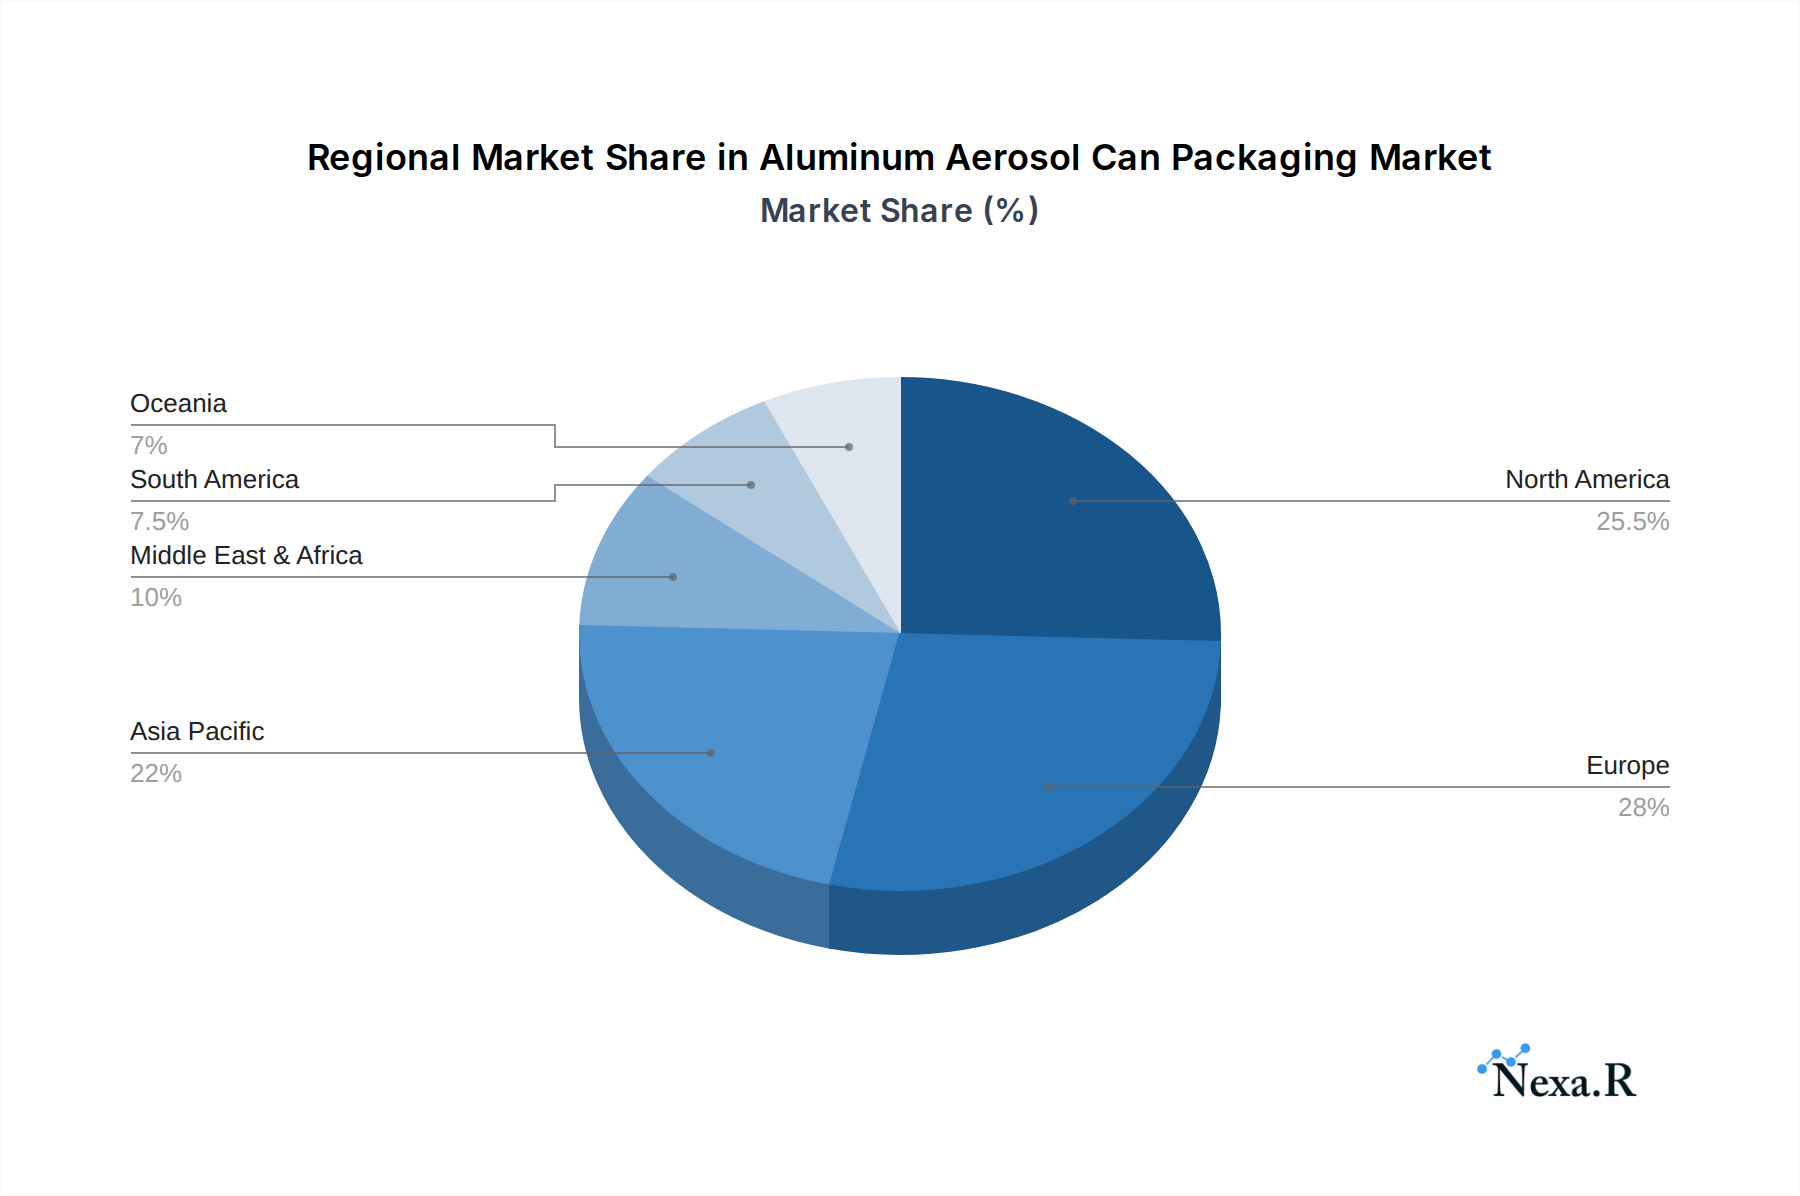
Aluminum Aerosol Can Packaging Regional Market Share
Geographic Coverage of Aluminum Aerosol Can Packaging
Aluminum Aerosol Can Packaging REPORT HIGHLIGHTS
| Aspects | Details |
|---|---|
| Study Period | 2020-2034 |
| Base Year | 2025 |
| Estimated Year | 2026 |
| Forecast Period | 2026-2034 |
| Historical Period | 2020-2025 |
| Growth Rate | CAGR of 4.62% from 2020-2034 |
| Segmentation |
|
Table of Contents
- 1. Introduction
- 1.1. Research Scope
- 1.2. Market Segmentation
- 1.3. Research Objective
- 1.4. Definitions and Assumptions
- 2. Executive Summary
- 2.1. Market Snapshot
- 3. Market Dynamics
- 3.1. Market Drivers
- 3.2. Market Restrains
- 3.3. Market Trends
- 3.4. Market Opportunities
- 4. Market Factor Analysis
- 4.1. Porters Five Forces
- 4.1.1. Bargaining Power of Suppliers
- 4.1.2. Bargaining Power of Buyers
- 4.1.3. Threat of New Entrants
- 4.1.4. Threat of Substitutes
- 4.1.5. Competitive Rivalry
- 4.2. PESTEL analysis
- 4.3. BCG Analysis
- 4.3.1. Stars (High Growth, High Market Share)
- 4.3.2. Cash Cows (Low Growth, High Market Share)
- 4.3.3. Question Mark (High Growth, Low Market Share)
- 4.3.4. Dogs (Low Growth, Low Market Share)
- 4.4. Ansoff Matrix Analysis
- 4.5. Supply Chain Analysis
- 4.6. Regulatory Landscape
- 4.7. Current Market Potential and Opportunity Assessment (TAM–SAM–SOM Framework)
- 4.8. NRP Analyst Note
- 4.1. Porters Five Forces
- 5. Market Analysis, Insights and Forecast 2021-2033
- 5.1. Market Analysis, Insights and Forecast - by Application
- 5.1.1. Cosmetics & Personal Care
- 5.1.2. Household Products
- 5.1.3. Medical and Medicine
- 5.1.4. Industrial
- 5.1.5. Others
- 5.2. Market Analysis, Insights and Forecast - by Types
- 5.2.1. Less than 200ml
- 5.2.2. 200ml-500ml
- 5.2.3. More than 500ml
- 5.3. Market Analysis, Insights and Forecast - by Region
- 5.3.1. North America
- 5.3.2. South America
- 5.3.3. Europe
- 5.3.4. Middle East & Africa
- 5.3.5. Asia Pacific
- 5.1. Market Analysis, Insights and Forecast - by Application
- 6. Global Aluminum Aerosol Can Packaging Analysis, Insights and Forecast, 2021-2033
- 6.1. Market Analysis, Insights and Forecast - by Application
- 6.1.1. Cosmetics & Personal Care
- 6.1.2. Household Products
- 6.1.3. Medical and Medicine
- 6.1.4. Industrial
- 6.1.5. Others
- 6.2. Market Analysis, Insights and Forecast - by Types
- 6.2.1. Less than 200ml
- 6.2.2. 200ml-500ml
- 6.2.3. More than 500ml
- 6.1. Market Analysis, Insights and Forecast - by Application
- 7. North America Aluminum Aerosol Can Packaging Analysis, Insights and Forecast, 2020-2032
- 7.1. Market Analysis, Insights and Forecast - by Application
- 7.1.1. Cosmetics & Personal Care
- 7.1.2. Household Products
- 7.1.3. Medical and Medicine
- 7.1.4. Industrial
- 7.1.5. Others
- 7.2. Market Analysis, Insights and Forecast - by Types
- 7.2.1. Less than 200ml
- 7.2.2. 200ml-500ml
- 7.2.3. More than 500ml
- 7.1. Market Analysis, Insights and Forecast - by Application
- 8. South America Aluminum Aerosol Can Packaging Analysis, Insights and Forecast, 2020-2032
- 8.1. Market Analysis, Insights and Forecast - by Application
- 8.1.1. Cosmetics & Personal Care
- 8.1.2. Household Products
- 8.1.3. Medical and Medicine
- 8.1.4. Industrial
- 8.1.5. Others
- 8.2. Market Analysis, Insights and Forecast - by Types
- 8.2.1. Less than 200ml
- 8.2.2. 200ml-500ml
- 8.2.3. More than 500ml
- 8.1. Market Analysis, Insights and Forecast - by Application
- 9. Europe Aluminum Aerosol Can Packaging Analysis, Insights and Forecast, 2020-2032
- 9.1. Market Analysis, Insights and Forecast - by Application
- 9.1.1. Cosmetics & Personal Care
- 9.1.2. Household Products
- 9.1.3. Medical and Medicine
- 9.1.4. Industrial
- 9.1.5. Others
- 9.2. Market Analysis, Insights and Forecast - by Types
- 9.2.1. Less than 200ml
- 9.2.2. 200ml-500ml
- 9.2.3. More than 500ml
- 9.1. Market Analysis, Insights and Forecast - by Application
- 10. Middle East & Africa Aluminum Aerosol Can Packaging Analysis, Insights and Forecast, 2020-2032
- 10.1. Market Analysis, Insights and Forecast - by Application
- 10.1.1. Cosmetics & Personal Care
- 10.1.2. Household Products
- 10.1.3. Medical and Medicine
- 10.1.4. Industrial
- 10.1.5. Others
- 10.2. Market Analysis, Insights and Forecast - by Types
- 10.2.1. Less than 200ml
- 10.2.2. 200ml-500ml
- 10.2.3. More than 500ml
- 10.1. Market Analysis, Insights and Forecast - by Application
- 11. Asia Pacific Aluminum Aerosol Can Packaging Analysis, Insights and Forecast, 2020-2032
- 11.1. Market Analysis, Insights and Forecast - by Application
- 11.1.1. Cosmetics & Personal Care
- 11.1.2. Household Products
- 11.1.3. Medical and Medicine
- 11.1.4. Industrial
- 11.1.5. Others
- 11.2. Market Analysis, Insights and Forecast - by Types
- 11.2.1. Less than 200ml
- 11.2.2. 200ml-500ml
- 11.2.3. More than 500ml
- 11.1. Market Analysis, Insights and Forecast - by Application
- 12. Competitive Analysis
- 12.1. Company Profiles
- 12.1.1 Ball Corporation
- 12.1.1.1. Company Overview
- 12.1.1.2. Products
- 12.1.1.3. Company Financials
- 12.1.1.4. SWOT Analysis
- 12.1.2 Trivium Packaging
- 12.1.2.1. Company Overview
- 12.1.2.2. Products
- 12.1.2.3. Company Financials
- 12.1.2.4. SWOT Analysis
- 12.1.3 CCL Containers
- 12.1.3.1. Company Overview
- 12.1.3.2. Products
- 12.1.3.3. Company Financials
- 12.1.3.4. SWOT Analysis
- 12.1.4 TUBEX GmbH
- 12.1.4.1. Company Overview
- 12.1.4.2. Products
- 12.1.4.3. Company Financials
- 12.1.4.4. SWOT Analysis
- 12.1.5 Moravia Cans
- 12.1.5.1. Company Overview
- 12.1.5.2. Products
- 12.1.5.3. Company Financials
- 12.1.5.4. SWOT Analysis
- 12.1.6 LINHARDT
- 12.1.6.1. Company Overview
- 12.1.6.2. Products
- 12.1.6.3. Company Financials
- 12.1.6.4. SWOT Analysis
- 12.1.7 ALLTUB
- 12.1.7.1. Company Overview
- 12.1.7.2. Products
- 12.1.7.3. Company Financials
- 12.1.7.4. SWOT Analysis
- 12.1.8 ALUCON
- 12.1.8.1. Company Overview
- 12.1.8.2. Products
- 12.1.8.3. Company Financials
- 12.1.8.4. SWOT Analysis
- 12.1.9 Jamestrong
- 12.1.9.1. Company Overview
- 12.1.9.2. Products
- 12.1.9.3. Company Financials
- 12.1.9.4. SWOT Analysis
- 12.1.10 Aryum
- 12.1.10.1. Company Overview
- 12.1.10.2. Products
- 12.1.10.3. Company Financials
- 12.1.10.4. SWOT Analysis
- 12.1.11 Bispharma
- 12.1.11.1. Company Overview
- 12.1.11.2. Products
- 12.1.11.3. Company Financials
- 12.1.11.4. SWOT Analysis
- 12.1.12 Gulf Cans Industries
- 12.1.12.1. Company Overview
- 12.1.12.2. Products
- 12.1.12.3. Company Financials
- 12.1.12.4. SWOT Analysis
- 12.1.13 Euro Asia Packaging
- 12.1.13.1. Company Overview
- 12.1.13.2. Products
- 12.1.13.3. Company Financials
- 12.1.13.4. SWOT Analysis
- 12.1.14 Bharat Containers
- 12.1.14.1. Company Overview
- 12.1.14.2. Products
- 12.1.14.3. Company Financials
- 12.1.14.4. SWOT Analysis
- 12.1.15 Montebello Packaging
- 12.1.15.1. Company Overview
- 12.1.15.2. Products
- 12.1.15.3. Company Financials
- 12.1.15.4. SWOT Analysis
- 12.1.16 Condensa
- 12.1.16.1. Company Overview
- 12.1.16.2. Products
- 12.1.16.3. Company Financials
- 12.1.16.4. SWOT Analysis
- 12.1.1 Ball Corporation
- 12.2. Market Entropy
- 12.2.1 Company's Key Areas Served
- 12.2.2 Recent Developments
- 12.3. Company Market Share Analysis 2025
- 12.3.1 Top 5 Companies Market Share Analysis
- 12.3.2 Top 3 Companies Market Share Analysis
- 12.4. List of Potential Customers
- 13. Research Methodology
List of Figures
- Figure 1: Global Aluminum Aerosol Can Packaging Revenue Breakdown (undefined, %) by Region 2025 & 2033
- Figure 2: Global Aluminum Aerosol Can Packaging Volume Breakdown (K, %) by Region 2025 & 2033
- Figure 3: North America Aluminum Aerosol Can Packaging Revenue (undefined), by Application 2025 & 2033
- Figure 4: North America Aluminum Aerosol Can Packaging Volume (K), by Application 2025 & 2033
- Figure 5: North America Aluminum Aerosol Can Packaging Revenue Share (%), by Application 2025 & 2033
- Figure 6: North America Aluminum Aerosol Can Packaging Volume Share (%), by Application 2025 & 2033
- Figure 7: North America Aluminum Aerosol Can Packaging Revenue (undefined), by Types 2025 & 2033
- Figure 8: North America Aluminum Aerosol Can Packaging Volume (K), by Types 2025 & 2033
- Figure 9: North America Aluminum Aerosol Can Packaging Revenue Share (%), by Types 2025 & 2033
- Figure 10: North America Aluminum Aerosol Can Packaging Volume Share (%), by Types 2025 & 2033
- Figure 11: North America Aluminum Aerosol Can Packaging Revenue (undefined), by Country 2025 & 2033
- Figure 12: North America Aluminum Aerosol Can Packaging Volume (K), by Country 2025 & 2033
- Figure 13: North America Aluminum Aerosol Can Packaging Revenue Share (%), by Country 2025 & 2033
- Figure 14: North America Aluminum Aerosol Can Packaging Volume Share (%), by Country 2025 & 2033
- Figure 15: South America Aluminum Aerosol Can Packaging Revenue (undefined), by Application 2025 & 2033
- Figure 16: South America Aluminum Aerosol Can Packaging Volume (K), by Application 2025 & 2033
- Figure 17: South America Aluminum Aerosol Can Packaging Revenue Share (%), by Application 2025 & 2033
- Figure 18: South America Aluminum Aerosol Can Packaging Volume Share (%), by Application 2025 & 2033
- Figure 19: South America Aluminum Aerosol Can Packaging Revenue (undefined), by Types 2025 & 2033
- Figure 20: South America Aluminum Aerosol Can Packaging Volume (K), by Types 2025 & 2033
- Figure 21: South America Aluminum Aerosol Can Packaging Revenue Share (%), by Types 2025 & 2033
- Figure 22: South America Aluminum Aerosol Can Packaging Volume Share (%), by Types 2025 & 2033
- Figure 23: South America Aluminum Aerosol Can Packaging Revenue (undefined), by Country 2025 & 2033
- Figure 24: South America Aluminum Aerosol Can Packaging Volume (K), by Country 2025 & 2033
- Figure 25: South America Aluminum Aerosol Can Packaging Revenue Share (%), by Country 2025 & 2033
- Figure 26: South America Aluminum Aerosol Can Packaging Volume Share (%), by Country 2025 & 2033
- Figure 27: Europe Aluminum Aerosol Can Packaging Revenue (undefined), by Application 2025 & 2033
- Figure 28: Europe Aluminum Aerosol Can Packaging Volume (K), by Application 2025 & 2033
- Figure 29: Europe Aluminum Aerosol Can Packaging Revenue Share (%), by Application 2025 & 2033
- Figure 30: Europe Aluminum Aerosol Can Packaging Volume Share (%), by Application 2025 & 2033
- Figure 31: Europe Aluminum Aerosol Can Packaging Revenue (undefined), by Types 2025 & 2033
- Figure 32: Europe Aluminum Aerosol Can Packaging Volume (K), by Types 2025 & 2033
- Figure 33: Europe Aluminum Aerosol Can Packaging Revenue Share (%), by Types 2025 & 2033
- Figure 34: Europe Aluminum Aerosol Can Packaging Volume Share (%), by Types 2025 & 2033
- Figure 35: Europe Aluminum Aerosol Can Packaging Revenue (undefined), by Country 2025 & 2033
- Figure 36: Europe Aluminum Aerosol Can Packaging Volume (K), by Country 2025 & 2033
- Figure 37: Europe Aluminum Aerosol Can Packaging Revenue Share (%), by Country 2025 & 2033
- Figure 38: Europe Aluminum Aerosol Can Packaging Volume Share (%), by Country 2025 & 2033
- Figure 39: Middle East & Africa Aluminum Aerosol Can Packaging Revenue (undefined), by Application 2025 & 2033
- Figure 40: Middle East & Africa Aluminum Aerosol Can Packaging Volume (K), by Application 2025 & 2033
- Figure 41: Middle East & Africa Aluminum Aerosol Can Packaging Revenue Share (%), by Application 2025 & 2033
- Figure 42: Middle East & Africa Aluminum Aerosol Can Packaging Volume Share (%), by Application 2025 & 2033
- Figure 43: Middle East & Africa Aluminum Aerosol Can Packaging Revenue (undefined), by Types 2025 & 2033
- Figure 44: Middle East & Africa Aluminum Aerosol Can Packaging Volume (K), by Types 2025 & 2033
- Figure 45: Middle East & Africa Aluminum Aerosol Can Packaging Revenue Share (%), by Types 2025 & 2033
- Figure 46: Middle East & Africa Aluminum Aerosol Can Packaging Volume Share (%), by Types 2025 & 2033
- Figure 47: Middle East & Africa Aluminum Aerosol Can Packaging Revenue (undefined), by Country 2025 & 2033
- Figure 48: Middle East & Africa Aluminum Aerosol Can Packaging Volume (K), by Country 2025 & 2033
- Figure 49: Middle East & Africa Aluminum Aerosol Can Packaging Revenue Share (%), by Country 2025 & 2033
- Figure 50: Middle East & Africa Aluminum Aerosol Can Packaging Volume Share (%), by Country 2025 & 2033
- Figure 51: Asia Pacific Aluminum Aerosol Can Packaging Revenue (undefined), by Application 2025 & 2033
- Figure 52: Asia Pacific Aluminum Aerosol Can Packaging Volume (K), by Application 2025 & 2033
- Figure 53: Asia Pacific Aluminum Aerosol Can Packaging Revenue Share (%), by Application 2025 & 2033
- Figure 54: Asia Pacific Aluminum Aerosol Can Packaging Volume Share (%), by Application 2025 & 2033
- Figure 55: Asia Pacific Aluminum Aerosol Can Packaging Revenue (undefined), by Types 2025 & 2033
- Figure 56: Asia Pacific Aluminum Aerosol Can Packaging Volume (K), by Types 2025 & 2033
- Figure 57: Asia Pacific Aluminum Aerosol Can Packaging Revenue Share (%), by Types 2025 & 2033
- Figure 58: Asia Pacific Aluminum Aerosol Can Packaging Volume Share (%), by Types 2025 & 2033
- Figure 59: Asia Pacific Aluminum Aerosol Can Packaging Revenue (undefined), by Country 2025 & 2033
- Figure 60: Asia Pacific Aluminum Aerosol Can Packaging Volume (K), by Country 2025 & 2033
- Figure 61: Asia Pacific Aluminum Aerosol Can Packaging Revenue Share (%), by Country 2025 & 2033
- Figure 62: Asia Pacific Aluminum Aerosol Can Packaging Volume Share (%), by Country 2025 & 2033
List of Tables
- Table 1: Global Aluminum Aerosol Can Packaging Revenue undefined Forecast, by Application 2020 & 2033
- Table 2: Global Aluminum Aerosol Can Packaging Volume K Forecast, by Application 2020 & 2033
- Table 3: Global Aluminum Aerosol Can Packaging Revenue undefined Forecast, by Types 2020 & 2033
- Table 4: Global Aluminum Aerosol Can Packaging Volume K Forecast, by Types 2020 & 2033
- Table 5: Global Aluminum Aerosol Can Packaging Revenue undefined Forecast, by Region 2020 & 2033
- Table 6: Global Aluminum Aerosol Can Packaging Volume K Forecast, by Region 2020 & 2033
- Table 7: Global Aluminum Aerosol Can Packaging Revenue undefined Forecast, by Application 2020 & 2033
- Table 8: Global Aluminum Aerosol Can Packaging Volume K Forecast, by Application 2020 & 2033
- Table 9: Global Aluminum Aerosol Can Packaging Revenue undefined Forecast, by Types 2020 & 2033
- Table 10: Global Aluminum Aerosol Can Packaging Volume K Forecast, by Types 2020 & 2033
- Table 11: Global Aluminum Aerosol Can Packaging Revenue undefined Forecast, by Country 2020 & 2033
- Table 12: Global Aluminum Aerosol Can Packaging Volume K Forecast, by Country 2020 & 2033
- Table 13: United States Aluminum Aerosol Can Packaging Revenue (undefined) Forecast, by Application 2020 & 2033
- Table 14: United States Aluminum Aerosol Can Packaging Volume (K) Forecast, by Application 2020 & 2033
- Table 15: Canada Aluminum Aerosol Can Packaging Revenue (undefined) Forecast, by Application 2020 & 2033
- Table 16: Canada Aluminum Aerosol Can Packaging Volume (K) Forecast, by Application 2020 & 2033
- Table 17: Mexico Aluminum Aerosol Can Packaging Revenue (undefined) Forecast, by Application 2020 & 2033
- Table 18: Mexico Aluminum Aerosol Can Packaging Volume (K) Forecast, by Application 2020 & 2033
- Table 19: Global Aluminum Aerosol Can Packaging Revenue undefined Forecast, by Application 2020 & 2033
- Table 20: Global Aluminum Aerosol Can Packaging Volume K Forecast, by Application 2020 & 2033
- Table 21: Global Aluminum Aerosol Can Packaging Revenue undefined Forecast, by Types 2020 & 2033
- Table 22: Global Aluminum Aerosol Can Packaging Volume K Forecast, by Types 2020 & 2033
- Table 23: Global Aluminum Aerosol Can Packaging Revenue undefined Forecast, by Country 2020 & 2033
- Table 24: Global Aluminum Aerosol Can Packaging Volume K Forecast, by Country 2020 & 2033
- Table 25: Brazil Aluminum Aerosol Can Packaging Revenue (undefined) Forecast, by Application 2020 & 2033
- Table 26: Brazil Aluminum Aerosol Can Packaging Volume (K) Forecast, by Application 2020 & 2033
- Table 27: Argentina Aluminum Aerosol Can Packaging Revenue (undefined) Forecast, by Application 2020 & 2033
- Table 28: Argentina Aluminum Aerosol Can Packaging Volume (K) Forecast, by Application 2020 & 2033
- Table 29: Rest of South America Aluminum Aerosol Can Packaging Revenue (undefined) Forecast, by Application 2020 & 2033
- Table 30: Rest of South America Aluminum Aerosol Can Packaging Volume (K) Forecast, by Application 2020 & 2033
- Table 31: Global Aluminum Aerosol Can Packaging Revenue undefined Forecast, by Application 2020 & 2033
- Table 32: Global Aluminum Aerosol Can Packaging Volume K Forecast, by Application 2020 & 2033
- Table 33: Global Aluminum Aerosol Can Packaging Revenue undefined Forecast, by Types 2020 & 2033
- Table 34: Global Aluminum Aerosol Can Packaging Volume K Forecast, by Types 2020 & 2033
- Table 35: Global Aluminum Aerosol Can Packaging Revenue undefined Forecast, by Country 2020 & 2033
- Table 36: Global Aluminum Aerosol Can Packaging Volume K Forecast, by Country 2020 & 2033
- Table 37: United Kingdom Aluminum Aerosol Can Packaging Revenue (undefined) Forecast, by Application 2020 & 2033
- Table 38: United Kingdom Aluminum Aerosol Can Packaging Volume (K) Forecast, by Application 2020 & 2033
- Table 39: Germany Aluminum Aerosol Can Packaging Revenue (undefined) Forecast, by Application 2020 & 2033
- Table 40: Germany Aluminum Aerosol Can Packaging Volume (K) Forecast, by Application 2020 & 2033
- Table 41: France Aluminum Aerosol Can Packaging Revenue (undefined) Forecast, by Application 2020 & 2033
- Table 42: France Aluminum Aerosol Can Packaging Volume (K) Forecast, by Application 2020 & 2033
- Table 43: Italy Aluminum Aerosol Can Packaging Revenue (undefined) Forecast, by Application 2020 & 2033
- Table 44: Italy Aluminum Aerosol Can Packaging Volume (K) Forecast, by Application 2020 & 2033
- Table 45: Spain Aluminum Aerosol Can Packaging Revenue (undefined) Forecast, by Application 2020 & 2033
- Table 46: Spain Aluminum Aerosol Can Packaging Volume (K) Forecast, by Application 2020 & 2033
- Table 47: Russia Aluminum Aerosol Can Packaging Revenue (undefined) Forecast, by Application 2020 & 2033
- Table 48: Russia Aluminum Aerosol Can Packaging Volume (K) Forecast, by Application 2020 & 2033
- Table 49: Benelux Aluminum Aerosol Can Packaging Revenue (undefined) Forecast, by Application 2020 & 2033
- Table 50: Benelux Aluminum Aerosol Can Packaging Volume (K) Forecast, by Application 2020 & 2033
- Table 51: Nordics Aluminum Aerosol Can Packaging Revenue (undefined) Forecast, by Application 2020 & 2033
- Table 52: Nordics Aluminum Aerosol Can Packaging Volume (K) Forecast, by Application 2020 & 2033
- Table 53: Rest of Europe Aluminum Aerosol Can Packaging Revenue (undefined) Forecast, by Application 2020 & 2033
- Table 54: Rest of Europe Aluminum Aerosol Can Packaging Volume (K) Forecast, by Application 2020 & 2033
- Table 55: Global Aluminum Aerosol Can Packaging Revenue undefined Forecast, by Application 2020 & 2033
- Table 56: Global Aluminum Aerosol Can Packaging Volume K Forecast, by Application 2020 & 2033
- Table 57: Global Aluminum Aerosol Can Packaging Revenue undefined Forecast, by Types 2020 & 2033
- Table 58: Global Aluminum Aerosol Can Packaging Volume K Forecast, by Types 2020 & 2033
- Table 59: Global Aluminum Aerosol Can Packaging Revenue undefined Forecast, by Country 2020 & 2033
- Table 60: Global Aluminum Aerosol Can Packaging Volume K Forecast, by Country 2020 & 2033
- Table 61: Turkey Aluminum Aerosol Can Packaging Revenue (undefined) Forecast, by Application 2020 & 2033
- Table 62: Turkey Aluminum Aerosol Can Packaging Volume (K) Forecast, by Application 2020 & 2033
- Table 63: Israel Aluminum Aerosol Can Packaging Revenue (undefined) Forecast, by Application 2020 & 2033
- Table 64: Israel Aluminum Aerosol Can Packaging Volume (K) Forecast, by Application 2020 & 2033
- Table 65: GCC Aluminum Aerosol Can Packaging Revenue (undefined) Forecast, by Application 2020 & 2033
- Table 66: GCC Aluminum Aerosol Can Packaging Volume (K) Forecast, by Application 2020 & 2033
- Table 67: North Africa Aluminum Aerosol Can Packaging Revenue (undefined) Forecast, by Application 2020 & 2033
- Table 68: North Africa Aluminum Aerosol Can Packaging Volume (K) Forecast, by Application 2020 & 2033
- Table 69: South Africa Aluminum Aerosol Can Packaging Revenue (undefined) Forecast, by Application 2020 & 2033
- Table 70: South Africa Aluminum Aerosol Can Packaging Volume (K) Forecast, by Application 2020 & 2033
- Table 71: Rest of Middle East & Africa Aluminum Aerosol Can Packaging Revenue (undefined) Forecast, by Application 2020 & 2033
- Table 72: Rest of Middle East & Africa Aluminum Aerosol Can Packaging Volume (K) Forecast, by Application 2020 & 2033
- Table 73: Global Aluminum Aerosol Can Packaging Revenue undefined Forecast, by Application 2020 & 2033
- Table 74: Global Aluminum Aerosol Can Packaging Volume K Forecast, by Application 2020 & 2033
- Table 75: Global Aluminum Aerosol Can Packaging Revenue undefined Forecast, by Types 2020 & 2033
- Table 76: Global Aluminum Aerosol Can Packaging Volume K Forecast, by Types 2020 & 2033
- Table 77: Global Aluminum Aerosol Can Packaging Revenue undefined Forecast, by Country 2020 & 2033
- Table 78: Global Aluminum Aerosol Can Packaging Volume K Forecast, by Country 2020 & 2033
- Table 79: China Aluminum Aerosol Can Packaging Revenue (undefined) Forecast, by Application 2020 & 2033
- Table 80: China Aluminum Aerosol Can Packaging Volume (K) Forecast, by Application 2020 & 2033
- Table 81: India Aluminum Aerosol Can Packaging Revenue (undefined) Forecast, by Application 2020 & 2033
- Table 82: India Aluminum Aerosol Can Packaging Volume (K) Forecast, by Application 2020 & 2033
- Table 83: Japan Aluminum Aerosol Can Packaging Revenue (undefined) Forecast, by Application 2020 & 2033
- Table 84: Japan Aluminum Aerosol Can Packaging Volume (K) Forecast, by Application 2020 & 2033
- Table 85: South Korea Aluminum Aerosol Can Packaging Revenue (undefined) Forecast, by Application 2020 & 2033
- Table 86: South Korea Aluminum Aerosol Can Packaging Volume (K) Forecast, by Application 2020 & 2033
- Table 87: ASEAN Aluminum Aerosol Can Packaging Revenue (undefined) Forecast, by Application 2020 & 2033
- Table 88: ASEAN Aluminum Aerosol Can Packaging Volume (K) Forecast, by Application 2020 & 2033
- Table 89: Oceania Aluminum Aerosol Can Packaging Revenue (undefined) Forecast, by Application 2020 & 2033
- Table 90: Oceania Aluminum Aerosol Can Packaging Volume (K) Forecast, by Application 2020 & 2033
- Table 91: Rest of Asia Pacific Aluminum Aerosol Can Packaging Revenue (undefined) Forecast, by Application 2020 & 2033
- Table 92: Rest of Asia Pacific Aluminum Aerosol Can Packaging Volume (K) Forecast, by Application 2020 & 2033
Frequently Asked Questions
1. What is the projected Compound Annual Growth Rate (CAGR) of the Aluminum Aerosol Can Packaging?
The projected CAGR is approximately 4.62%.
2. Which companies are prominent players in the Aluminum Aerosol Can Packaging?
Key companies in the market include Ball Corporation, Trivium Packaging, CCL Containers, TUBEX GmbH, Moravia Cans, LINHARDT, ALLTUB, ALUCON, Jamestrong, Aryum, Bispharma, Gulf Cans Industries, Euro Asia Packaging, Bharat Containers, Montebello Packaging, Condensa.
3. What are the main segments of the Aluminum Aerosol Can Packaging?
The market segments include Application, Types.
4. Can you provide details about the market size?
The market size is estimated to be USD XXX N/A as of 2022.
5. What are some drivers contributing to market growth?
N/A
6. What are the notable trends driving market growth?
N/A
7. Are there any restraints impacting market growth?
N/A
8. Can you provide examples of recent developments in the market?
N/A
9. What pricing options are available for accessing the report?
Pricing options include single-user, multi-user, and enterprise licenses priced at USD 3350.00, USD 5025.00, and USD 6700.00 respectively.
10. Is the market size provided in terms of value or volume?
The market size is provided in terms of value, measured in N/A and volume, measured in K.
11. Are there any specific market keywords associated with the report?
Yes, the market keyword associated with the report is "Aluminum Aerosol Can Packaging," which aids in identifying and referencing the specific market segment covered.
12. How do I determine which pricing option suits my needs best?
The pricing options vary based on user requirements and access needs. Individual users may opt for single-user licenses, while businesses requiring broader access may choose multi-user or enterprise licenses for cost-effective access to the report.
13. Are there any additional resources or data provided in the Aluminum Aerosol Can Packaging report?
While the report offers comprehensive insights, it's advisable to review the specific contents or supplementary materials provided to ascertain if additional resources or data are available.
14. How can I stay updated on further developments or reports in the Aluminum Aerosol Can Packaging?
To stay informed about further developments, trends, and reports in the Aluminum Aerosol Can Packaging, consider subscribing to industry newsletters, following relevant companies and organizations, or regularly checking reputable industry news sources and publications.
Methodology
Step 1 - Identification of Relevant Samples Size from Population Database


Step 2 - Approaches for Defining Global Market Size (Value, Volume* & Price*)

Note*: In applicable scenarios
Step 3 - Data Sources
Primary Research
- Web Analytics
- Survey Reports
- Research Institute
- Latest Research Reports
- Opinion Leaders
Secondary Research
- Annual Reports
- White Paper
- Latest Press Release
- Industry Association
- Paid Database
- Investor Presentations

Step 4 - Data Triangulation
Involves using different sources of information in order to increase the validity of a study
These sources are likely to be stakeholders in a program - participants, other researchers, program staff, other community members, and so on.
Then we put all data in single framework & apply various statistical tools to find out the dynamic on the market.
During the analysis stage, feedback from the stakeholder groups would be compared to determine areas of agreement as well as areas of divergence