

Key Insights
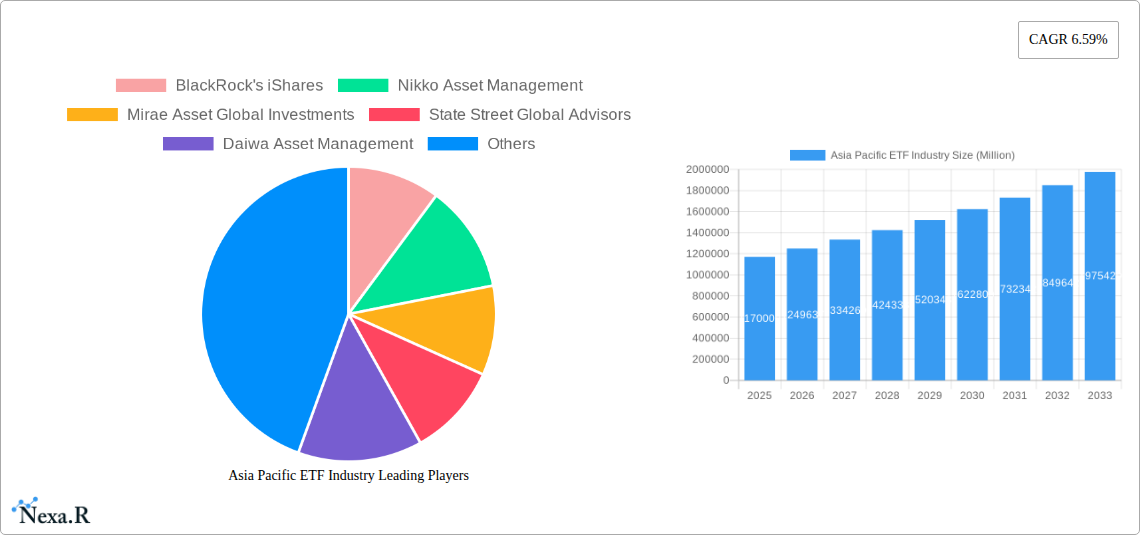
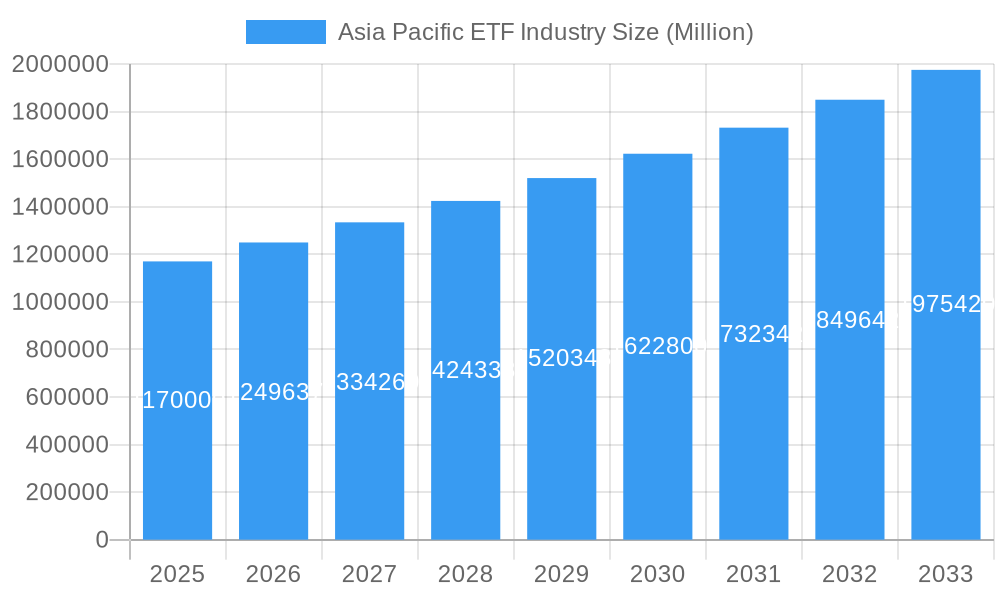
The Asia-Pacific exchange-traded fund (ETF) industry is experiencing robust growth, projected to reach a market size of $1.17 trillion by 2025, expanding at a compound annual growth rate (CAGR) of 6.59%. This expansion is fueled by several key drivers. Increased investor awareness of ETFs as a diversified and accessible investment vehicle is a significant factor. Furthermore, the rising adoption of digital platforms and online brokerage services has simplified ETF trading, broadening participation among retail investors. The region's burgeoning middle class, with its growing disposable income and interest in long-term investment strategies, further propels this market's trajectory. Regulatory initiatives promoting financial inclusion and market transparency also contribute to this positive growth trend. While challenges such as market volatility and geopolitical uncertainties exist, the long-term outlook remains positive. The dominance of established players like BlackRock's iShares, Nikko Asset Management, and others indicates a degree of market consolidation, though newer entrants and innovative product offerings continue to emerge, fostering competition and driving innovation.
Asia Pacific ETF Industry Market Size (In Million)
Looking ahead to 2033, the continued growth of the Asia-Pacific ETF market is expected, albeit at a potentially moderating CAGR. Factors such as economic development across various Asian economies, the increasing sophistication of local investors, and the ongoing expansion of product offerings (including thematic and ESG ETFs) will sustain growth, albeit possibly at a slightly lower pace than the current CAGR. However, geopolitical risks and potential regulatory changes could influence the trajectory, necessitating ongoing market monitoring. The competitive landscape will remain dynamic, with established players constantly innovating and new firms entering the market, thereby ensuring a continuously evolving industry landscape. The segmentation within the market (although not explicitly provided) is likely to evolve with increased offerings in specific sectors and asset classes catering to the diversifying needs of the investor base.
Asia Pacific ETF Industry Company Market Share
Asia Pacific ETF Industry: A Comprehensive Market Report (2019-2033)
This comprehensive report provides an in-depth analysis of the Asia Pacific Exchange-Traded Funds (ETF) industry, covering market dynamics, growth trends, key players, and future outlook. The study period spans from 2019 to 2033, with 2025 serving as the base and estimated year. The report uses a robust methodology, leveraging extensive data and industry expertise to deliver actionable insights for investors, industry professionals, and strategic decision-makers. The report encompasses a detailed examination of parent and child markets within the broader Asia Pacific ETF landscape. Market values are presented in millions (USD).
Asia Pacific ETF Industry Market Dynamics & Structure
The Asia Pacific ETF market is characterized by increasing concentration among major players, driven by technological advancements and evolving regulatory landscapes. The market size in 2024 is estimated at 5500 Million, experiencing a CAGR of xx% during the historical period (2019-2024). Market consolidation through mergers and acquisitions (M&A) is also prevalent, with xx M&A deals recorded in 2024.
- Market Concentration: BlackRock's iShares, Nikko Asset Management, and Mirae Asset Global Investments hold a significant combined market share of approximately xx%, showcasing the oligopolistic nature of the market.
- Technological Innovation: The adoption of robo-advisors and algorithmic trading is boosting efficiency and accessibility, but high initial investment costs present a barrier for smaller players.
- Regulatory Frameworks: Varying regulatory environments across different Asia-Pacific countries impact market entry and operational costs, creating both opportunities and challenges. Recent regulatory changes in Singapore and Hong Kong have spurred growth in certain segments.
- Competitive Product Substitutes: Mutual funds and other investment vehicles remain competitive substitutes, though ETFs are gaining traction due to their transparency and cost-effectiveness.
- End-User Demographics: The increasing participation of retail investors alongside institutional investors is widening the investor base. This growing retail segment is particularly noticeable in countries like India and China.
- M&A Trends: Consolidation is a key trend, as larger players acquire smaller firms to expand their product offerings and market reach. This activity is expected to accelerate in the coming years.
Asia Pacific ETF Industry Growth Trends & Insights
The Asia Pacific ETF market is poised for robust growth, driven by increasing investor awareness, favorable regulatory changes, and technological advancements. The projected market size for 2033 is estimated at xx Million, reflecting a CAGR of xx% during the forecast period (2025-2033). Increased ETF adoption rates, particularly among retail investors in rapidly growing economies, contribute significantly to this growth. Furthermore, the introduction of innovative products catering to specific investor needs and preferences is fueling market expansion. Technological disruptions, such as the rise of fintech platforms and mobile trading apps, are significantly improving accessibility and lowering the barrier to entry for new investors. A shift in consumer behavior towards passive investment strategies is also driving demand for ETFs.
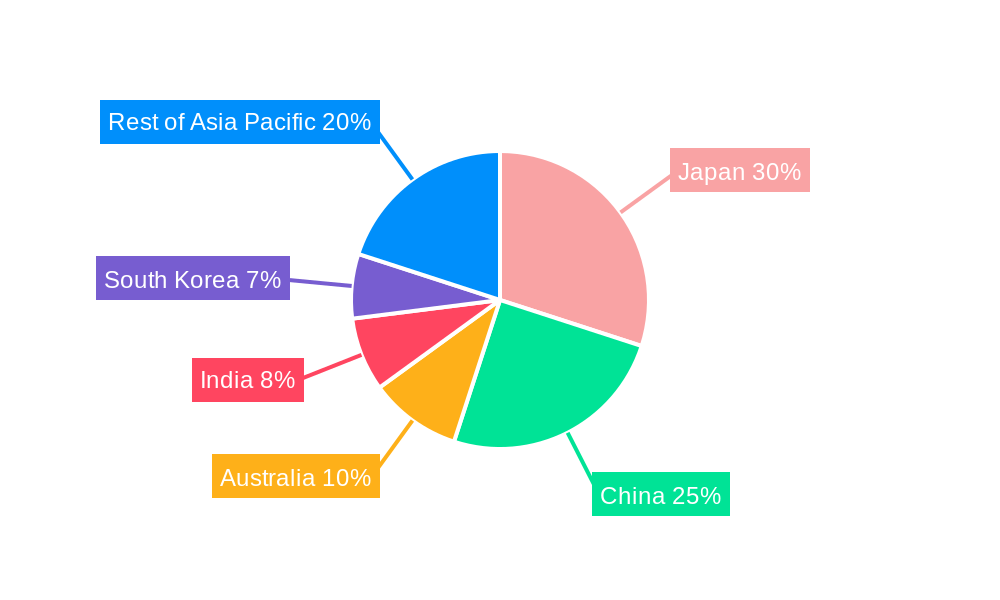
Dominant Regions, Countries, or Segments in Asia Pacific ETF Industry
Japan, Australia, and Hong Kong currently dominate the Asia Pacific ETF market, accounting for approximately xx% of the total market share in 2024. This dominance is attributed to several factors, including well-established financial markets, favorable regulatory environments, and the relatively high financial literacy rates of investors within these nations.
- Japan: Benefits from a sophisticated investor base, robust infrastructure, and a high volume of listed companies, making it a leading hub for ETF activity.
- Australia: A mature market with a robust regulatory framework, encouraging both domestic and international ETF listings.
- Hong Kong: Serves as a gateway to mainland China, benefiting from increased cross-border investment flows and the growing popularity of ETFs amongst Chinese investors.
Other countries, such as South Korea, Singapore, and India, are experiencing rapid growth due to factors like:
- Increasing domestic savings and investment: Fueling demand for diversified investment options.
- Government initiatives promoting financial inclusion and market development: Creating favorable conditions for ETF growth.
- Rising middle class with growing disposable incomes: Further augmenting demand for investment products.
Asia Pacific ETF Industry Product Landscape
The Asia Pacific ETF market offers a diverse range of products, including equity, fixed income, and commodity ETFs. Recent product innovations include thematic ETFs focusing on specific sectors like technology or sustainable investing, as well as actively managed ETFs that offer a blend of passive and active investment strategies. These products leverage technological advancements like AI-driven portfolio optimization to enhance performance and cater to diverse investor needs. Unique selling propositions include low expense ratios, tax efficiency, and easy access to diversified investments.
Key Drivers, Barriers & Challenges in Asia Pacific ETF Industry
Key Drivers:
- Technological advancements, simplifying investment and reducing costs.
- Increased regulatory clarity and investor education.
- Growing demand for diversification and passive investment strategies.
Key Challenges & Restraints:
- Regulatory inconsistencies across different markets, hindering cross-border investment.
- Competition from traditional investment products like mutual funds.
- Limited product diversification in certain regional markets, particularly in smaller economies.
- Volatility in emerging markets can impact investor confidence and overall growth.
Emerging Opportunities in Asia Pacific ETF Industry
- Untapped potential in smaller economies across Southeast Asia and South Asia.
- Growing demand for sustainable and ESG-focused ETFs.
- Innovation in product offerings, including leveraged and inverse ETFs, to cater to sophisticated investors.
- Partnerships between ETF providers and fintech firms to enhance distribution and accessibility.
Growth Accelerators in the Asia Pacific ETF Industry
Long-term growth will be driven by further technological advancements like blockchain integration for enhanced transparency, strategic collaborations between ETF providers and financial institutions, and the expansion into untapped markets with increasing financial inclusion. The development of more sophisticated products targeting specific investor profiles and risk tolerances will also accelerate market growth.
Key Players Shaping the Asia Pacific ETF Industry Market
- BlackRock's iShares
- Nikko Asset Management
- Mirae Asset Global Investments
- State Street Global Advisors
- Daiwa Asset Management
- Mitsubishi UFJ Financial Group
- Samsung Asset Management
- Fortune SG Fund Management
- China Asset Management
- Nomura Asset Management Co Ltd
- List Not Exhaustive
Notable Milestones in Asia Pacific ETF Industry Sector
- December 2022: Nikko Asset Management Co. Ltd launched a new ETF-listed index fund, US Equity (Dow Average), on the Tokyo Stock Exchange, featuring no currency hedge.
- May 2023: Nomura Investor Relations Co. Ltd and Nomura Securities Co. Ltd partnered with QUICK Corp. to operate a sponsored research company, potentially impacting market data accessibility and analysis.
In-Depth Asia Pacific ETF Industry Market Outlook
The Asia Pacific ETF market is projected to experience sustained growth over the next decade, driven by increased investor participation, technological innovation, and favorable regulatory developments. The expansion into new markets and the introduction of innovative products, coupled with strategic alliances among key players, will further accelerate market expansion. Opportunities for growth are particularly strong in rapidly developing economies with growing middle classes and rising financial literacy. The increasing focus on sustainable and responsible investing presents significant opportunities for ETFs specializing in ESG-focused investments.
Asia Pacific ETF Industry Segmentation
-
1. Types of ETFs
- 1.1. Fixed Income ETFs
- 1.2. Equity ETFs
- 1.3. Commodity ETFs
- 1.4. Currency ETFs
- 1.5. Real Estate ETFs
- 1.6. Specialty ETFs
Asia Pacific ETF Industry Segmentation By Geography
-
1. Asia Pacific
- 1.1. China
- 1.2. Japan
- 1.3. South Korea
- 1.4. India
- 1.5. Australia
- 1.6. New Zealand
- 1.7. Indonesia
- 1.8. Malaysia
- 1.9. Singapore
- 1.10. Thailand
- 1.11. Vietnam
- 1.12. Philippines
Asia Pacific ETF Industry Regional Market Share
Geographic Coverage of Asia Pacific ETF Industry
Asia Pacific ETF Industry REPORT HIGHLIGHTS
| Aspects | Details |
|---|---|
| Study Period | 2020-2034 |
| Base Year | 2025 |
| Estimated Year | 2026 |
| Forecast Period | 2026-2034 |
| Historical Period | 2020-2025 |
| Growth Rate | CAGR of 6.59% from 2020-2034 |
| Segmentation |
|
Table of Contents
- 1. Introduction
- 1.1. Research Scope
- 1.2. Market Segmentation
- 1.3. Research Objective
- 1.4. Definitions and Assumptions
- 2. Executive Summary
- 2.1. Market Snapshot
- 3. Market Dynamics
- 3.1. Market Drivers
- 3.2. Market Restrains
- 3.3. Market Trends
- 3.4. Market Opportunities
- 4. Market Factor Analysis
- 4.1. Porters Five Forces
- 4.1.1. Bargaining Power of Suppliers
- 4.1.2. Bargaining Power of Buyers
- 4.1.3. Threat of New Entrants
- 4.1.4. Threat of Substitutes
- 4.1.5. Competitive Rivalry
- 4.2. PESTEL analysis
- 4.3. BCG Analysis
- 4.3.1. Stars (High Growth, High Market Share)
- 4.3.2. Cash Cows (Low Growth, High Market Share)
- 4.3.3. Question Mark (High Growth, Low Market Share)
- 4.3.4. Dogs (Low Growth, Low Market Share)
- 4.4. Ansoff Matrix Analysis
- 4.5. Supply Chain Analysis
- 4.6. Regulatory Landscape
- 4.7. Current Market Potential and Opportunity Assessment (TAM–SAM–SOM Framework)
- 4.8. NRP Analyst Note
- 4.1. Porters Five Forces
- 5. Market Analysis, Insights and Forecast 2021-2033
- 5.1. Market Analysis, Insights and Forecast - by Types of ETFs
- 5.1.1. Fixed Income ETFs
- 5.1.2. Equity ETFs
- 5.1.3. Commodity ETFs
- 5.1.4. Currency ETFs
- 5.1.5. Real Estate ETFs
- 5.1.6. Specialty ETFs
- 5.2. Market Analysis, Insights and Forecast - by Region
- 5.2.1. Asia Pacific
- 5.1. Market Analysis, Insights and Forecast - by Types of ETFs
- 6. Asia Pacific ETF Industry Analysis, Insights and Forecast, 2021-2033
- 6.1. Market Analysis, Insights and Forecast - by Types of ETFs
- 6.1.1. Fixed Income ETFs
- 6.1.2. Equity ETFs
- 6.1.3. Commodity ETFs
- 6.1.4. Currency ETFs
- 6.1.5. Real Estate ETFs
- 6.1.6. Specialty ETFs
- 6.1. Market Analysis, Insights and Forecast - by Types of ETFs
- 7. Competitive Analysis
- 7.1. Company Profiles
- 7.1.1 BlackRock's iShares
- 7.1.1.1. Company Overview
- 7.1.1.2. Products
- 7.1.1.3. Company Financials
- 7.1.1.4. SWOT Analysis
- 7.1.2 Nikko Asset Management
- 7.1.2.1. Company Overview
- 7.1.2.2. Products
- 7.1.2.3. Company Financials
- 7.1.2.4. SWOT Analysis
- 7.1.3 Mirae Asset Global Investments
- 7.1.3.1. Company Overview
- 7.1.3.2. Products
- 7.1.3.3. Company Financials
- 7.1.3.4. SWOT Analysis
- 7.1.4 State Street Global Advisors
- 7.1.4.1. Company Overview
- 7.1.4.2. Products
- 7.1.4.3. Company Financials
- 7.1.4.4. SWOT Analysis
- 7.1.5 Daiwa Asset Management
- 7.1.5.1. Company Overview
- 7.1.5.2. Products
- 7.1.5.3. Company Financials
- 7.1.5.4. SWOT Analysis
- 7.1.6 Mitsubishi UFJ Financial Group
- 7.1.6.1. Company Overview
- 7.1.6.2. Products
- 7.1.6.3. Company Financials
- 7.1.6.4. SWOT Analysis
- 7.1.7 Samsung Asset Management
- 7.1.7.1. Company Overview
- 7.1.7.2. Products
- 7.1.7.3. Company Financials
- 7.1.7.4. SWOT Analysis
- 7.1.8 Fortune SG Fund Management
- 7.1.8.1. Company Overview
- 7.1.8.2. Products
- 7.1.8.3. Company Financials
- 7.1.8.4. SWOT Analysis
- 7.1.9 China Asset Management
- 7.1.9.1. Company Overview
- 7.1.9.2. Products
- 7.1.9.3. Company Financials
- 7.1.9.4. SWOT Analysis
- 7.1.10 Nomura Asset Management Co Ltd**List Not Exhaustive
- 7.1.10.1. Company Overview
- 7.1.10.2. Products
- 7.1.10.3. Company Financials
- 7.1.10.4. SWOT Analysis
- 7.1.1 BlackRock's iShares
- 7.2. Market Entropy
- 7.2.1 Company's Key Areas Served
- 7.2.2 Recent Developments
- 7.3. Company Market Share Analysis 2025
- 7.3.1 Top 5 Companies Market Share Analysis
- 7.3.2 Top 3 Companies Market Share Analysis
- 7.4. List of Potential Customers
- 8. Research Methodology
List of Figures
- Figure 1: Asia Pacific ETF Industry Revenue Breakdown (Million, %) by Product 2025 & 2033
- Figure 2: Asia Pacific ETF Industry Share (%) by Company 2025
List of Tables
- Table 1: Asia Pacific ETF Industry Revenue Million Forecast, by Types of ETFs 2020 & 2033
- Table 2: Asia Pacific ETF Industry Volume Trillion Forecast, by Types of ETFs 2020 & 2033
- Table 3: Asia Pacific ETF Industry Revenue Million Forecast, by Region 2020 & 2033
- Table 4: Asia Pacific ETF Industry Volume Trillion Forecast, by Region 2020 & 2033
- Table 5: Asia Pacific ETF Industry Revenue Million Forecast, by Types of ETFs 2020 & 2033
- Table 6: Asia Pacific ETF Industry Volume Trillion Forecast, by Types of ETFs 2020 & 2033
- Table 7: Asia Pacific ETF Industry Revenue Million Forecast, by Country 2020 & 2033
- Table 8: Asia Pacific ETF Industry Volume Trillion Forecast, by Country 2020 & 2033
- Table 9: China Asia Pacific ETF Industry Revenue (Million) Forecast, by Application 2020 & 2033
- Table 10: China Asia Pacific ETF Industry Volume (Trillion) Forecast, by Application 2020 & 2033
- Table 11: Japan Asia Pacific ETF Industry Revenue (Million) Forecast, by Application 2020 & 2033
- Table 12: Japan Asia Pacific ETF Industry Volume (Trillion) Forecast, by Application 2020 & 2033
- Table 13: South Korea Asia Pacific ETF Industry Revenue (Million) Forecast, by Application 2020 & 2033
- Table 14: South Korea Asia Pacific ETF Industry Volume (Trillion) Forecast, by Application 2020 & 2033
- Table 15: India Asia Pacific ETF Industry Revenue (Million) Forecast, by Application 2020 & 2033
- Table 16: India Asia Pacific ETF Industry Volume (Trillion) Forecast, by Application 2020 & 2033
- Table 17: Australia Asia Pacific ETF Industry Revenue (Million) Forecast, by Application 2020 & 2033
- Table 18: Australia Asia Pacific ETF Industry Volume (Trillion) Forecast, by Application 2020 & 2033
- Table 19: New Zealand Asia Pacific ETF Industry Revenue (Million) Forecast, by Application 2020 & 2033
- Table 20: New Zealand Asia Pacific ETF Industry Volume (Trillion) Forecast, by Application 2020 & 2033
- Table 21: Indonesia Asia Pacific ETF Industry Revenue (Million) Forecast, by Application 2020 & 2033
- Table 22: Indonesia Asia Pacific ETF Industry Volume (Trillion) Forecast, by Application 2020 & 2033
- Table 23: Malaysia Asia Pacific ETF Industry Revenue (Million) Forecast, by Application 2020 & 2033
- Table 24: Malaysia Asia Pacific ETF Industry Volume (Trillion) Forecast, by Application 2020 & 2033
- Table 25: Singapore Asia Pacific ETF Industry Revenue (Million) Forecast, by Application 2020 & 2033
- Table 26: Singapore Asia Pacific ETF Industry Volume (Trillion) Forecast, by Application 2020 & 2033
- Table 27: Thailand Asia Pacific ETF Industry Revenue (Million) Forecast, by Application 2020 & 2033
- Table 28: Thailand Asia Pacific ETF Industry Volume (Trillion) Forecast, by Application 2020 & 2033
- Table 29: Vietnam Asia Pacific ETF Industry Revenue (Million) Forecast, by Application 2020 & 2033
- Table 30: Vietnam Asia Pacific ETF Industry Volume (Trillion) Forecast, by Application 2020 & 2033
- Table 31: Philippines Asia Pacific ETF Industry Revenue (Million) Forecast, by Application 2020 & 2033
- Table 32: Philippines Asia Pacific ETF Industry Volume (Trillion) Forecast, by Application 2020 & 2033
Frequently Asked Questions
1. What is the projected Compound Annual Growth Rate (CAGR) of the Asia Pacific ETF Industry?
The projected CAGR is approximately 6.59%.
2. Which companies are prominent players in the Asia Pacific ETF Industry?
Key companies in the market include BlackRock's iShares, Nikko Asset Management, Mirae Asset Global Investments, State Street Global Advisors, Daiwa Asset Management, Mitsubishi UFJ Financial Group, Samsung Asset Management, Fortune SG Fund Management, China Asset Management, Nomura Asset Management Co Ltd**List Not Exhaustive.
3. What are the main segments of the Asia Pacific ETF Industry?
The market segments include Types of ETFs.
4. Can you provide details about the market size?
The market size is estimated to be USD 1.17 Million as of 2022.
5. What are some drivers contributing to market growth?
Accessible Investment Platforms; Growing Culture of Financial Investment.
6. What are the notable trends driving market growth?
Equity ETFs Dominate the ETF Market.
7. Are there any restraints impacting market growth?
Accessible Investment Platforms; Growing Culture of Financial Investment.
8. Can you provide examples of recent developments in the market?
May 2023: Nomura Investor Relations Co. Ltd ("Nomura IR") and Nomura Securities Co. Ltd ("Nomura Securities") partnered with QUICK Corp. to run a sponsored research company.
9. What pricing options are available for accessing the report?
Pricing options include single-user, multi-user, and enterprise licenses priced at USD 4750, USD 4950, and USD 6800 respectively.
10. Is the market size provided in terms of value or volume?
The market size is provided in terms of value, measured in Million and volume, measured in Trillion.
11. Are there any specific market keywords associated with the report?
Yes, the market keyword associated with the report is "Asia Pacific ETF Industry," which aids in identifying and referencing the specific market segment covered.
12. How do I determine which pricing option suits my needs best?
The pricing options vary based on user requirements and access needs. Individual users may opt for single-user licenses, while businesses requiring broader access may choose multi-user or enterprise licenses for cost-effective access to the report.
13. Are there any additional resources or data provided in the Asia Pacific ETF Industry report?
While the report offers comprehensive insights, it's advisable to review the specific contents or supplementary materials provided to ascertain if additional resources or data are available.
14. How can I stay updated on further developments or reports in the Asia Pacific ETF Industry?
To stay informed about further developments, trends, and reports in the Asia Pacific ETF Industry, consider subscribing to industry newsletters, following relevant companies and organizations, or regularly checking reputable industry news sources and publications.
Methodology
Step 1 - Identification of Relevant Samples Size from Population Database


Step 2 - Approaches for Defining Global Market Size (Value, Volume* & Price*)

Note*: In applicable scenarios
Step 3 - Data Sources
Primary Research
- Web Analytics
- Survey Reports
- Research Institute
- Latest Research Reports
- Opinion Leaders
Secondary Research
- Annual Reports
- White Paper
- Latest Press Release
- Industry Association
- Paid Database
- Investor Presentations

Step 4 - Data Triangulation
Involves using different sources of information in order to increase the validity of a study
These sources are likely to be stakeholders in a program - participants, other researchers, program staff, other community members, and so on.
Then we put all data in single framework & apply various statistical tools to find out the dynamic on the market.
During the analysis stage, feedback from the stakeholder groups would be compared to determine areas of agreement as well as areas of divergence