

Key Insights
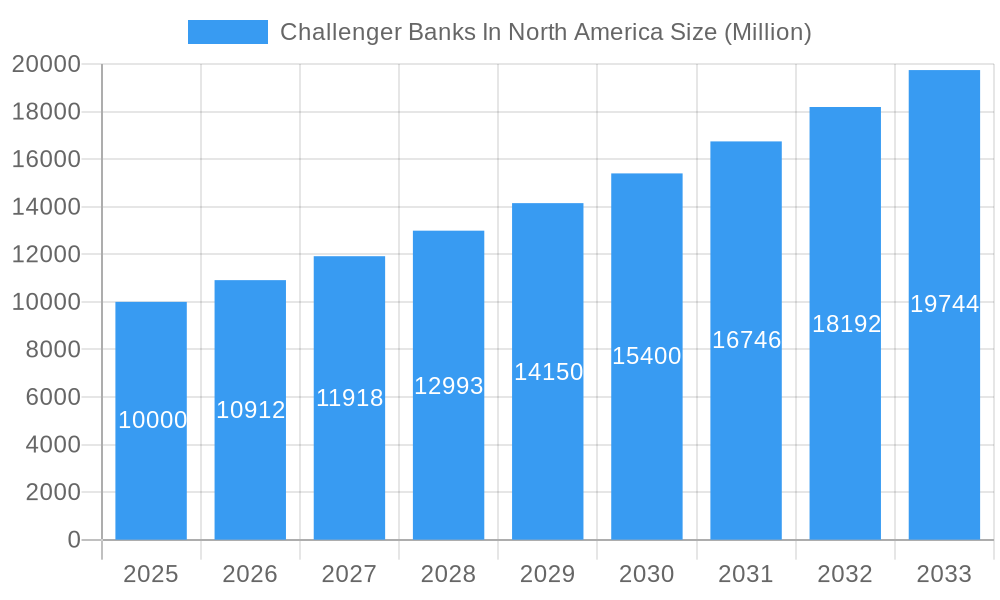
The North American challenger bank market, valued at approximately $10 billion in 2025, is experiencing robust growth, projected to expand at a compound annual growth rate (CAGR) of 9.12% from 2025 to 2033. This surge is driven by several key factors. Firstly, increasing consumer demand for digital-first banking experiences, characterized by user-friendly mobile apps, personalized services, and often lower fees, fuels adoption. Secondly, the innovative product offerings of challenger banks, such as advanced budgeting tools, financial literacy resources, and seamless integration with other financial services, attract a tech-savvy clientele increasingly seeking greater control over their finances. Finally, the market benefits from a wave of financial technology (fintech) innovation, constantly pushing the boundaries of what's possible in personal finance management. This technological advancement leads to more efficient operations and improved customer experiences, further bolstering the sector's growth.
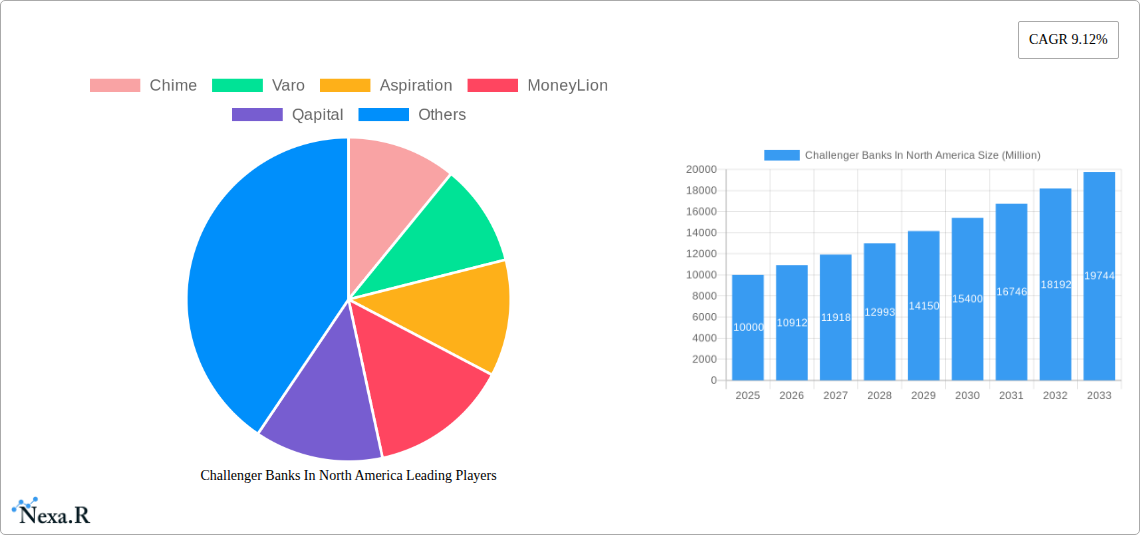
Challenger Banks In North America Market Size (In Billion)
However, the market also faces challenges. Intense competition from established players, who are rapidly adopting digital technologies to counter challenger banks' disruption, poses a significant threat. Regulatory hurdles and compliance costs can also impede growth, particularly for smaller players. Furthermore, security concerns related to digital transactions and data privacy are paramount and must be addressed to maintain consumer trust and confidence in the challenger banking model. Despite these hurdles, the overall market trajectory remains positive, fuelled by sustained technological innovation, shifting consumer preferences, and a growing awareness of the convenience and value proposition offered by challenger banks. The competitive landscape, with notable players including Chime, Varo, Aspiration, MoneyLion, and others, continues to evolve, with strategic partnerships and mergers likely to shape the market further.
Challenger Banks In North America Company Market Share
Challenger Banks in North America: Market Report 2019-2033
This comprehensive report provides an in-depth analysis of the North American challenger bank market, encompassing market dynamics, growth trends, competitive landscape, and future outlook. The study period covers 2019-2033, with 2025 as the base and estimated year. The report is essential for investors, industry professionals, and strategists seeking a clear understanding of this rapidly evolving sector. Parent market: Financial Services; Child market: Digital Banking.
Keywords: Challenger Banks, North America, Neobanks, Fintech, Digital Banking, Mobile Banking, Financial Technology, Market Analysis, Market Size, Growth Trends, Competitive Landscape, Investment Opportunities, Chime, Varo, Aspiration, MoneyLion, Qapital, BankMobile, Upgrade, Dave, Zero, Stash, Deserve, Current.
Challenger Banks In North America Market Dynamics & Structure
This section analyzes the market structure, competitive dynamics, and regulatory landscape of the North American challenger banking industry. We examine market concentration, technological innovation, regulatory frameworks, competitive substitutes (traditional banks, payment apps), end-user demographics (millennials, Gen Z, financially underserved), and M&A activity.
- Market Concentration: The market is characterized by a relatively fragmented landscape, with several key players vying for market share. The top 5 players hold approximately xx% of the market share (2024).
- Technological Innovation: Rapid advancements in mobile technology, AI, and data analytics are driving innovation and shaping the competitive landscape. This includes personalized financial management tools, AI-driven fraud detection, and seamless cross-border payments.
- Regulatory Frameworks: Regulatory changes and compliance requirements significantly impact operational costs and market entry. Variations across states and federal regulations present both opportunities and challenges.
- M&A Activity: The sector has witnessed significant M&A activity in recent years, with larger players acquiring smaller fintech companies to expand their product offerings and market reach. The total deal volume reached approximately USD xx billion between 2019 and 2024.
- Innovation Barriers: High initial investment costs for technology and talent acquisition, stringent regulatory compliance, and securing customer trust pose significant barriers to entry for new players.
The North American challenger bank market is experiencing a period of intense competition, characterized by a blend of established players and new entrants continuously vying for market share. This dynamic environment is further shaped by evolving customer expectations, rapid technological advancement, and a continuously evolving regulatory landscape. The market's future trajectory will depend on the ability of challenger banks to successfully navigate these factors and capitalize on emerging opportunities.
Challenger Banks In North America Growth Trends & Insights
The North American challenger banking landscape is experiencing dynamic and accelerated growth, propelled by a confluence of factors including widespread digital adoption, a palpable shift in consumer expectations, and continuous technological innovation. Projections indicate a robust market expansion, with estimates placing the market size at approximately USD 150 billion in 2025, and a projected Compound Annual Growth Rate (CAGR) of 18% anticipated from 2025 to 2033. Current market penetration, estimated at around 25%, highlights a significant runway for future expansion, especially among the underbanked and underserved segments of the population. This surge is underpinned by increasing smartphone penetration, the inherent convenience offered by mobile-first banking solutions, and a growing sentiment of dissatisfaction with the perceived inflexibility and opaque fee structures of traditional banking institutions. Evolving customer behaviors underscore a clear preference for transparent pricing, highly personalized financial guidance, and seamless, intuitive user experiences. Furthermore, the proliferation of cutting-edge technologies such as embedded finance and the open banking ecosystem are acting as powerful catalysts, unlocking new avenues for revenue generation and fostering strategic collaborations. The ongoing transition towards a predominantly digital financial ecosystem has effectively carved out a vast and promising market segment for challenger banks, presenting them with unparalleled growth opportunities.
Dominant Regions, Countries, or Segments in Challenger Banks In North America
The US dominates the North American challenger bank market, accounting for xx% of the total market value in 2025. This dominance stems from several factors:
- High Smartphone Penetration: The widespread adoption of smartphones provides a fertile ground for mobile-first banking solutions.
- Tech-Savvy Population: A significant portion of the US population is comfortable using digital technologies for financial transactions.
- Favorable Regulatory Environment: While stringent, the regulatory environment is generally considered conducive to fintech innovation.
- Venture Capital Investment: Abundant venture capital funding has fueled the growth of challenger banks in the US.
Canada represents a significant but smaller market, exhibiting steady growth driven by similar factors but at a slower pace due to lower smartphone penetration and a more cautious regulatory environment. The growth potential is substantial as digital banking adoption continues to increase.
Challenger Banks In North America Product Landscape
Challenger banks are distinguished by their comprehensive and innovative suite of offerings, typically centered around mobile-first checking and savings accounts, alongside feature-rich debit cards, accessible personal loans, and burgeoning investment services. These products frequently incorporate advanced functionalities powered by Artificial Intelligence, such as sophisticated budgeting tools, early access to earned wages, and highly personalized financial advisory services. A core competitive advantage for challenger banks lies in their exceptionally user-friendly interfaces, commitment to transparent fee structures, and an unwavering customer-centric philosophy that often prioritizes the user experience above all else, starkly contrasting with the more product-centric models of traditional banks. The continuous evolution and integration of embedded finance solutions and open APIs are further expanding the horizons for creating seamlessly integrated financial ecosystems.
Key Drivers, Barriers & Challenges in Challenger Banks In North America
Key Drivers:
- Technological Advancements: The rapid evolution of mobile technologies, coupled with sophisticated AI and advanced big data analytics, empowers challenger banks to operate with greater efficiency, deliver highly personalized services, and introduce novel product categories.
- Increased Consumer Demand: Particularly among younger demographics, there is a pronounced preference for intuitive user experiences, complete transparency, and digital-first financial solutions that align with their modern lifestyles.
- Favorable Regulatory Environment: In certain jurisdictions, progressive regulatory reforms are actively fostering innovation, encouraging healthy competition, and leveling the playing field for new entrants in the financial sector.
Key Challenges:
- Security Concerns: The ever-present threat of sophisticated cyberattacks and potential data breaches remains a paramount concern, demanding continuous investment in robust cybersecurity measures.
- Regulatory Compliance Complexity: Navigating and adhering to an evolving and often intricate regulatory landscape presents significant operational challenges and incurs substantial compliance costs.
- Intensified Competition: The market is characterized by fierce competition from both established incumbent banks and a growing number of agile fintech companies, necessitating a relentless pace of innovation and continuous product development. This heightened competition is exerting considerable downward pressure on pricing, potentially impacting profit margins for some challenger banks.
- Customer Acquisition Costs: The considerable investment required in marketing and customer outreach to attract and, crucially, retain customers in a crowded marketplace remains a significant financial hurdle.
Emerging Opportunities in Challenger Banks In North America
- Expansion into Underserved Markets: Challenger banks can leverage technology to reach financially underserved populations more effectively.
- Open Banking Integration: Leveraging open banking APIs to offer a wider range of integrated financial services will create more value for consumers.
- Partnerships: Strategic partnerships with other fintech companies and businesses can create new revenue streams.
Growth Accelerators in the Challenger Banks In North America Industry
Technological innovation, strategic partnerships with established financial institutions, and expansion into new markets will fuel long-term growth. The increasing adoption of embedded finance and the development of new financial products tailored to specific customer needs will also drive the expansion of this sector.
Notable Milestones in Challenger Banks In North America Sector
- October 2022: Aspiration introduced its innovative Aspiration Zero Credit Card, focusing on sustainability and rewards.
- March 2023: Varo Bank successfully secured USD 50 million in funding, achieving a valuation of USD 1.8 billion, underscoring investor confidence in its growth trajectory.
In-Depth Challenger Banks In North America Market Outlook
The trajectory for the North American challenger bank market points towards continued and substantial growth, fueled by relentless technological innovation and the persistent evolution of consumer financial behaviors and expectations. The strategic implementation of partnerships, successful expansion into previously untapped market segments, and the accelerating adoption of embedded finance solutions are poised to be defining characteristics of the industry's future. The ongoing development and refinement of novel financial products meticulously designed to cater to the diverse needs of a broad customer base will solidify the position of challenger banks as potent disruptive forces within the broader financial services sector. The future emphasis will increasingly be on crafting a truly holistic and deeply personalized financial journey for each customer, fostering greater brand loyalty and ultimately capturing a larger share of the market.
Challenger Banks In North America Segmentation
-
1. Service Type
- 1.1. Loans
- 1.2. Mobile Banking
- 1.3. Checking & Savings Account
- 1.4. Payment & Money Transfer
- 1.5. Others
-
2. End-User Type
- 2.1. Business
- 2.2. Personal
Challenger Banks In North America Segmentation By Geography
-
1. North America
- 1.1. United States
- 1.2. Canada
- 1.3. Mexico
-
2. South America
- 2.1. Brazil
- 2.2. Argentina
- 2.3. Rest of South America
-
3. Europe
- 3.1. United Kingdom
- 3.2. Germany
- 3.3. France
- 3.4. Italy
- 3.5. Spain
- 3.6. Russia
- 3.7. Benelux
- 3.8. Nordics
- 3.9. Rest of Europe
-
4. Middle East & Africa
- 4.1. Turkey
- 4.2. Israel
- 4.3. GCC
- 4.4. North Africa
- 4.5. South Africa
- 4.6. Rest of Middle East & Africa
-
5. Asia Pacific
- 5.1. China
- 5.2. India
- 5.3. Japan
- 5.4. South Korea
- 5.5. ASEAN
- 5.6. Oceania
- 5.7. Rest of Asia Pacific
Challenger Banks In North America Regional Market Share
Geographic Coverage of Challenger Banks In North America
Challenger Banks In North America REPORT HIGHLIGHTS
| Aspects | Details |
|---|---|
| Study Period | 2020-2034 |
| Base Year | 2025 |
| Estimated Year | 2026 |
| Forecast Period | 2026-2034 |
| Historical Period | 2020-2025 |
| Growth Rate | CAGR of 9.12% from 2020-2034 |
| Segmentation |
|
Table of Contents
- 1. Introduction
- 1.1. Research Scope
- 1.2. Market Segmentation
- 1.3. Research Objective
- 1.4. Definitions and Assumptions
- 2. Executive Summary
- 2.1. Market Snapshot
- 3. Market Dynamics
- 3.1. Market Drivers
- 3.2. Market Restrains
- 3.3. Market Trends
- 3.4. Market Opportunities
- 4. Market Factor Analysis
- 4.1. Porters Five Forces
- 4.1.1. Bargaining Power of Suppliers
- 4.1.2. Bargaining Power of Buyers
- 4.1.3. Threat of New Entrants
- 4.1.4. Threat of Substitutes
- 4.1.5. Competitive Rivalry
- 4.2. PESTEL analysis
- 4.3. BCG Analysis
- 4.3.1. Stars (High Growth, High Market Share)
- 4.3.2. Cash Cows (Low Growth, High Market Share)
- 4.3.3. Question Mark (High Growth, Low Market Share)
- 4.3.4. Dogs (Low Growth, Low Market Share)
- 4.4. Ansoff Matrix Analysis
- 4.5. Supply Chain Analysis
- 4.6. Regulatory Landscape
- 4.7. Current Market Potential and Opportunity Assessment (TAM–SAM–SOM Framework)
- 4.8. NRP Analyst Note
- 4.1. Porters Five Forces
- 5. Market Analysis, Insights and Forecast 2021-2033
- 5.1. Market Analysis, Insights and Forecast - by Service Type
- 5.1.1. Loans
- 5.1.2. Mobile Banking
- 5.1.3. Checking & Savings Account
- 5.1.4. Payment & Money Transfer
- 5.1.5. Others
- 5.2. Market Analysis, Insights and Forecast - by End-User Type
- 5.2.1. Business
- 5.2.2. Personal
- 5.3. Market Analysis, Insights and Forecast - by Region
- 5.3.1. North America
- 5.3.2. South America
- 5.3.3. Europe
- 5.3.4. Middle East & Africa
- 5.3.5. Asia Pacific
- 5.1. Market Analysis, Insights and Forecast - by Service Type
- 6. Global Challenger Banks In North America Analysis, Insights and Forecast, 2021-2033
- 6.1. Market Analysis, Insights and Forecast - by Service Type
- 6.1.1. Loans
- 6.1.2. Mobile Banking
- 6.1.3. Checking & Savings Account
- 6.1.4. Payment & Money Transfer
- 6.1.5. Others
- 6.2. Market Analysis, Insights and Forecast - by End-User Type
- 6.2.1. Business
- 6.2.2. Personal
- 6.1. Market Analysis, Insights and Forecast - by Service Type
- 7. North America Challenger Banks In North America Analysis, Insights and Forecast, 2020-2032
- 7.1. Market Analysis, Insights and Forecast - by Service Type
- 7.1.1. Loans
- 7.1.2. Mobile Banking
- 7.1.3. Checking & Savings Account
- 7.1.4. Payment & Money Transfer
- 7.1.5. Others
- 7.2. Market Analysis, Insights and Forecast - by End-User Type
- 7.2.1. Business
- 7.2.2. Personal
- 7.1. Market Analysis, Insights and Forecast - by Service Type
- 8. South America Challenger Banks In North America Analysis, Insights and Forecast, 2020-2032
- 8.1. Market Analysis, Insights and Forecast - by Service Type
- 8.1.1. Loans
- 8.1.2. Mobile Banking
- 8.1.3. Checking & Savings Account
- 8.1.4. Payment & Money Transfer
- 8.1.5. Others
- 8.2. Market Analysis, Insights and Forecast - by End-User Type
- 8.2.1. Business
- 8.2.2. Personal
- 8.1. Market Analysis, Insights and Forecast - by Service Type
- 9. Europe Challenger Banks In North America Analysis, Insights and Forecast, 2020-2032
- 9.1. Market Analysis, Insights and Forecast - by Service Type
- 9.1.1. Loans
- 9.1.2. Mobile Banking
- 9.1.3. Checking & Savings Account
- 9.1.4. Payment & Money Transfer
- 9.1.5. Others
- 9.2. Market Analysis, Insights and Forecast - by End-User Type
- 9.2.1. Business
- 9.2.2. Personal
- 9.1. Market Analysis, Insights and Forecast - by Service Type
- 10. Middle East & Africa Challenger Banks In North America Analysis, Insights and Forecast, 2020-2032
- 10.1. Market Analysis, Insights and Forecast - by Service Type
- 10.1.1. Loans
- 10.1.2. Mobile Banking
- 10.1.3. Checking & Savings Account
- 10.1.4. Payment & Money Transfer
- 10.1.5. Others
- 10.2. Market Analysis, Insights and Forecast - by End-User Type
- 10.2.1. Business
- 10.2.2. Personal
- 10.1. Market Analysis, Insights and Forecast - by Service Type
- 11. Asia Pacific Challenger Banks In North America Analysis, Insights and Forecast, 2020-2032
- 11.1. Market Analysis, Insights and Forecast - by Service Type
- 11.1.1. Loans
- 11.1.2. Mobile Banking
- 11.1.3. Checking & Savings Account
- 11.1.4. Payment & Money Transfer
- 11.1.5. Others
- 11.2. Market Analysis, Insights and Forecast - by End-User Type
- 11.2.1. Business
- 11.2.2. Personal
- 11.1. Market Analysis, Insights and Forecast - by Service Type
- 12. Competitive Analysis
- 12.1. Company Profiles
- 12.1.1 Chime
- 12.1.1.1. Company Overview
- 12.1.1.2. Products
- 12.1.1.3. Company Financials
- 12.1.1.4. SWOT Analysis
- 12.1.2 Varo
- 12.1.2.1. Company Overview
- 12.1.2.2. Products
- 12.1.2.3. Company Financials
- 12.1.2.4. SWOT Analysis
- 12.1.3 Aspiration
- 12.1.3.1. Company Overview
- 12.1.3.2. Products
- 12.1.3.3. Company Financials
- 12.1.3.4. SWOT Analysis
- 12.1.4 MoneyLion
- 12.1.4.1. Company Overview
- 12.1.4.2. Products
- 12.1.4.3. Company Financials
- 12.1.4.4. SWOT Analysis
- 12.1.5 Qapital
- 12.1.5.1. Company Overview
- 12.1.5.2. Products
- 12.1.5.3. Company Financials
- 12.1.5.4. SWOT Analysis
- 12.1.6 BankMobile
- 12.1.6.1. Company Overview
- 12.1.6.2. Products
- 12.1.6.3. Company Financials
- 12.1.6.4. SWOT Analysis
- 12.1.7 Upgrade
- 12.1.7.1. Company Overview
- 12.1.7.2. Products
- 12.1.7.3. Company Financials
- 12.1.7.4. SWOT Analysis
- 12.1.8 Dave
- 12.1.8.1. Company Overview
- 12.1.8.2. Products
- 12.1.8.3. Company Financials
- 12.1.8.4. SWOT Analysis
- 12.1.9 Zero
- 12.1.9.1. Company Overview
- 12.1.9.2. Products
- 12.1.9.3. Company Financials
- 12.1.9.4. SWOT Analysis
- 12.1.10 Stash
- 12.1.10.1. Company Overview
- 12.1.10.2. Products
- 12.1.10.3. Company Financials
- 12.1.10.4. SWOT Analysis
- 12.1.11 Deserve
- 12.1.11.1. Company Overview
- 12.1.11.2. Products
- 12.1.11.3. Company Financials
- 12.1.11.4. SWOT Analysis
- 12.1.12 Current**List Not Exhaustive
- 12.1.12.1. Company Overview
- 12.1.12.2. Products
- 12.1.12.3. Company Financials
- 12.1.12.4. SWOT Analysis
- 12.1.1 Chime
- 12.2. Market Entropy
- 12.2.1 Company's Key Areas Served
- 12.2.2 Recent Developments
- 12.3. Company Market Share Analysis 2025
- 12.3.1 Top 5 Companies Market Share Analysis
- 12.3.2 Top 3 Companies Market Share Analysis
- 12.4. List of Potential Customers
- 13. Research Methodology
List of Figures
- Figure 1: Global Challenger Banks In North America Revenue Breakdown (Million, %) by Region 2025 & 2033
- Figure 2: Global Challenger Banks In North America Volume Breakdown (Billion, %) by Region 2025 & 2033
- Figure 3: North America Challenger Banks In North America Revenue (Million), by Service Type 2025 & 2033
- Figure 4: North America Challenger Banks In North America Volume (Billion), by Service Type 2025 & 2033
- Figure 5: North America Challenger Banks In North America Revenue Share (%), by Service Type 2025 & 2033
- Figure 6: North America Challenger Banks In North America Volume Share (%), by Service Type 2025 & 2033
- Figure 7: North America Challenger Banks In North America Revenue (Million), by End-User Type 2025 & 2033
- Figure 8: North America Challenger Banks In North America Volume (Billion), by End-User Type 2025 & 2033
- Figure 9: North America Challenger Banks In North America Revenue Share (%), by End-User Type 2025 & 2033
- Figure 10: North America Challenger Banks In North America Volume Share (%), by End-User Type 2025 & 2033
- Figure 11: North America Challenger Banks In North America Revenue (Million), by Country 2025 & 2033
- Figure 12: North America Challenger Banks In North America Volume (Billion), by Country 2025 & 2033
- Figure 13: North America Challenger Banks In North America Revenue Share (%), by Country 2025 & 2033
- Figure 14: North America Challenger Banks In North America Volume Share (%), by Country 2025 & 2033
- Figure 15: South America Challenger Banks In North America Revenue (Million), by Service Type 2025 & 2033
- Figure 16: South America Challenger Banks In North America Volume (Billion), by Service Type 2025 & 2033
- Figure 17: South America Challenger Banks In North America Revenue Share (%), by Service Type 2025 & 2033
- Figure 18: South America Challenger Banks In North America Volume Share (%), by Service Type 2025 & 2033
- Figure 19: South America Challenger Banks In North America Revenue (Million), by End-User Type 2025 & 2033
- Figure 20: South America Challenger Banks In North America Volume (Billion), by End-User Type 2025 & 2033
- Figure 21: South America Challenger Banks In North America Revenue Share (%), by End-User Type 2025 & 2033
- Figure 22: South America Challenger Banks In North America Volume Share (%), by End-User Type 2025 & 2033
- Figure 23: South America Challenger Banks In North America Revenue (Million), by Country 2025 & 2033
- Figure 24: South America Challenger Banks In North America Volume (Billion), by Country 2025 & 2033
- Figure 25: South America Challenger Banks In North America Revenue Share (%), by Country 2025 & 2033
- Figure 26: South America Challenger Banks In North America Volume Share (%), by Country 2025 & 2033
- Figure 27: Europe Challenger Banks In North America Revenue (Million), by Service Type 2025 & 2033
- Figure 28: Europe Challenger Banks In North America Volume (Billion), by Service Type 2025 & 2033
- Figure 29: Europe Challenger Banks In North America Revenue Share (%), by Service Type 2025 & 2033
- Figure 30: Europe Challenger Banks In North America Volume Share (%), by Service Type 2025 & 2033
- Figure 31: Europe Challenger Banks In North America Revenue (Million), by End-User Type 2025 & 2033
- Figure 32: Europe Challenger Banks In North America Volume (Billion), by End-User Type 2025 & 2033
- Figure 33: Europe Challenger Banks In North America Revenue Share (%), by End-User Type 2025 & 2033
- Figure 34: Europe Challenger Banks In North America Volume Share (%), by End-User Type 2025 & 2033
- Figure 35: Europe Challenger Banks In North America Revenue (Million), by Country 2025 & 2033
- Figure 36: Europe Challenger Banks In North America Volume (Billion), by Country 2025 & 2033
- Figure 37: Europe Challenger Banks In North America Revenue Share (%), by Country 2025 & 2033
- Figure 38: Europe Challenger Banks In North America Volume Share (%), by Country 2025 & 2033
- Figure 39: Middle East & Africa Challenger Banks In North America Revenue (Million), by Service Type 2025 & 2033
- Figure 40: Middle East & Africa Challenger Banks In North America Volume (Billion), by Service Type 2025 & 2033
- Figure 41: Middle East & Africa Challenger Banks In North America Revenue Share (%), by Service Type 2025 & 2033
- Figure 42: Middle East & Africa Challenger Banks In North America Volume Share (%), by Service Type 2025 & 2033
- Figure 43: Middle East & Africa Challenger Banks In North America Revenue (Million), by End-User Type 2025 & 2033
- Figure 44: Middle East & Africa Challenger Banks In North America Volume (Billion), by End-User Type 2025 & 2033
- Figure 45: Middle East & Africa Challenger Banks In North America Revenue Share (%), by End-User Type 2025 & 2033
- Figure 46: Middle East & Africa Challenger Banks In North America Volume Share (%), by End-User Type 2025 & 2033
- Figure 47: Middle East & Africa Challenger Banks In North America Revenue (Million), by Country 2025 & 2033
- Figure 48: Middle East & Africa Challenger Banks In North America Volume (Billion), by Country 2025 & 2033
- Figure 49: Middle East & Africa Challenger Banks In North America Revenue Share (%), by Country 2025 & 2033
- Figure 50: Middle East & Africa Challenger Banks In North America Volume Share (%), by Country 2025 & 2033
- Figure 51: Asia Pacific Challenger Banks In North America Revenue (Million), by Service Type 2025 & 2033
- Figure 52: Asia Pacific Challenger Banks In North America Volume (Billion), by Service Type 2025 & 2033
- Figure 53: Asia Pacific Challenger Banks In North America Revenue Share (%), by Service Type 2025 & 2033
- Figure 54: Asia Pacific Challenger Banks In North America Volume Share (%), by Service Type 2025 & 2033
- Figure 55: Asia Pacific Challenger Banks In North America Revenue (Million), by End-User Type 2025 & 2033
- Figure 56: Asia Pacific Challenger Banks In North America Volume (Billion), by End-User Type 2025 & 2033
- Figure 57: Asia Pacific Challenger Banks In North America Revenue Share (%), by End-User Type 2025 & 2033
- Figure 58: Asia Pacific Challenger Banks In North America Volume Share (%), by End-User Type 2025 & 2033
- Figure 59: Asia Pacific Challenger Banks In North America Revenue (Million), by Country 2025 & 2033
- Figure 60: Asia Pacific Challenger Banks In North America Volume (Billion), by Country 2025 & 2033
- Figure 61: Asia Pacific Challenger Banks In North America Revenue Share (%), by Country 2025 & 2033
- Figure 62: Asia Pacific Challenger Banks In North America Volume Share (%), by Country 2025 & 2033
List of Tables
- Table 1: Global Challenger Banks In North America Revenue Million Forecast, by Service Type 2020 & 2033
- Table 2: Global Challenger Banks In North America Volume Billion Forecast, by Service Type 2020 & 2033
- Table 3: Global Challenger Banks In North America Revenue Million Forecast, by End-User Type 2020 & 2033
- Table 4: Global Challenger Banks In North America Volume Billion Forecast, by End-User Type 2020 & 2033
- Table 5: Global Challenger Banks In North America Revenue Million Forecast, by Region 2020 & 2033
- Table 6: Global Challenger Banks In North America Volume Billion Forecast, by Region 2020 & 2033
- Table 7: Global Challenger Banks In North America Revenue Million Forecast, by Service Type 2020 & 2033
- Table 8: Global Challenger Banks In North America Volume Billion Forecast, by Service Type 2020 & 2033
- Table 9: Global Challenger Banks In North America Revenue Million Forecast, by End-User Type 2020 & 2033
- Table 10: Global Challenger Banks In North America Volume Billion Forecast, by End-User Type 2020 & 2033
- Table 11: Global Challenger Banks In North America Revenue Million Forecast, by Country 2020 & 2033
- Table 12: Global Challenger Banks In North America Volume Billion Forecast, by Country 2020 & 2033
- Table 13: United States Challenger Banks In North America Revenue (Million) Forecast, by Application 2020 & 2033
- Table 14: United States Challenger Banks In North America Volume (Billion) Forecast, by Application 2020 & 2033
- Table 15: Canada Challenger Banks In North America Revenue (Million) Forecast, by Application 2020 & 2033
- Table 16: Canada Challenger Banks In North America Volume (Billion) Forecast, by Application 2020 & 2033
- Table 17: Mexico Challenger Banks In North America Revenue (Million) Forecast, by Application 2020 & 2033
- Table 18: Mexico Challenger Banks In North America Volume (Billion) Forecast, by Application 2020 & 2033
- Table 19: Global Challenger Banks In North America Revenue Million Forecast, by Service Type 2020 & 2033
- Table 20: Global Challenger Banks In North America Volume Billion Forecast, by Service Type 2020 & 2033
- Table 21: Global Challenger Banks In North America Revenue Million Forecast, by End-User Type 2020 & 2033
- Table 22: Global Challenger Banks In North America Volume Billion Forecast, by End-User Type 2020 & 2033
- Table 23: Global Challenger Banks In North America Revenue Million Forecast, by Country 2020 & 2033
- Table 24: Global Challenger Banks In North America Volume Billion Forecast, by Country 2020 & 2033
- Table 25: Brazil Challenger Banks In North America Revenue (Million) Forecast, by Application 2020 & 2033
- Table 26: Brazil Challenger Banks In North America Volume (Billion) Forecast, by Application 2020 & 2033
- Table 27: Argentina Challenger Banks In North America Revenue (Million) Forecast, by Application 2020 & 2033
- Table 28: Argentina Challenger Banks In North America Volume (Billion) Forecast, by Application 2020 & 2033
- Table 29: Rest of South America Challenger Banks In North America Revenue (Million) Forecast, by Application 2020 & 2033
- Table 30: Rest of South America Challenger Banks In North America Volume (Billion) Forecast, by Application 2020 & 2033
- Table 31: Global Challenger Banks In North America Revenue Million Forecast, by Service Type 2020 & 2033
- Table 32: Global Challenger Banks In North America Volume Billion Forecast, by Service Type 2020 & 2033
- Table 33: Global Challenger Banks In North America Revenue Million Forecast, by End-User Type 2020 & 2033
- Table 34: Global Challenger Banks In North America Volume Billion Forecast, by End-User Type 2020 & 2033
- Table 35: Global Challenger Banks In North America Revenue Million Forecast, by Country 2020 & 2033
- Table 36: Global Challenger Banks In North America Volume Billion Forecast, by Country 2020 & 2033
- Table 37: United Kingdom Challenger Banks In North America Revenue (Million) Forecast, by Application 2020 & 2033
- Table 38: United Kingdom Challenger Banks In North America Volume (Billion) Forecast, by Application 2020 & 2033
- Table 39: Germany Challenger Banks In North America Revenue (Million) Forecast, by Application 2020 & 2033
- Table 40: Germany Challenger Banks In North America Volume (Billion) Forecast, by Application 2020 & 2033
- Table 41: France Challenger Banks In North America Revenue (Million) Forecast, by Application 2020 & 2033
- Table 42: France Challenger Banks In North America Volume (Billion) Forecast, by Application 2020 & 2033
- Table 43: Italy Challenger Banks In North America Revenue (Million) Forecast, by Application 2020 & 2033
- Table 44: Italy Challenger Banks In North America Volume (Billion) Forecast, by Application 2020 & 2033
- Table 45: Spain Challenger Banks In North America Revenue (Million) Forecast, by Application 2020 & 2033
- Table 46: Spain Challenger Banks In North America Volume (Billion) Forecast, by Application 2020 & 2033
- Table 47: Russia Challenger Banks In North America Revenue (Million) Forecast, by Application 2020 & 2033
- Table 48: Russia Challenger Banks In North America Volume (Billion) Forecast, by Application 2020 & 2033
- Table 49: Benelux Challenger Banks In North America Revenue (Million) Forecast, by Application 2020 & 2033
- Table 50: Benelux Challenger Banks In North America Volume (Billion) Forecast, by Application 2020 & 2033
- Table 51: Nordics Challenger Banks In North America Revenue (Million) Forecast, by Application 2020 & 2033
- Table 52: Nordics Challenger Banks In North America Volume (Billion) Forecast, by Application 2020 & 2033
- Table 53: Rest of Europe Challenger Banks In North America Revenue (Million) Forecast, by Application 2020 & 2033
- Table 54: Rest of Europe Challenger Banks In North America Volume (Billion) Forecast, by Application 2020 & 2033
- Table 55: Global Challenger Banks In North America Revenue Million Forecast, by Service Type 2020 & 2033
- Table 56: Global Challenger Banks In North America Volume Billion Forecast, by Service Type 2020 & 2033
- Table 57: Global Challenger Banks In North America Revenue Million Forecast, by End-User Type 2020 & 2033
- Table 58: Global Challenger Banks In North America Volume Billion Forecast, by End-User Type 2020 & 2033
- Table 59: Global Challenger Banks In North America Revenue Million Forecast, by Country 2020 & 2033
- Table 60: Global Challenger Banks In North America Volume Billion Forecast, by Country 2020 & 2033
- Table 61: Turkey Challenger Banks In North America Revenue (Million) Forecast, by Application 2020 & 2033
- Table 62: Turkey Challenger Banks In North America Volume (Billion) Forecast, by Application 2020 & 2033
- Table 63: Israel Challenger Banks In North America Revenue (Million) Forecast, by Application 2020 & 2033
- Table 64: Israel Challenger Banks In North America Volume (Billion) Forecast, by Application 2020 & 2033
- Table 65: GCC Challenger Banks In North America Revenue (Million) Forecast, by Application 2020 & 2033
- Table 66: GCC Challenger Banks In North America Volume (Billion) Forecast, by Application 2020 & 2033
- Table 67: North Africa Challenger Banks In North America Revenue (Million) Forecast, by Application 2020 & 2033
- Table 68: North Africa Challenger Banks In North America Volume (Billion) Forecast, by Application 2020 & 2033
- Table 69: South Africa Challenger Banks In North America Revenue (Million) Forecast, by Application 2020 & 2033
- Table 70: South Africa Challenger Banks In North America Volume (Billion) Forecast, by Application 2020 & 2033
- Table 71: Rest of Middle East & Africa Challenger Banks In North America Revenue (Million) Forecast, by Application 2020 & 2033
- Table 72: Rest of Middle East & Africa Challenger Banks In North America Volume (Billion) Forecast, by Application 2020 & 2033
- Table 73: Global Challenger Banks In North America Revenue Million Forecast, by Service Type 2020 & 2033
- Table 74: Global Challenger Banks In North America Volume Billion Forecast, by Service Type 2020 & 2033
- Table 75: Global Challenger Banks In North America Revenue Million Forecast, by End-User Type 2020 & 2033
- Table 76: Global Challenger Banks In North America Volume Billion Forecast, by End-User Type 2020 & 2033
- Table 77: Global Challenger Banks In North America Revenue Million Forecast, by Country 2020 & 2033
- Table 78: Global Challenger Banks In North America Volume Billion Forecast, by Country 2020 & 2033
- Table 79: China Challenger Banks In North America Revenue (Million) Forecast, by Application 2020 & 2033
- Table 80: China Challenger Banks In North America Volume (Billion) Forecast, by Application 2020 & 2033
- Table 81: India Challenger Banks In North America Revenue (Million) Forecast, by Application 2020 & 2033
- Table 82: India Challenger Banks In North America Volume (Billion) Forecast, by Application 2020 & 2033
- Table 83: Japan Challenger Banks In North America Revenue (Million) Forecast, by Application 2020 & 2033
- Table 84: Japan Challenger Banks In North America Volume (Billion) Forecast, by Application 2020 & 2033
- Table 85: South Korea Challenger Banks In North America Revenue (Million) Forecast, by Application 2020 & 2033
- Table 86: South Korea Challenger Banks In North America Volume (Billion) Forecast, by Application 2020 & 2033
- Table 87: ASEAN Challenger Banks In North America Revenue (Million) Forecast, by Application 2020 & 2033
- Table 88: ASEAN Challenger Banks In North America Volume (Billion) Forecast, by Application 2020 & 2033
- Table 89: Oceania Challenger Banks In North America Revenue (Million) Forecast, by Application 2020 & 2033
- Table 90: Oceania Challenger Banks In North America Volume (Billion) Forecast, by Application 2020 & 2033
- Table 91: Rest of Asia Pacific Challenger Banks In North America Revenue (Million) Forecast, by Application 2020 & 2033
- Table 92: Rest of Asia Pacific Challenger Banks In North America Volume (Billion) Forecast, by Application 2020 & 2033
Frequently Asked Questions
1. What is the projected Compound Annual Growth Rate (CAGR) of the Challenger Banks In North America?
The projected CAGR is approximately 9.12%.
2. Which companies are prominent players in the Challenger Banks In North America?
Key companies in the market include Chime, Varo, Aspiration, MoneyLion, Qapital, BankMobile, Upgrade, Dave, Zero, Stash, Deserve, Current**List Not Exhaustive.
3. What are the main segments of the Challenger Banks In North America?
The market segments include Service Type, End-User Type.
4. Can you provide details about the market size?
The market size is estimated to be USD 10 Million as of 2022.
5. What are some drivers contributing to market growth?
N/A
6. What are the notable trends driving market growth?
Convenience Offered to Consumers Drives The Market.
7. Are there any restraints impacting market growth?
N/A
8. Can you provide examples of recent developments in the market?
March 2023: US challenger Varo Bank is reportedly raising USD 50 million at a USD 1.8 billion valuation, a 28% decline in value since its last fundraising. The firm was valued at USD 2.5 billion in September 2021 after raising USD 510 million in a Series E funding round led by Lone Pine Capital.
9. What pricing options are available for accessing the report?
Pricing options include single-user, multi-user, and enterprise licenses priced at USD 4750, USD 4950, and USD 6800 respectively.
10. Is the market size provided in terms of value or volume?
The market size is provided in terms of value, measured in Million and volume, measured in Billion.
11. Are there any specific market keywords associated with the report?
Yes, the market keyword associated with the report is "Challenger Banks In North America," which aids in identifying and referencing the specific market segment covered.
12. How do I determine which pricing option suits my needs best?
The pricing options vary based on user requirements and access needs. Individual users may opt for single-user licenses, while businesses requiring broader access may choose multi-user or enterprise licenses for cost-effective access to the report.
13. Are there any additional resources or data provided in the Challenger Banks In North America report?
While the report offers comprehensive insights, it's advisable to review the specific contents or supplementary materials provided to ascertain if additional resources or data are available.
14. How can I stay updated on further developments or reports in the Challenger Banks In North America?
To stay informed about further developments, trends, and reports in the Challenger Banks In North America, consider subscribing to industry newsletters, following relevant companies and organizations, or regularly checking reputable industry news sources and publications.
Methodology
Step 1 - Identification of Relevant Samples Size from Population Database


Step 2 - Approaches for Defining Global Market Size (Value, Volume* & Price*)

Note*: In applicable scenarios
Step 3 - Data Sources
Primary Research
- Web Analytics
- Survey Reports
- Research Institute
- Latest Research Reports
- Opinion Leaders
Secondary Research
- Annual Reports
- White Paper
- Latest Press Release
- Industry Association
- Paid Database
- Investor Presentations

Step 4 - Data Triangulation
Involves using different sources of information in order to increase the validity of a study
These sources are likely to be stakeholders in a program - participants, other researchers, program staff, other community members, and so on.
Then we put all data in single framework & apply various statistical tools to find out the dynamic on the market.
During the analysis stage, feedback from the stakeholder groups would be compared to determine areas of agreement as well as areas of divergence