

Key Insights
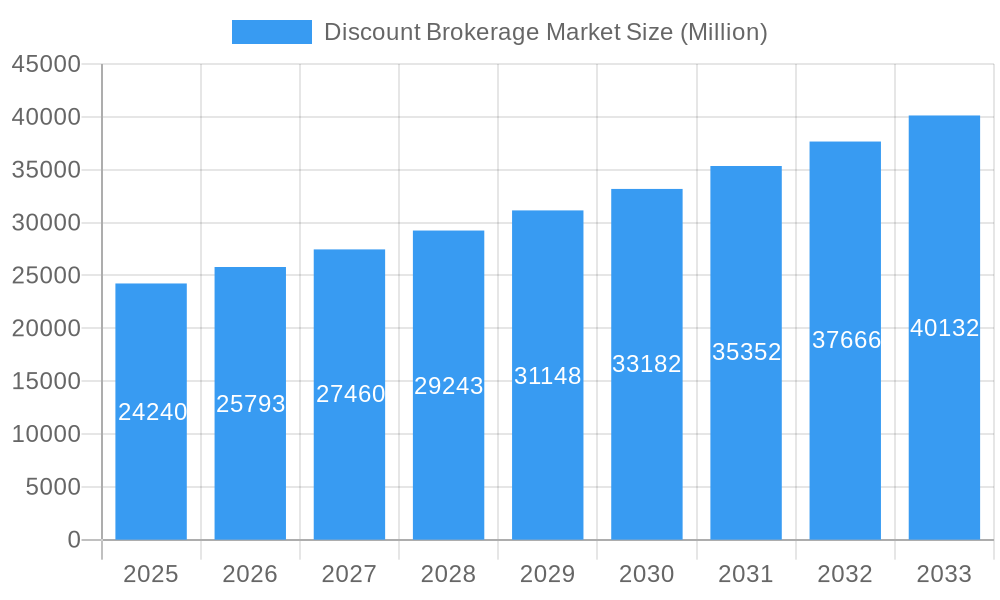
The discount brokerage market, valued at $24.24 billion in 2025, is projected to experience robust growth, driven by several key factors. The increasing adoption of online trading platforms, fueled by technological advancements and the rising popularity of mobile investing apps, significantly contributes to this expansion. Furthermore, the growing number of millennial and Gen Z investors, comfortable with digital platforms and seeking cost-effective investment solutions, fuels market demand. Lower commission fees and a wider range of investment products offered by discount brokers compared to traditional full-service firms also contribute to market growth. Regulatory changes promoting financial inclusion and easier access to investment opportunities further enhance market expansion. Competitive pressures among established players and the emergence of new fintech companies continually innovate the market, leading to enhanced user experiences and improved functionalities. Despite the positive outlook, challenges such as cybersecurity threats, market volatility impacting investor confidence, and increasing regulatory scrutiny could potentially hinder market growth.
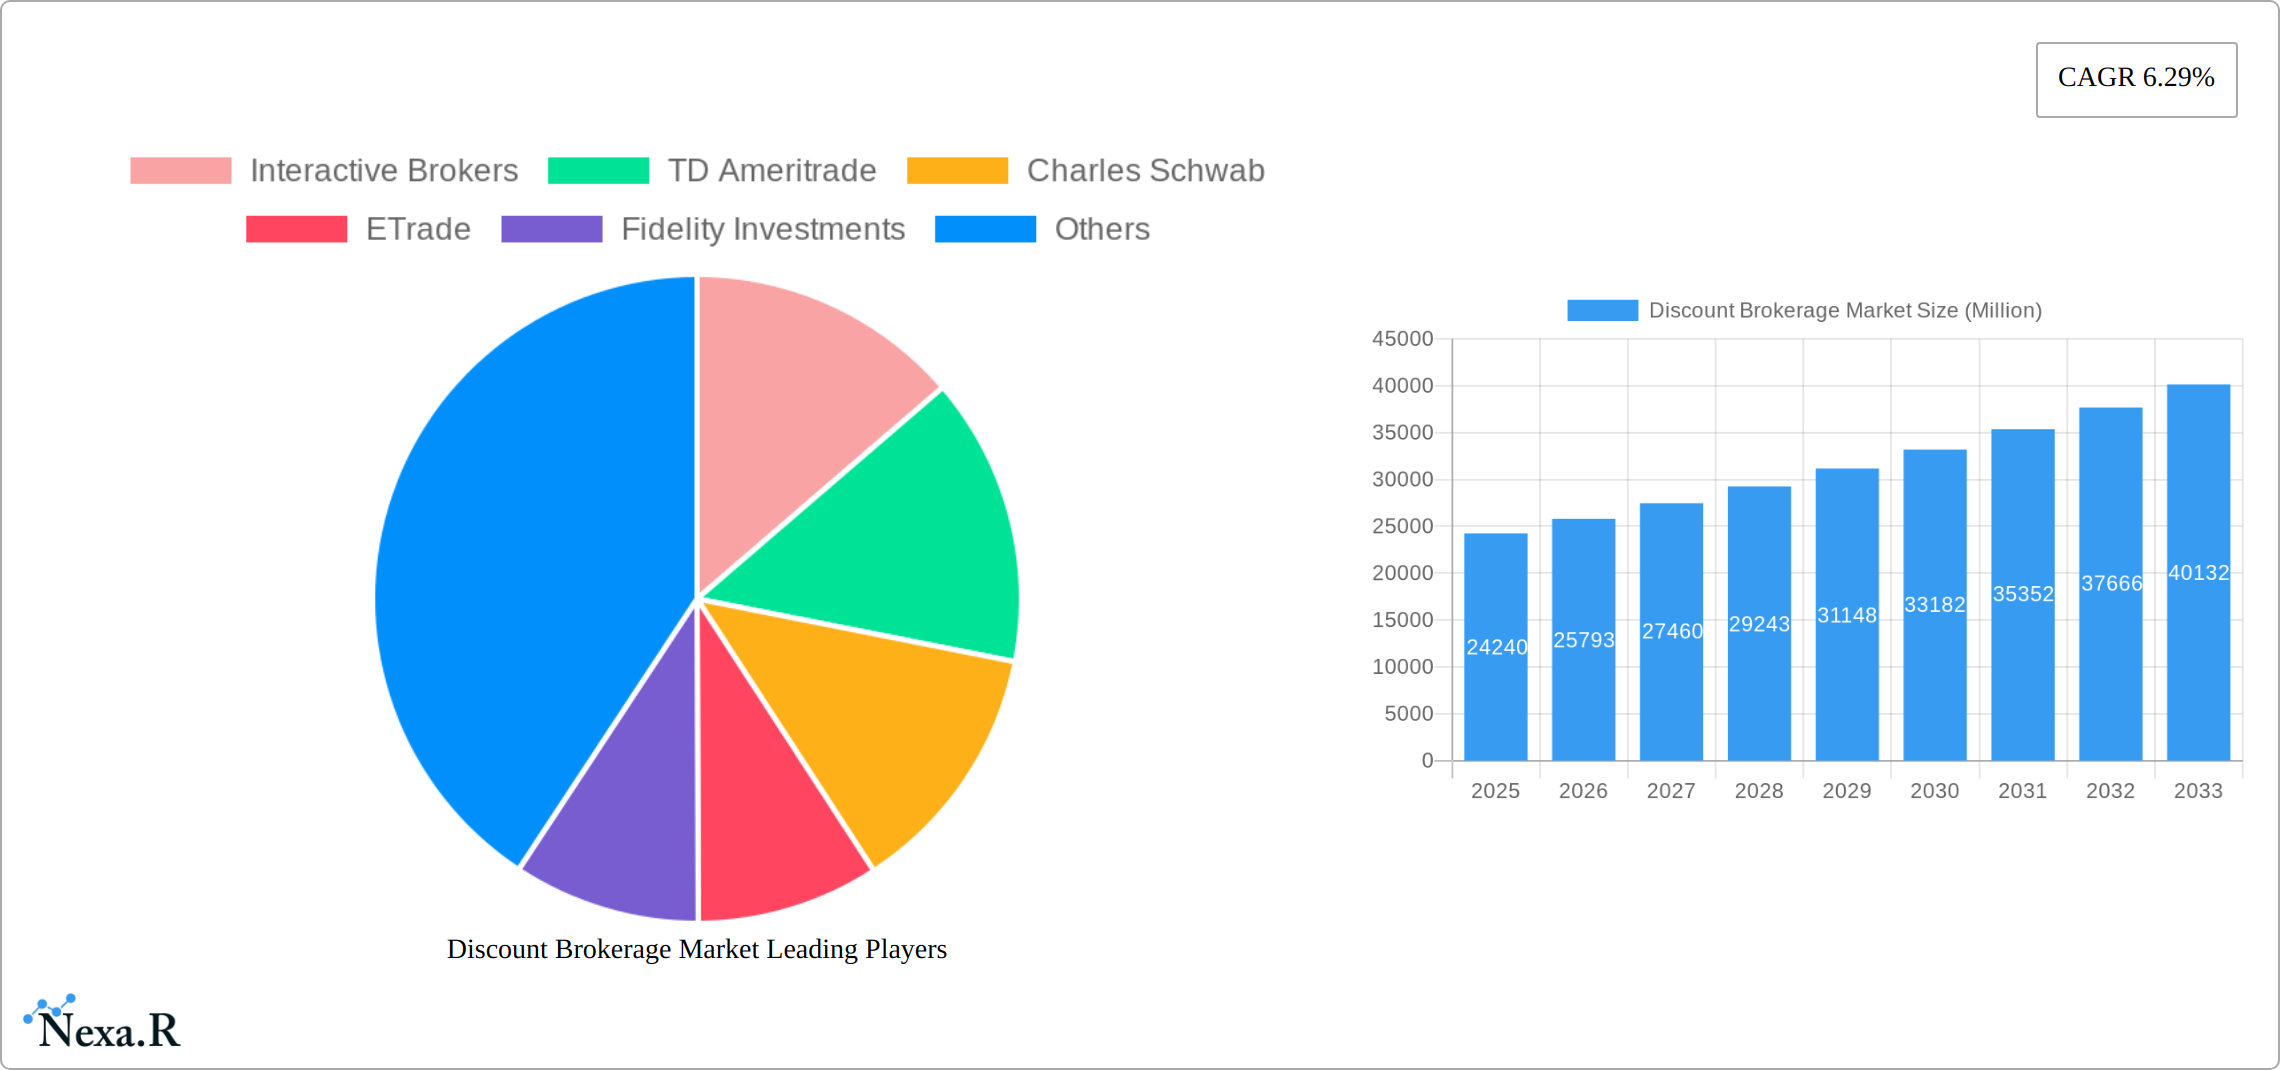
Discount Brokerage Market Market Size (In Billion)
The projected Compound Annual Growth Rate (CAGR) of 6.29% from 2025 to 2033 indicates a steady expansion of the market. This growth will likely be driven by geographic expansion into emerging markets and the continued development of sophisticated algorithmic trading tools and artificial intelligence-driven investment advice. The market is segmented by various factors, including service offerings (e.g., basic trading vs. advanced options), target demographics (e.g., beginners vs. experienced traders), and geographic regions. Leading players like Interactive Brokers, TD Ameritrade, Charles Schwab, E*TRADE, Fidelity Investments, Robinhood, Vanguard, Ally Invest, Firstrade, and DEGIRO are actively competing, fostering innovation and influencing market dynamics. However, maintaining a balance between cost efficiency and robust security measures remains a crucial challenge for all players. The ongoing evolution of investor preferences and regulatory landscapes will continue shaping the future trajectory of the discount brokerage market.
Discount Brokerage Market Company Market Share
Discount Brokerage Market: A Comprehensive Report (2019-2033)
This comprehensive report provides an in-depth analysis of the Discount Brokerage Market, encompassing market dynamics, growth trends, regional analysis, competitive landscape, and future outlook. With a study period spanning 2019-2033, a base year of 2025, and a forecast period of 2025-2033, this report offers invaluable insights for industry professionals, investors, and strategic decision-makers. The parent market is the broader Financial Services industry, with the child market being Discount Brokerage. The market size in 2024 is estimated at xx Million.
Discount Brokerage Market Dynamics & Structure
This section analyzes the competitive intensity, technological advancements, regulatory environment, and market trends within the Discount Brokerage Market. The market is characterized by a high degree of competition, with key players vying for market share through technological innovation and strategic partnerships.
- Market Concentration: The market exhibits moderate concentration, with several large players holding significant shares, alongside a multitude of smaller players. In 2024, the top 5 players held an estimated xx% market share.
- Technological Innovation: Technological advancements, such as AI-powered trading tools and robo-advisors, are reshaping the landscape, driving efficiency and accessibility. However, high development costs and cybersecurity concerns present innovation barriers.
- Regulatory Frameworks: Stringent regulations regarding data privacy, security, and trading practices influence market dynamics and operational costs. Changes in regulations can significantly impact market growth and profitability.
- Competitive Product Substitutes: Other investment platforms, such as peer-to-peer lending and crowdfunding, offer competitive alternatives to traditional discount brokerage services.
- End-User Demographics: The market caters to a diverse clientele, ranging from individual investors to institutional clients, with millennials and Gen Z increasingly adopting online brokerage services.
- M&A Trends: The Discount Brokerage Market has witnessed a notable number of mergers and acquisitions (M&A) deals in recent years (xx deals in 2019-2024). This consolidation trend is expected to continue, driven by synergies and expansion strategies.
Discount Brokerage Market Growth Trends & Insights
The Discount Brokerage Market is experiencing a robust and dynamic growth trajectory, propelled by several converging factors. Over the past five years, we've witnessed a significant surge in market expansion, directly attributable to the pervasive growth of internet penetration and the ubiquitous adoption of smartphones. This has democratized access to financial markets, encouraging a substantial influx of retail investor participation. Furthermore, technological innovations, particularly the proliferation of intuitive mobile trading platforms and sophisticated algorithmic trading strategies, have acted as powerful catalysts, accelerating market development. Projections indicate a Compound Annual Growth Rate (CAGR) of approximately xx% between 2019 and 2024, with the market poised to reach an impressive xx Million by the close of 2024. A pivotal shift in consumer behavior, characterized by a growing preference for self-directed investing and an unwavering demand for cost-effective brokerage services, is fundamentally shaping market dynamics. As financial literacy continues to rise and digitalization further permeates the investment landscape, we anticipate an even greater penetration of discount brokerage services in the coming years.
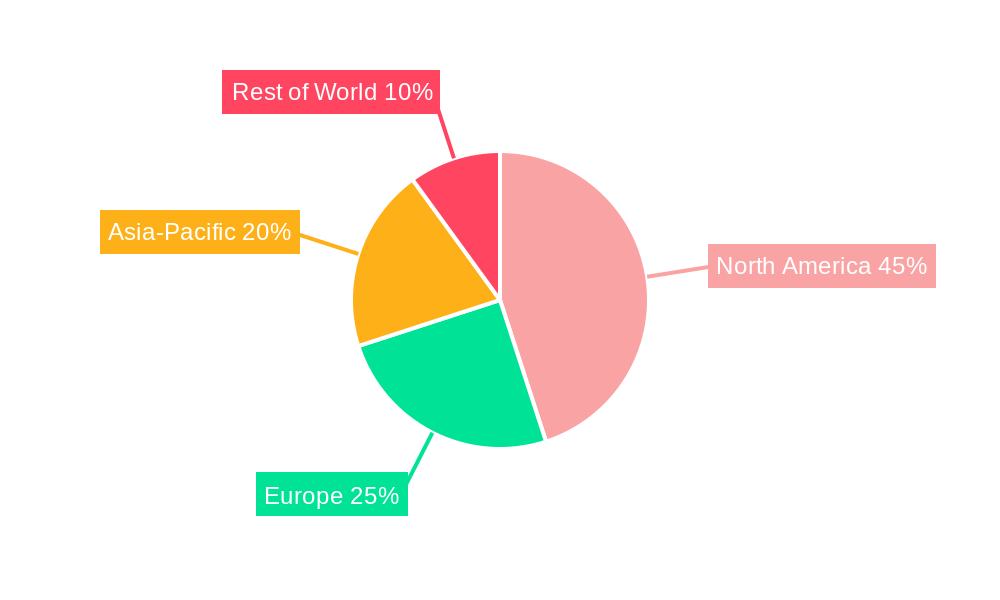
Dominant Regions, Countries, or Segments in Discount Brokerage Market
North America currently dominates the global Discount Brokerage Market, owing to high internet penetration, sophisticated financial infrastructure, and a strong culture of investing. Asia-Pacific is also emerging as a significant market, driven by rapid economic growth and rising middle-class disposable incomes.
- Key Drivers in North America: Strong regulatory framework, established financial infrastructure, high internet penetration, and a culture of individual investing.
- Key Drivers in Asia-Pacific: Rapid economic growth, increasing middle-class disposable incomes, and rising smartphone penetration.
- Market Share & Growth Potential: North America holds the largest market share (estimated at xx% in 2024), with Asia-Pacific poised for significant growth in the coming years.
Discount Brokerage Market Product Landscape
The Discount Brokerage Market presents a comprehensive and evolving suite of products and services designed to empower a diverse range of investors. This includes highly accessible online trading platforms, intuitive mobile applications, AI-driven robo-advisors that offer automated portfolio management, and a rich array of analytical research tools. The current wave of innovation is keenly focused on elevating the user experience through streamlined interfaces, fortifying security measures to protect client assets and data, and broadening the spectrum of investment possibilities. This expansion now encompasses the trading of fractional shares, allowing for more accessible entry points into high-value stocks, and the inclusion of popular cryptocurrencies. The unique selling propositions that differentiate players in this market often revolve around their highly competitive pricing structures, the provision of advanced and sophisticated trading tools, and the capacity to offer tailored, albeit often digitally delivered, investment advice that caters to individual investor profiles.
Key Drivers, Barriers & Challenges in Discount Brokerage Market
Key Drivers:
- The ever-increasing accessibility and affordability of internet services and smartphones, creating a vast pool of potential investors.
- A significant and ongoing rise in participation from individual retail investors seeking to engage with financial markets.
- Continuous technological advancements, including the integration of artificial intelligence and machine learning to enhance trading capabilities and provide predictive analytics.
- A persistent and growing demand from investors for cost-effective and transparent brokerage services.
- The introduction of new asset classes and innovative investment products, such as fractional shares and digital assets, attracting a wider audience.
Challenges:
- The fiercely competitive nature of the market, with both established discount brokers and agile new entrants vying for market share.
- Navigating complex and evolving regulatory landscapes, which can lead to increased compliance costs and operational complexities.
- The ever-present threat of cybersecurity risks, including data breaches and phishing attempts, which can severely damage investor trust and brand reputation.
- The inherent volatility and unpredictability of global financial markets, which can impact trading volumes and investor confidence.
- The need for continuous investment in technology and infrastructure to stay ahead of evolving user expectations and competitive offerings.
Emerging Opportunities in Discount Brokerage Market
- Expansion into untapped markets (e.g., emerging economies).
- Development of innovative products (e.g., ESG investing, crypto trading).
- Personalization of investment advice through AI and machine learning.
- Leveraging fintech partnerships to enhance service offerings.
Growth Accelerators in the Discount Brokerage Market Industry
Strategic partnerships with fintech companies, expanding into underserved markets, and leveraging technological advancements to enhance service offerings are key growth catalysts. Furthermore, innovations in AI-driven investment tools and personalized financial planning services will propel market expansion.
Key Players Shaping the Discount Brokerage Market Market
- Interactive Brokers
- TD Ameritrade
- Charles Schwab
- ETrade
- Fidelity Investments
- Robinhood
- Vanguard
- Ally Invest
- Firstrade
- DEGIRO
- List Not Exhaustive
Notable Milestones in Discount Brokerage Market Sector
- September 2023: HDFC Securities further solidified its position in the discount brokerage space with the launch of its innovative platform, Sky, which offers an extensive array of trading and investment functionalities designed to cater to a broad spectrum of investor needs.
- September 2023: Ujjivan Small Finance Bank (SFB) strategically partnered with SMC Global Securities, marking a significant move to broaden its service offerings and enable its existing clientele to access seamless online trading and investment services.
- Q4 2023: Several emerging fintech startups introduced user-friendly mobile applications with gamified features, attracting younger demographics and increasing engagement with novice investors.
- Early 2024: Leading discount brokers announced enhancements to their research offerings, incorporating AI-powered sentiment analysis and real-time market insights to provide more informed trading decisions for their users.
In-Depth Discount Brokerage Market Market Outlook
The Discount Brokerage Market is poised for continued growth, driven by technological innovation, increased retail investor participation, and expansion into new markets. Strategic partnerships, product diversification, and enhanced security measures will be crucial for success in this competitive landscape. The market is expected to reach xx Million by 2033.
Discount Brokerage Market Segmentation
-
1. Mode
- 1.1. Online Discount Brokerage Service
- 1.2. Offline Discount Brokerage Service
-
2. Application
- 2.1. Individual
- 2.2. Enterprise
- 2.3. Government Agencies
-
3. Services
- 3.1. Order Execution and Advisory
- 3.2. Discretionary
- 3.3. Online Trading Platforms
- 3.4. Education and Investor Resources
-
4. Commission
- 4.1. Commission-free Brokers
- 4.2. Fixed Commission Brokers
Discount Brokerage Market Segmentation By Geography
-
1. North America
- 1.1. United States
- 1.2. Canada
- 1.3. Mexico
- 1.4. Rest of North America
-
2. Europe
- 2.1. Germany
- 2.2. United Kingdom
- 2.3. France
- 2.4. Russia
- 2.5. Spain
- 2.6. Rest of Europe
-
3. Asia Pacific
- 3.1. India
- 3.2. China
- 3.3. Japan
- 3.4. Rest of Asia Pacific
-
4. South America
- 4.1. Brazil
- 4.2. Argentina
- 4.3. Rest of South America
-
5. Middle East
- 5.1. United Arab Emirates
- 5.2. Saudi Arabia
- 5.3. Rest of Middle East
Discount Brokerage Market Regional Market Share
Geographic Coverage of Discount Brokerage Market
Discount Brokerage Market REPORT HIGHLIGHTS
| Aspects | Details |
|---|---|
| Study Period | 2020-2034 |
| Base Year | 2025 |
| Estimated Year | 2026 |
| Forecast Period | 2026-2034 |
| Historical Period | 2020-2025 |
| Growth Rate | CAGR of 6.29% from 2020-2034 |
| Segmentation |
|
Table of Contents
- 1. Introduction
- 1.1. Research Scope
- 1.2. Market Segmentation
- 1.3. Research Objective
- 1.4. Definitions and Assumptions
- 2. Executive Summary
- 2.1. Market Snapshot
- 3. Market Dynamics
- 3.1. Market Drivers
- 3.2. Market Restrains
- 3.3. Market Trends
- 3.4. Market Opportunities
- 4. Market Factor Analysis
- 4.1. Porters Five Forces
- 4.1.1. Bargaining Power of Suppliers
- 4.1.2. Bargaining Power of Buyers
- 4.1.3. Threat of New Entrants
- 4.1.4. Threat of Substitutes
- 4.1.5. Competitive Rivalry
- 4.2. PESTEL analysis
- 4.3. BCG Analysis
- 4.3.1. Stars (High Growth, High Market Share)
- 4.3.2. Cash Cows (Low Growth, High Market Share)
- 4.3.3. Question Mark (High Growth, Low Market Share)
- 4.3.4. Dogs (Low Growth, Low Market Share)
- 4.4. Ansoff Matrix Analysis
- 4.5. Supply Chain Analysis
- 4.6. Regulatory Landscape
- 4.7. Current Market Potential and Opportunity Assessment (TAM–SAM–SOM Framework)
- 4.8. NRP Analyst Note
- 4.1. Porters Five Forces
- 5. Market Analysis, Insights and Forecast 2021-2033
- 5.1. Market Analysis, Insights and Forecast - by Mode
- 5.1.1. Online Discount Brokerage Service
- 5.1.2. Offline Discount Brokerage Service
- 5.2. Market Analysis, Insights and Forecast - by Application
- 5.2.1. Individual
- 5.2.2. Enterprise
- 5.2.3. Government Agencies
- 5.3. Market Analysis, Insights and Forecast - by Services
- 5.3.1. Order Execution and Advisory
- 5.3.2. Discretionary
- 5.3.3. Online Trading Platforms
- 5.3.4. Education and Investor Resources
- 5.4. Market Analysis, Insights and Forecast - by Commission
- 5.4.1. Commission-free Brokers
- 5.4.2. Fixed Commission Brokers
- 5.5. Market Analysis, Insights and Forecast - by Region
- 5.5.1. North America
- 5.5.2. Europe
- 5.5.3. Asia Pacific
- 5.5.4. South America
- 5.5.5. Middle East
- 5.1. Market Analysis, Insights and Forecast - by Mode
- 6. Global Discount Brokerage Market Analysis, Insights and Forecast, 2021-2033
- 6.1. Market Analysis, Insights and Forecast - by Mode
- 6.1.1. Online Discount Brokerage Service
- 6.1.2. Offline Discount Brokerage Service
- 6.2. Market Analysis, Insights and Forecast - by Application
- 6.2.1. Individual
- 6.2.2. Enterprise
- 6.2.3. Government Agencies
- 6.3. Market Analysis, Insights and Forecast - by Services
- 6.3.1. Order Execution and Advisory
- 6.3.2. Discretionary
- 6.3.3. Online Trading Platforms
- 6.3.4. Education and Investor Resources
- 6.4. Market Analysis, Insights and Forecast - by Commission
- 6.4.1. Commission-free Brokers
- 6.4.2. Fixed Commission Brokers
- 6.1. Market Analysis, Insights and Forecast - by Mode
- 7. North America Discount Brokerage Market Analysis, Insights and Forecast, 2020-2032
- 7.1. Market Analysis, Insights and Forecast - by Mode
- 7.1.1. Online Discount Brokerage Service
- 7.1.2. Offline Discount Brokerage Service
- 7.2. Market Analysis, Insights and Forecast - by Application
- 7.2.1. Individual
- 7.2.2. Enterprise
- 7.2.3. Government Agencies
- 7.3. Market Analysis, Insights and Forecast - by Services
- 7.3.1. Order Execution and Advisory
- 7.3.2. Discretionary
- 7.3.3. Online Trading Platforms
- 7.3.4. Education and Investor Resources
- 7.4. Market Analysis, Insights and Forecast - by Commission
- 7.4.1. Commission-free Brokers
- 7.4.2. Fixed Commission Brokers
- 7.1. Market Analysis, Insights and Forecast - by Mode
- 8. Europe Discount Brokerage Market Analysis, Insights and Forecast, 2020-2032
- 8.1. Market Analysis, Insights and Forecast - by Mode
- 8.1.1. Online Discount Brokerage Service
- 8.1.2. Offline Discount Brokerage Service
- 8.2. Market Analysis, Insights and Forecast - by Application
- 8.2.1. Individual
- 8.2.2. Enterprise
- 8.2.3. Government Agencies
- 8.3. Market Analysis, Insights and Forecast - by Services
- 8.3.1. Order Execution and Advisory
- 8.3.2. Discretionary
- 8.3.3. Online Trading Platforms
- 8.3.4. Education and Investor Resources
- 8.4. Market Analysis, Insights and Forecast - by Commission
- 8.4.1. Commission-free Brokers
- 8.4.2. Fixed Commission Brokers
- 8.1. Market Analysis, Insights and Forecast - by Mode
- 9. Asia Pacific Discount Brokerage Market Analysis, Insights and Forecast, 2020-2032
- 9.1. Market Analysis, Insights and Forecast - by Mode
- 9.1.1. Online Discount Brokerage Service
- 9.1.2. Offline Discount Brokerage Service
- 9.2. Market Analysis, Insights and Forecast - by Application
- 9.2.1. Individual
- 9.2.2. Enterprise
- 9.2.3. Government Agencies
- 9.3. Market Analysis, Insights and Forecast - by Services
- 9.3.1. Order Execution and Advisory
- 9.3.2. Discretionary
- 9.3.3. Online Trading Platforms
- 9.3.4. Education and Investor Resources
- 9.4. Market Analysis, Insights and Forecast - by Commission
- 9.4.1. Commission-free Brokers
- 9.4.2. Fixed Commission Brokers
- 9.1. Market Analysis, Insights and Forecast - by Mode
- 10. South America Discount Brokerage Market Analysis, Insights and Forecast, 2020-2032
- 10.1. Market Analysis, Insights and Forecast - by Mode
- 10.1.1. Online Discount Brokerage Service
- 10.1.2. Offline Discount Brokerage Service
- 10.2. Market Analysis, Insights and Forecast - by Application
- 10.2.1. Individual
- 10.2.2. Enterprise
- 10.2.3. Government Agencies
- 10.3. Market Analysis, Insights and Forecast - by Services
- 10.3.1. Order Execution and Advisory
- 10.3.2. Discretionary
- 10.3.3. Online Trading Platforms
- 10.3.4. Education and Investor Resources
- 10.4. Market Analysis, Insights and Forecast - by Commission
- 10.4.1. Commission-free Brokers
- 10.4.2. Fixed Commission Brokers
- 10.1. Market Analysis, Insights and Forecast - by Mode
- 11. Middle East Discount Brokerage Market Analysis, Insights and Forecast, 2020-2032
- 11.1. Market Analysis, Insights and Forecast - by Mode
- 11.1.1. Online Discount Brokerage Service
- 11.1.2. Offline Discount Brokerage Service
- 11.2. Market Analysis, Insights and Forecast - by Application
- 11.2.1. Individual
- 11.2.2. Enterprise
- 11.2.3. Government Agencies
- 11.3. Market Analysis, Insights and Forecast - by Services
- 11.3.1. Order Execution and Advisory
- 11.3.2. Discretionary
- 11.3.3. Online Trading Platforms
- 11.3.4. Education and Investor Resources
- 11.4. Market Analysis, Insights and Forecast - by Commission
- 11.4.1. Commission-free Brokers
- 11.4.2. Fixed Commission Brokers
- 11.1. Market Analysis, Insights and Forecast - by Mode
- 12. Competitive Analysis
- 12.1. Company Profiles
- 12.1.1 Interactive Brokers
- 12.1.1.1. Company Overview
- 12.1.1.2. Products
- 12.1.1.3. Company Financials
- 12.1.1.4. SWOT Analysis
- 12.1.2 TD Ameritrade
- 12.1.2.1. Company Overview
- 12.1.2.2. Products
- 12.1.2.3. Company Financials
- 12.1.2.4. SWOT Analysis
- 12.1.3 Charles Schwab
- 12.1.3.1. Company Overview
- 12.1.3.2. Products
- 12.1.3.3. Company Financials
- 12.1.3.4. SWOT Analysis
- 12.1.4 ETrade
- 12.1.4.1. Company Overview
- 12.1.4.2. Products
- 12.1.4.3. Company Financials
- 12.1.4.4. SWOT Analysis
- 12.1.5 Fidelity Investments
- 12.1.5.1. Company Overview
- 12.1.5.2. Products
- 12.1.5.3. Company Financials
- 12.1.5.4. SWOT Analysis
- 12.1.6 Robinhood
- 12.1.6.1. Company Overview
- 12.1.6.2. Products
- 12.1.6.3. Company Financials
- 12.1.6.4. SWOT Analysis
- 12.1.7 Vanguard
- 12.1.7.1. Company Overview
- 12.1.7.2. Products
- 12.1.7.3. Company Financials
- 12.1.7.4. SWOT Analysis
- 12.1.8 Ally Invest
- 12.1.8.1. Company Overview
- 12.1.8.2. Products
- 12.1.8.3. Company Financials
- 12.1.8.4. SWOT Analysis
- 12.1.9 Firstrade
- 12.1.9.1. Company Overview
- 12.1.9.2. Products
- 12.1.9.3. Company Financials
- 12.1.9.4. SWOT Analysis
- 12.1.10 DEGIRO**List Not Exhaustive
- 12.1.10.1. Company Overview
- 12.1.10.2. Products
- 12.1.10.3. Company Financials
- 12.1.10.4. SWOT Analysis
- 12.1.1 Interactive Brokers
- 12.2. Market Entropy
- 12.2.1 Company's Key Areas Served
- 12.2.2 Recent Developments
- 12.3. Company Market Share Analysis 2025
- 12.3.1 Top 5 Companies Market Share Analysis
- 12.3.2 Top 3 Companies Market Share Analysis
- 12.4. List of Potential Customers
- 13. Research Methodology
List of Figures
- Figure 1: Global Discount Brokerage Market Revenue Breakdown (Million, %) by Region 2025 & 2033
- Figure 2: Global Discount Brokerage Market Volume Breakdown (Billion, %) by Region 2025 & 2033
- Figure 3: North America Discount Brokerage Market Revenue (Million), by Mode 2025 & 2033
- Figure 4: North America Discount Brokerage Market Volume (Billion), by Mode 2025 & 2033
- Figure 5: North America Discount Brokerage Market Revenue Share (%), by Mode 2025 & 2033
- Figure 6: North America Discount Brokerage Market Volume Share (%), by Mode 2025 & 2033
- Figure 7: North America Discount Brokerage Market Revenue (Million), by Application 2025 & 2033
- Figure 8: North America Discount Brokerage Market Volume (Billion), by Application 2025 & 2033
- Figure 9: North America Discount Brokerage Market Revenue Share (%), by Application 2025 & 2033
- Figure 10: North America Discount Brokerage Market Volume Share (%), by Application 2025 & 2033
- Figure 11: North America Discount Brokerage Market Revenue (Million), by Services 2025 & 2033
- Figure 12: North America Discount Brokerage Market Volume (Billion), by Services 2025 & 2033
- Figure 13: North America Discount Brokerage Market Revenue Share (%), by Services 2025 & 2033
- Figure 14: North America Discount Brokerage Market Volume Share (%), by Services 2025 & 2033
- Figure 15: North America Discount Brokerage Market Revenue (Million), by Commission 2025 & 2033
- Figure 16: North America Discount Brokerage Market Volume (Billion), by Commission 2025 & 2033
- Figure 17: North America Discount Brokerage Market Revenue Share (%), by Commission 2025 & 2033
- Figure 18: North America Discount Brokerage Market Volume Share (%), by Commission 2025 & 2033
- Figure 19: North America Discount Brokerage Market Revenue (Million), by Country 2025 & 2033
- Figure 20: North America Discount Brokerage Market Volume (Billion), by Country 2025 & 2033
- Figure 21: North America Discount Brokerage Market Revenue Share (%), by Country 2025 & 2033
- Figure 22: North America Discount Brokerage Market Volume Share (%), by Country 2025 & 2033
- Figure 23: Europe Discount Brokerage Market Revenue (Million), by Mode 2025 & 2033
- Figure 24: Europe Discount Brokerage Market Volume (Billion), by Mode 2025 & 2033
- Figure 25: Europe Discount Brokerage Market Revenue Share (%), by Mode 2025 & 2033
- Figure 26: Europe Discount Brokerage Market Volume Share (%), by Mode 2025 & 2033
- Figure 27: Europe Discount Brokerage Market Revenue (Million), by Application 2025 & 2033
- Figure 28: Europe Discount Brokerage Market Volume (Billion), by Application 2025 & 2033
- Figure 29: Europe Discount Brokerage Market Revenue Share (%), by Application 2025 & 2033
- Figure 30: Europe Discount Brokerage Market Volume Share (%), by Application 2025 & 2033
- Figure 31: Europe Discount Brokerage Market Revenue (Million), by Services 2025 & 2033
- Figure 32: Europe Discount Brokerage Market Volume (Billion), by Services 2025 & 2033
- Figure 33: Europe Discount Brokerage Market Revenue Share (%), by Services 2025 & 2033
- Figure 34: Europe Discount Brokerage Market Volume Share (%), by Services 2025 & 2033
- Figure 35: Europe Discount Brokerage Market Revenue (Million), by Commission 2025 & 2033
- Figure 36: Europe Discount Brokerage Market Volume (Billion), by Commission 2025 & 2033
- Figure 37: Europe Discount Brokerage Market Revenue Share (%), by Commission 2025 & 2033
- Figure 38: Europe Discount Brokerage Market Volume Share (%), by Commission 2025 & 2033
- Figure 39: Europe Discount Brokerage Market Revenue (Million), by Country 2025 & 2033
- Figure 40: Europe Discount Brokerage Market Volume (Billion), by Country 2025 & 2033
- Figure 41: Europe Discount Brokerage Market Revenue Share (%), by Country 2025 & 2033
- Figure 42: Europe Discount Brokerage Market Volume Share (%), by Country 2025 & 2033
- Figure 43: Asia Pacific Discount Brokerage Market Revenue (Million), by Mode 2025 & 2033
- Figure 44: Asia Pacific Discount Brokerage Market Volume (Billion), by Mode 2025 & 2033
- Figure 45: Asia Pacific Discount Brokerage Market Revenue Share (%), by Mode 2025 & 2033
- Figure 46: Asia Pacific Discount Brokerage Market Volume Share (%), by Mode 2025 & 2033
- Figure 47: Asia Pacific Discount Brokerage Market Revenue (Million), by Application 2025 & 2033
- Figure 48: Asia Pacific Discount Brokerage Market Volume (Billion), by Application 2025 & 2033
- Figure 49: Asia Pacific Discount Brokerage Market Revenue Share (%), by Application 2025 & 2033
- Figure 50: Asia Pacific Discount Brokerage Market Volume Share (%), by Application 2025 & 2033
- Figure 51: Asia Pacific Discount Brokerage Market Revenue (Million), by Services 2025 & 2033
- Figure 52: Asia Pacific Discount Brokerage Market Volume (Billion), by Services 2025 & 2033
- Figure 53: Asia Pacific Discount Brokerage Market Revenue Share (%), by Services 2025 & 2033
- Figure 54: Asia Pacific Discount Brokerage Market Volume Share (%), by Services 2025 & 2033
- Figure 55: Asia Pacific Discount Brokerage Market Revenue (Million), by Commission 2025 & 2033
- Figure 56: Asia Pacific Discount Brokerage Market Volume (Billion), by Commission 2025 & 2033
- Figure 57: Asia Pacific Discount Brokerage Market Revenue Share (%), by Commission 2025 & 2033
- Figure 58: Asia Pacific Discount Brokerage Market Volume Share (%), by Commission 2025 & 2033
- Figure 59: Asia Pacific Discount Brokerage Market Revenue (Million), by Country 2025 & 2033
- Figure 60: Asia Pacific Discount Brokerage Market Volume (Billion), by Country 2025 & 2033
- Figure 61: Asia Pacific Discount Brokerage Market Revenue Share (%), by Country 2025 & 2033
- Figure 62: Asia Pacific Discount Brokerage Market Volume Share (%), by Country 2025 & 2033
- Figure 63: South America Discount Brokerage Market Revenue (Million), by Mode 2025 & 2033
- Figure 64: South America Discount Brokerage Market Volume (Billion), by Mode 2025 & 2033
- Figure 65: South America Discount Brokerage Market Revenue Share (%), by Mode 2025 & 2033
- Figure 66: South America Discount Brokerage Market Volume Share (%), by Mode 2025 & 2033
- Figure 67: South America Discount Brokerage Market Revenue (Million), by Application 2025 & 2033
- Figure 68: South America Discount Brokerage Market Volume (Billion), by Application 2025 & 2033
- Figure 69: South America Discount Brokerage Market Revenue Share (%), by Application 2025 & 2033
- Figure 70: South America Discount Brokerage Market Volume Share (%), by Application 2025 & 2033
- Figure 71: South America Discount Brokerage Market Revenue (Million), by Services 2025 & 2033
- Figure 72: South America Discount Brokerage Market Volume (Billion), by Services 2025 & 2033
- Figure 73: South America Discount Brokerage Market Revenue Share (%), by Services 2025 & 2033
- Figure 74: South America Discount Brokerage Market Volume Share (%), by Services 2025 & 2033
- Figure 75: South America Discount Brokerage Market Revenue (Million), by Commission 2025 & 2033
- Figure 76: South America Discount Brokerage Market Volume (Billion), by Commission 2025 & 2033
- Figure 77: South America Discount Brokerage Market Revenue Share (%), by Commission 2025 & 2033
- Figure 78: South America Discount Brokerage Market Volume Share (%), by Commission 2025 & 2033
- Figure 79: South America Discount Brokerage Market Revenue (Million), by Country 2025 & 2033
- Figure 80: South America Discount Brokerage Market Volume (Billion), by Country 2025 & 2033
- Figure 81: South America Discount Brokerage Market Revenue Share (%), by Country 2025 & 2033
- Figure 82: South America Discount Brokerage Market Volume Share (%), by Country 2025 & 2033
- Figure 83: Middle East Discount Brokerage Market Revenue (Million), by Mode 2025 & 2033
- Figure 84: Middle East Discount Brokerage Market Volume (Billion), by Mode 2025 & 2033
- Figure 85: Middle East Discount Brokerage Market Revenue Share (%), by Mode 2025 & 2033
- Figure 86: Middle East Discount Brokerage Market Volume Share (%), by Mode 2025 & 2033
- Figure 87: Middle East Discount Brokerage Market Revenue (Million), by Application 2025 & 2033
- Figure 88: Middle East Discount Brokerage Market Volume (Billion), by Application 2025 & 2033
- Figure 89: Middle East Discount Brokerage Market Revenue Share (%), by Application 2025 & 2033
- Figure 90: Middle East Discount Brokerage Market Volume Share (%), by Application 2025 & 2033
- Figure 91: Middle East Discount Brokerage Market Revenue (Million), by Services 2025 & 2033
- Figure 92: Middle East Discount Brokerage Market Volume (Billion), by Services 2025 & 2033
- Figure 93: Middle East Discount Brokerage Market Revenue Share (%), by Services 2025 & 2033
- Figure 94: Middle East Discount Brokerage Market Volume Share (%), by Services 2025 & 2033
- Figure 95: Middle East Discount Brokerage Market Revenue (Million), by Commission 2025 & 2033
- Figure 96: Middle East Discount Brokerage Market Volume (Billion), by Commission 2025 & 2033
- Figure 97: Middle East Discount Brokerage Market Revenue Share (%), by Commission 2025 & 2033
- Figure 98: Middle East Discount Brokerage Market Volume Share (%), by Commission 2025 & 2033
- Figure 99: Middle East Discount Brokerage Market Revenue (Million), by Country 2025 & 2033
- Figure 100: Middle East Discount Brokerage Market Volume (Billion), by Country 2025 & 2033
- Figure 101: Middle East Discount Brokerage Market Revenue Share (%), by Country 2025 & 2033
- Figure 102: Middle East Discount Brokerage Market Volume Share (%), by Country 2025 & 2033
List of Tables
- Table 1: Global Discount Brokerage Market Revenue Million Forecast, by Mode 2020 & 2033
- Table 2: Global Discount Brokerage Market Volume Billion Forecast, by Mode 2020 & 2033
- Table 3: Global Discount Brokerage Market Revenue Million Forecast, by Application 2020 & 2033
- Table 4: Global Discount Brokerage Market Volume Billion Forecast, by Application 2020 & 2033
- Table 5: Global Discount Brokerage Market Revenue Million Forecast, by Services 2020 & 2033
- Table 6: Global Discount Brokerage Market Volume Billion Forecast, by Services 2020 & 2033
- Table 7: Global Discount Brokerage Market Revenue Million Forecast, by Commission 2020 & 2033
- Table 8: Global Discount Brokerage Market Volume Billion Forecast, by Commission 2020 & 2033
- Table 9: Global Discount Brokerage Market Revenue Million Forecast, by Region 2020 & 2033
- Table 10: Global Discount Brokerage Market Volume Billion Forecast, by Region 2020 & 2033
- Table 11: Global Discount Brokerage Market Revenue Million Forecast, by Mode 2020 & 2033
- Table 12: Global Discount Brokerage Market Volume Billion Forecast, by Mode 2020 & 2033
- Table 13: Global Discount Brokerage Market Revenue Million Forecast, by Application 2020 & 2033
- Table 14: Global Discount Brokerage Market Volume Billion Forecast, by Application 2020 & 2033
- Table 15: Global Discount Brokerage Market Revenue Million Forecast, by Services 2020 & 2033
- Table 16: Global Discount Brokerage Market Volume Billion Forecast, by Services 2020 & 2033
- Table 17: Global Discount Brokerage Market Revenue Million Forecast, by Commission 2020 & 2033
- Table 18: Global Discount Brokerage Market Volume Billion Forecast, by Commission 2020 & 2033
- Table 19: Global Discount Brokerage Market Revenue Million Forecast, by Country 2020 & 2033
- Table 20: Global Discount Brokerage Market Volume Billion Forecast, by Country 2020 & 2033
- Table 21: United States Discount Brokerage Market Revenue (Million) Forecast, by Application 2020 & 2033
- Table 22: United States Discount Brokerage Market Volume (Billion) Forecast, by Application 2020 & 2033
- Table 23: Canada Discount Brokerage Market Revenue (Million) Forecast, by Application 2020 & 2033
- Table 24: Canada Discount Brokerage Market Volume (Billion) Forecast, by Application 2020 & 2033
- Table 25: Mexico Discount Brokerage Market Revenue (Million) Forecast, by Application 2020 & 2033
- Table 26: Mexico Discount Brokerage Market Volume (Billion) Forecast, by Application 2020 & 2033
- Table 27: Rest of North America Discount Brokerage Market Revenue (Million) Forecast, by Application 2020 & 2033
- Table 28: Rest of North America Discount Brokerage Market Volume (Billion) Forecast, by Application 2020 & 2033
- Table 29: Global Discount Brokerage Market Revenue Million Forecast, by Mode 2020 & 2033
- Table 30: Global Discount Brokerage Market Volume Billion Forecast, by Mode 2020 & 2033
- Table 31: Global Discount Brokerage Market Revenue Million Forecast, by Application 2020 & 2033
- Table 32: Global Discount Brokerage Market Volume Billion Forecast, by Application 2020 & 2033
- Table 33: Global Discount Brokerage Market Revenue Million Forecast, by Services 2020 & 2033
- Table 34: Global Discount Brokerage Market Volume Billion Forecast, by Services 2020 & 2033
- Table 35: Global Discount Brokerage Market Revenue Million Forecast, by Commission 2020 & 2033
- Table 36: Global Discount Brokerage Market Volume Billion Forecast, by Commission 2020 & 2033
- Table 37: Global Discount Brokerage Market Revenue Million Forecast, by Country 2020 & 2033
- Table 38: Global Discount Brokerage Market Volume Billion Forecast, by Country 2020 & 2033
- Table 39: Germany Discount Brokerage Market Revenue (Million) Forecast, by Application 2020 & 2033
- Table 40: Germany Discount Brokerage Market Volume (Billion) Forecast, by Application 2020 & 2033
- Table 41: United Kingdom Discount Brokerage Market Revenue (Million) Forecast, by Application 2020 & 2033
- Table 42: United Kingdom Discount Brokerage Market Volume (Billion) Forecast, by Application 2020 & 2033
- Table 43: France Discount Brokerage Market Revenue (Million) Forecast, by Application 2020 & 2033
- Table 44: France Discount Brokerage Market Volume (Billion) Forecast, by Application 2020 & 2033
- Table 45: Russia Discount Brokerage Market Revenue (Million) Forecast, by Application 2020 & 2033
- Table 46: Russia Discount Brokerage Market Volume (Billion) Forecast, by Application 2020 & 2033
- Table 47: Spain Discount Brokerage Market Revenue (Million) Forecast, by Application 2020 & 2033
- Table 48: Spain Discount Brokerage Market Volume (Billion) Forecast, by Application 2020 & 2033
- Table 49: Rest of Europe Discount Brokerage Market Revenue (Million) Forecast, by Application 2020 & 2033
- Table 50: Rest of Europe Discount Brokerage Market Volume (Billion) Forecast, by Application 2020 & 2033
- Table 51: Global Discount Brokerage Market Revenue Million Forecast, by Mode 2020 & 2033
- Table 52: Global Discount Brokerage Market Volume Billion Forecast, by Mode 2020 & 2033
- Table 53: Global Discount Brokerage Market Revenue Million Forecast, by Application 2020 & 2033
- Table 54: Global Discount Brokerage Market Volume Billion Forecast, by Application 2020 & 2033
- Table 55: Global Discount Brokerage Market Revenue Million Forecast, by Services 2020 & 2033
- Table 56: Global Discount Brokerage Market Volume Billion Forecast, by Services 2020 & 2033
- Table 57: Global Discount Brokerage Market Revenue Million Forecast, by Commission 2020 & 2033
- Table 58: Global Discount Brokerage Market Volume Billion Forecast, by Commission 2020 & 2033
- Table 59: Global Discount Brokerage Market Revenue Million Forecast, by Country 2020 & 2033
- Table 60: Global Discount Brokerage Market Volume Billion Forecast, by Country 2020 & 2033
- Table 61: India Discount Brokerage Market Revenue (Million) Forecast, by Application 2020 & 2033
- Table 62: India Discount Brokerage Market Volume (Billion) Forecast, by Application 2020 & 2033
- Table 63: China Discount Brokerage Market Revenue (Million) Forecast, by Application 2020 & 2033
- Table 64: China Discount Brokerage Market Volume (Billion) Forecast, by Application 2020 & 2033
- Table 65: Japan Discount Brokerage Market Revenue (Million) Forecast, by Application 2020 & 2033
- Table 66: Japan Discount Brokerage Market Volume (Billion) Forecast, by Application 2020 & 2033
- Table 67: Rest of Asia Pacific Discount Brokerage Market Revenue (Million) Forecast, by Application 2020 & 2033
- Table 68: Rest of Asia Pacific Discount Brokerage Market Volume (Billion) Forecast, by Application 2020 & 2033
- Table 69: Global Discount Brokerage Market Revenue Million Forecast, by Mode 2020 & 2033
- Table 70: Global Discount Brokerage Market Volume Billion Forecast, by Mode 2020 & 2033
- Table 71: Global Discount Brokerage Market Revenue Million Forecast, by Application 2020 & 2033
- Table 72: Global Discount Brokerage Market Volume Billion Forecast, by Application 2020 & 2033
- Table 73: Global Discount Brokerage Market Revenue Million Forecast, by Services 2020 & 2033
- Table 74: Global Discount Brokerage Market Volume Billion Forecast, by Services 2020 & 2033
- Table 75: Global Discount Brokerage Market Revenue Million Forecast, by Commission 2020 & 2033
- Table 76: Global Discount Brokerage Market Volume Billion Forecast, by Commission 2020 & 2033
- Table 77: Global Discount Brokerage Market Revenue Million Forecast, by Country 2020 & 2033
- Table 78: Global Discount Brokerage Market Volume Billion Forecast, by Country 2020 & 2033
- Table 79: Brazil Discount Brokerage Market Revenue (Million) Forecast, by Application 2020 & 2033
- Table 80: Brazil Discount Brokerage Market Volume (Billion) Forecast, by Application 2020 & 2033
- Table 81: Argentina Discount Brokerage Market Revenue (Million) Forecast, by Application 2020 & 2033
- Table 82: Argentina Discount Brokerage Market Volume (Billion) Forecast, by Application 2020 & 2033
- Table 83: Rest of South America Discount Brokerage Market Revenue (Million) Forecast, by Application 2020 & 2033
- Table 84: Rest of South America Discount Brokerage Market Volume (Billion) Forecast, by Application 2020 & 2033
- Table 85: Global Discount Brokerage Market Revenue Million Forecast, by Mode 2020 & 2033
- Table 86: Global Discount Brokerage Market Volume Billion Forecast, by Mode 2020 & 2033
- Table 87: Global Discount Brokerage Market Revenue Million Forecast, by Application 2020 & 2033
- Table 88: Global Discount Brokerage Market Volume Billion Forecast, by Application 2020 & 2033
- Table 89: Global Discount Brokerage Market Revenue Million Forecast, by Services 2020 & 2033
- Table 90: Global Discount Brokerage Market Volume Billion Forecast, by Services 2020 & 2033
- Table 91: Global Discount Brokerage Market Revenue Million Forecast, by Commission 2020 & 2033
- Table 92: Global Discount Brokerage Market Volume Billion Forecast, by Commission 2020 & 2033
- Table 93: Global Discount Brokerage Market Revenue Million Forecast, by Country 2020 & 2033
- Table 94: Global Discount Brokerage Market Volume Billion Forecast, by Country 2020 & 2033
- Table 95: United Arab Emirates Discount Brokerage Market Revenue (Million) Forecast, by Application 2020 & 2033
- Table 96: United Arab Emirates Discount Brokerage Market Volume (Billion) Forecast, by Application 2020 & 2033
- Table 97: Saudi Arabia Discount Brokerage Market Revenue (Million) Forecast, by Application 2020 & 2033
- Table 98: Saudi Arabia Discount Brokerage Market Volume (Billion) Forecast, by Application 2020 & 2033
- Table 99: Rest of Middle East Discount Brokerage Market Revenue (Million) Forecast, by Application 2020 & 2033
- Table 100: Rest of Middle East Discount Brokerage Market Volume (Billion) Forecast, by Application 2020 & 2033
Frequently Asked Questions
1. What is the projected Compound Annual Growth Rate (CAGR) of the Discount Brokerage Market?
The projected CAGR is approximately 6.29%.
2. Which companies are prominent players in the Discount Brokerage Market?
Key companies in the market include Interactive Brokers, TD Ameritrade, Charles Schwab, ETrade, Fidelity Investments, Robinhood, Vanguard, Ally Invest, Firstrade, DEGIRO**List Not Exhaustive.
3. What are the main segments of the Discount Brokerage Market?
The market segments include Mode, Application, Services , Commission.
4. Can you provide details about the market size?
The market size is estimated to be USD 24.24 Million as of 2022.
5. What are some drivers contributing to market growth?
Low-cost Trading Fee is Driving the Market; Increasing Popularity of Self-directed Investing.
6. What are the notable trends driving market growth?
Increase in Enterprise Market is Fuelling the Market.
7. Are there any restraints impacting market growth?
Low-cost Trading Fee is Driving the Market; Increasing Popularity of Self-directed Investing.
8. Can you provide examples of recent developments in the market?
September 2023: HDFC Securities launched the discount brokerage platform Sky. Through a single fintech platform, the app provides users with a wide range of trading and investment possibilities, including global equities, IPOs, Indian stocks, ETFs, mutual funds, futures and options, currencies, and commodities.
9. What pricing options are available for accessing the report?
Pricing options include single-user, multi-user, and enterprise licenses priced at USD 4750, USD 5250, and USD 8750 respectively.
10. Is the market size provided in terms of value or volume?
The market size is provided in terms of value, measured in Million and volume, measured in Billion.
11. Are there any specific market keywords associated with the report?
Yes, the market keyword associated with the report is "Discount Brokerage Market," which aids in identifying and referencing the specific market segment covered.
12. How do I determine which pricing option suits my needs best?
The pricing options vary based on user requirements and access needs. Individual users may opt for single-user licenses, while businesses requiring broader access may choose multi-user or enterprise licenses for cost-effective access to the report.
13. Are there any additional resources or data provided in the Discount Brokerage Market report?
While the report offers comprehensive insights, it's advisable to review the specific contents or supplementary materials provided to ascertain if additional resources or data are available.
14. How can I stay updated on further developments or reports in the Discount Brokerage Market?
To stay informed about further developments, trends, and reports in the Discount Brokerage Market, consider subscribing to industry newsletters, following relevant companies and organizations, or regularly checking reputable industry news sources and publications.
Methodology
Step 1 - Identification of Relevant Samples Size from Population Database


Step 2 - Approaches for Defining Global Market Size (Value, Volume* & Price*)

Note*: In applicable scenarios
Step 3 - Data Sources
Primary Research
- Web Analytics
- Survey Reports
- Research Institute
- Latest Research Reports
- Opinion Leaders
Secondary Research
- Annual Reports
- White Paper
- Latest Press Release
- Industry Association
- Paid Database
- Investor Presentations

Step 4 - Data Triangulation
Involves using different sources of information in order to increase the validity of a study
These sources are likely to be stakeholders in a program - participants, other researchers, program staff, other community members, and so on.
Then we put all data in single framework & apply various statistical tools to find out the dynamic on the market.
During the analysis stage, feedback from the stakeholder groups would be compared to determine areas of agreement as well as areas of divergence