

Key Insights
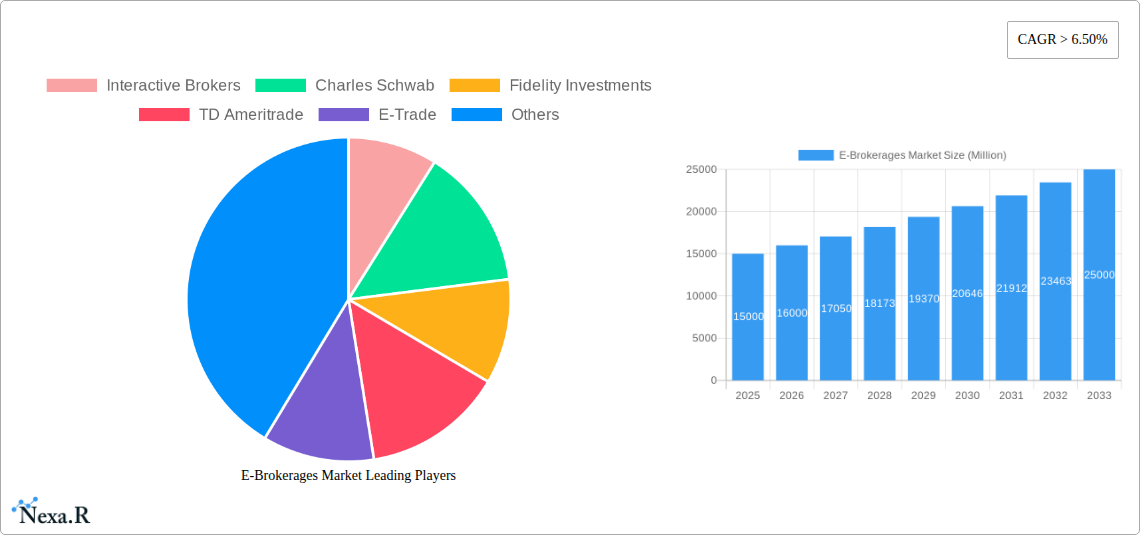
The global e-brokerage market is experiencing robust growth, driven by the increasing adoption of online trading platforms and the expanding reach of the internet, particularly among millennial and Gen Z investors. The market's compound annual growth rate (CAGR) exceeding 6.50% from 2019-2033 indicates a significant upward trajectory. Several factors contribute to this expansion. The rise of mobile trading apps, offering seamless access to investment opportunities anytime, anywhere, is a major catalyst. Furthermore, the increasing availability of sophisticated trading tools and educational resources on online platforms empowers individual investors to actively participate in the market. The diversification of investment products beyond traditional stocks and bonds, including options, futures, and cryptocurrencies, further fuels market growth. While regulatory changes and cybersecurity concerns present potential restraints, the overall market outlook remains positive. Leading players like Interactive Brokers, Charles Schwab, and Fidelity Investments are continuously innovating to enhance their platforms and attract new customers, driving competition and innovation within the sector. The market is segmented by various factors such as platform type (web-based, mobile), investor type (individual, institutional), and geographic location. Given the projected CAGR, we can anticipate continued consolidation and expansion among existing players and the emergence of new innovative platforms.
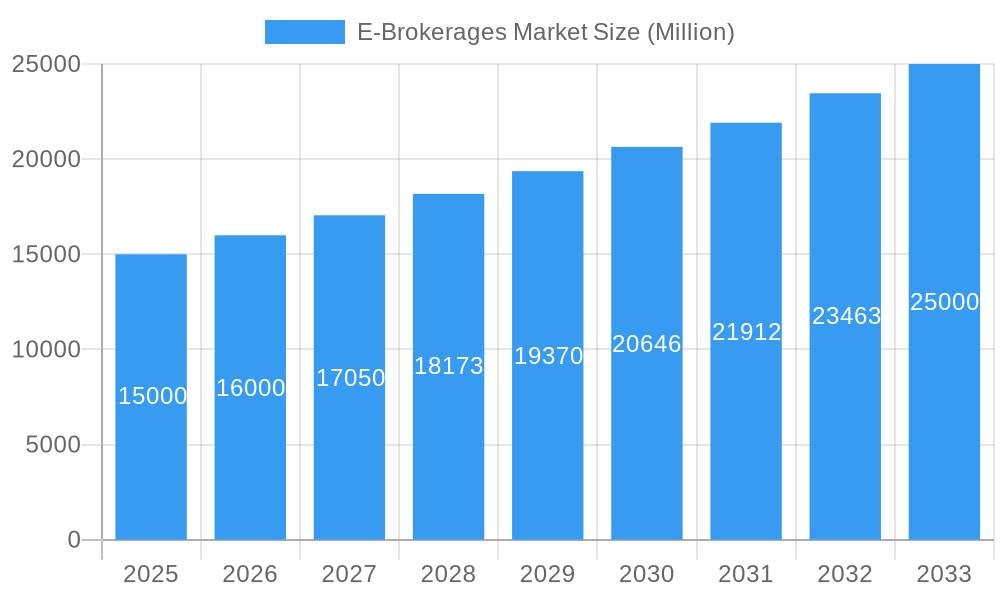
E-Brokerages Market Market Size (In Billion)
The competitive landscape is characterized by both established giants and emerging fintech companies. Established players leverage their brand reputation and extensive client bases, while newer entrants focus on niche offerings and cutting-edge technology. This competitive dynamic fosters continuous improvement in terms of user experience, technological advancements, and pricing strategies, ultimately benefiting investors. Regional variations in market penetration exist, with developed economies exhibiting higher adoption rates. However, developing markets show significant growth potential as internet penetration and financial literacy increase. The long-term outlook for the e-brokerage market remains optimistic, driven by technological advancements, shifting investor demographics, and the ongoing globalization of financial markets. We expect continued growth and innovation across diverse segments, making e-brokerage a dynamic and exciting area of the financial industry.
E-Brokerages Market Company Market Share
E-Brokerages Market: A Comprehensive Market Report (2019-2033)
This comprehensive report provides an in-depth analysis of the E-Brokerages Market, encompassing market dynamics, growth trends, regional analysis, product landscape, key players, and future outlook. The study period spans from 2019 to 2033, with 2025 serving as the base and estimated year. The forecast period is 2025-2033, and the historical period covers 2019-2024. This report is crucial for investors, industry professionals, and market researchers seeking to understand and capitalize on opportunities within this dynamic sector. The parent market is the broader financial services industry, while the child market is online trading platforms.
E-Brokerages Market Dynamics & Structure
The E-Brokerages market is characterized by high competition, rapid technological innovation, and evolving regulatory landscapes. Market concentration is moderate, with a few dominant players alongside numerous smaller firms. The market size in 2025 is estimated at $XX million.
- Market Concentration: The top 5 players (Interactive Brokers, Charles Schwab, Fidelity Investments, TD Ameritrade, E-Trade) hold approximately XX% of the market share in 2025.
- Technological Innovation: AI-powered trading tools, algorithmic trading platforms, and enhanced mobile applications are key drivers of innovation, impacting trading strategies and user experience. However, high development costs present a significant barrier to entry for smaller players.
- Regulatory Frameworks: Stringent regulations regarding data security, KYC/AML compliance, and investor protection significantly influence market operations and the cost of compliance.
- Competitive Product Substitutes: Traditional brokerage firms and alternative investment platforms pose competition, although the convenience and accessibility of e-brokerages remain a significant advantage.
- End-User Demographics: The market caters to a broad demographic, including retail investors, institutional investors, and high-net-worth individuals. Growing adoption among millennials and Gen Z fuels market growth.
- M&A Trends: The market has witnessed several M&A activities in recent years, driven by companies seeking to expand their market share, product offerings, and technological capabilities. The total M&A deal volume between 2019 and 2024 was approximately $XX million.
E-Brokerages Market Growth Trends & Insights
The E-Brokerages market has exhibited strong growth over the past few years, driven by increasing internet and smartphone penetration, rising retail investor participation, and the development of sophisticated trading platforms. The market size is projected to reach $XX million by 2033, exhibiting a CAGR of XX% during the forecast period.
The increasing adoption of mobile trading apps and the integration of AI-driven functionalities are transforming the consumer experience. Retail investors' shift towards online trading platforms is further accelerating market growth. Technological disruptions, such as the introduction of blockchain technology and decentralized finance (DeFi) platforms, present both opportunities and challenges for established players. Consumer behaviour is evolving, with a stronger preference for user-friendly interfaces, personalized investment advice, and commission-free trading options. Market penetration is increasing steadily, especially in emerging markets.
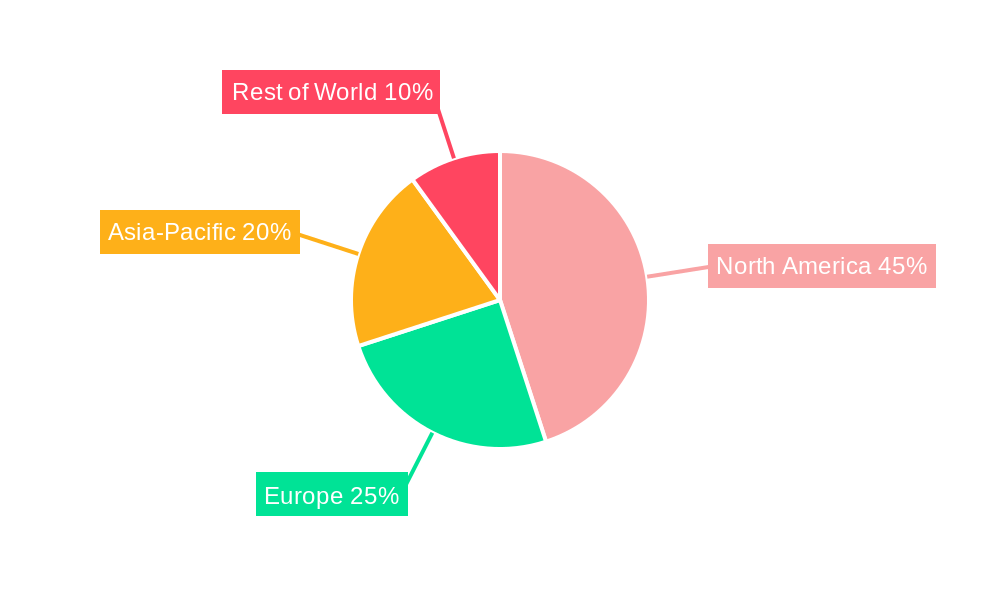
Dominant Regions, Countries, or Segments in E-Brokerages Market
North America currently dominates the E-Brokerages market, driven by high internet penetration, a mature financial infrastructure, and a large pool of active retail investors. However, Asia-Pacific is expected to witness significant growth in the coming years due to rising disposable incomes and increasing financial literacy.
- North America: Strong regulatory framework, high technological advancement, and significant retail investor participation contribute to market dominance.
- Europe: Stringent regulations and a fragmented market landscape present challenges but also foster innovation.
- Asia-Pacific: Rapid economic growth, increasing smartphone penetration, and a burgeoning middle class drive market expansion.
- Other Regions: Emerging markets in Latin America, Africa, and the Middle East present untapped growth opportunities.
E-Brokerages Market Product Landscape
The E-Brokerages market offers a diverse range of products, including online trading platforms, mobile apps, algorithmic trading tools, and financial planning software. Key features include advanced charting tools, real-time market data, educational resources, and personalized investment recommendations. Recent innovations focus on improving user experience, enhancing security, and integrating artificial intelligence for personalized portfolio management. Competition centers around offering superior trading tools, reduced commission fees, and exceptional customer service.
Key Drivers, Barriers & Challenges in E-Brokerages Market
Key Drivers:
- Increased internet and mobile penetration
- Rising retail investor participation
- Technological advancements (AI, blockchain)
- Growing demand for commission-free trading
Challenges & Restraints:
- Stringent regulatory compliance costs
- Cybersecurity risks and data breaches
- Competition from traditional brokerages and Fintech startups
- Fluctuations in global financial markets
Emerging Opportunities in E-Brokerages Market
- Expansion into underserved markets (e.g., emerging economies)
- Integration of blockchain technology and cryptocurrencies
- Development of AI-powered robo-advisors
- Personalized financial planning and wealth management solutions
Growth Accelerators in the E-Brokerages Market Industry
Strategic partnerships, such as the one between Interactive Brokers and TradingView, are significant growth accelerators. Technological breakthroughs in AI and machine learning are also key catalysts, enabling more efficient and personalized trading experiences. Expansion into new geographic markets and the development of innovative product offerings, such as fractional share trading, further fuel market expansion.
Key Players Shaping the E-Brokerages Market Market
- Interactive Brokers
- Charles Schwab
- Fidelity Investments
- TD Ameritrade
- E-Trade
- TastyWorks
- Etoro
- X-Trade Brokers
- IC Markets
- Eoption
- First Prudential Markets
Notable Milestones in E-Brokerages Market Sector
- May 2022: Interactive Brokers partnered with TradingView, enhancing client trading capabilities.
- May 2022: Fidelity International partnered with Conquest, expanding its financial planning software distribution.
- August 2022: eToro acquired Gatsby for USD 50 million, strengthening its market position.
In-Depth E-Brokerages Market Market Outlook
The E-Brokerages market is poised for continued growth, driven by technological advancements, evolving consumer preferences, and expansion into new markets. Strategic partnerships, innovative product offerings, and effective risk management will be crucial for success in this competitive landscape. The market's future potential is significant, particularly in emerging economies and among younger demographics increasingly engaging with digital financial services.
E-Brokerages Market Segmentation
-
1. Client
- 1.1. Retailers
- 1.2. Institutional
-
2. Services Provided
- 2.1. Full Time Brokers
- 2.2. Discounted Brokers
-
3. Ownership
- 3.1. Privately Held
- 3.2. Publicly Held
E-Brokerages Market Segmentation By Geography
- 1. North America
- 2. Europe
- 3. Asia Pacific
- 4. South America
- 5. Middle East and Africa
E-Brokerages Market Regional Market Share
Geographic Coverage of E-Brokerages Market
E-Brokerages Market REPORT HIGHLIGHTS
| Aspects | Details |
|---|---|
| Study Period | 2020-2034 |
| Base Year | 2025 |
| Estimated Year | 2026 |
| Forecast Period | 2026-2034 |
| Historical Period | 2020-2025 |
| Growth Rate | CAGR of > 6.50% from 2020-2034 |
| Segmentation |
|
Table of Contents
- 1. Introduction
- 1.1. Research Scope
- 1.2. Market Segmentation
- 1.3. Research Objective
- 1.4. Definitions and Assumptions
- 2. Executive Summary
- 2.1. Market Snapshot
- 3. Market Dynamics
- 3.1. Market Drivers
- 3.2. Market Restrains
- 3.3. Market Trends
- 3.4. Market Opportunities
- 4. Market Factor Analysis
- 4.1. Porters Five Forces
- 4.1.1. Bargaining Power of Suppliers
- 4.1.2. Bargaining Power of Buyers
- 4.1.3. Threat of New Entrants
- 4.1.4. Threat of Substitutes
- 4.1.5. Competitive Rivalry
- 4.2. PESTEL analysis
- 4.3. BCG Analysis
- 4.3.1. Stars (High Growth, High Market Share)
- 4.3.2. Cash Cows (Low Growth, High Market Share)
- 4.3.3. Question Mark (High Growth, Low Market Share)
- 4.3.4. Dogs (Low Growth, Low Market Share)
- 4.4. Ansoff Matrix Analysis
- 4.5. Supply Chain Analysis
- 4.6. Regulatory Landscape
- 4.7. Current Market Potential and Opportunity Assessment (TAM–SAM–SOM Framework)
- 4.8. NRP Analyst Note
- 4.1. Porters Five Forces
- 5. Market Analysis, Insights and Forecast 2021-2033
- 5.1. Market Analysis, Insights and Forecast - by Client
- 5.1.1. Retailers
- 5.1.2. Institutional
- 5.2. Market Analysis, Insights and Forecast - by Services Provided
- 5.2.1. Full Time Brokers
- 5.2.2. Discounted Brokers
- 5.3. Market Analysis, Insights and Forecast - by Ownership
- 5.3.1. Privately Held
- 5.3.2. Publicly Held
- 5.4. Market Analysis, Insights and Forecast - by Region
- 5.4.1. North America
- 5.4.2. Europe
- 5.4.3. Asia Pacific
- 5.4.4. South America
- 5.4.5. Middle East and Africa
- 5.1. Market Analysis, Insights and Forecast - by Client
- 6. Global E-Brokerages Market Analysis, Insights and Forecast, 2021-2033
- 6.1. Market Analysis, Insights and Forecast - by Client
- 6.1.1. Retailers
- 6.1.2. Institutional
- 6.2. Market Analysis, Insights and Forecast - by Services Provided
- 6.2.1. Full Time Brokers
- 6.2.2. Discounted Brokers
- 6.3. Market Analysis, Insights and Forecast - by Ownership
- 6.3.1. Privately Held
- 6.3.2. Publicly Held
- 6.1. Market Analysis, Insights and Forecast - by Client
- 7. North America E-Brokerages Market Analysis, Insights and Forecast, 2020-2032
- 7.1. Market Analysis, Insights and Forecast - by Client
- 7.1.1. Retailers
- 7.1.2. Institutional
- 7.2. Market Analysis, Insights and Forecast - by Services Provided
- 7.2.1. Full Time Brokers
- 7.2.2. Discounted Brokers
- 7.3. Market Analysis, Insights and Forecast - by Ownership
- 7.3.1. Privately Held
- 7.3.2. Publicly Held
- 7.1. Market Analysis, Insights and Forecast - by Client
- 8. Europe E-Brokerages Market Analysis, Insights and Forecast, 2020-2032
- 8.1. Market Analysis, Insights and Forecast - by Client
- 8.1.1. Retailers
- 8.1.2. Institutional
- 8.2. Market Analysis, Insights and Forecast - by Services Provided
- 8.2.1. Full Time Brokers
- 8.2.2. Discounted Brokers
- 8.3. Market Analysis, Insights and Forecast - by Ownership
- 8.3.1. Privately Held
- 8.3.2. Publicly Held
- 8.1. Market Analysis, Insights and Forecast - by Client
- 9. Asia Pacific E-Brokerages Market Analysis, Insights and Forecast, 2020-2032
- 9.1. Market Analysis, Insights and Forecast - by Client
- 9.1.1. Retailers
- 9.1.2. Institutional
- 9.2. Market Analysis, Insights and Forecast - by Services Provided
- 9.2.1. Full Time Brokers
- 9.2.2. Discounted Brokers
- 9.3. Market Analysis, Insights and Forecast - by Ownership
- 9.3.1. Privately Held
- 9.3.2. Publicly Held
- 9.1. Market Analysis, Insights and Forecast - by Client
- 10. South America E-Brokerages Market Analysis, Insights and Forecast, 2020-2032
- 10.1. Market Analysis, Insights and Forecast - by Client
- 10.1.1. Retailers
- 10.1.2. Institutional
- 10.2. Market Analysis, Insights and Forecast - by Services Provided
- 10.2.1. Full Time Brokers
- 10.2.2. Discounted Brokers
- 10.3. Market Analysis, Insights and Forecast - by Ownership
- 10.3.1. Privately Held
- 10.3.2. Publicly Held
- 10.1. Market Analysis, Insights and Forecast - by Client
- 11. Middle East and Africa E-Brokerages Market Analysis, Insights and Forecast, 2020-2032
- 11.1. Market Analysis, Insights and Forecast - by Client
- 11.1.1. Retailers
- 11.1.2. Institutional
- 11.2. Market Analysis, Insights and Forecast - by Services Provided
- 11.2.1. Full Time Brokers
- 11.2.2. Discounted Brokers
- 11.3. Market Analysis, Insights and Forecast - by Ownership
- 11.3.1. Privately Held
- 11.3.2. Publicly Held
- 11.1. Market Analysis, Insights and Forecast - by Client
- 12. Competitive Analysis
- 12.1. Company Profiles
- 12.1.1 Interactive Brokers
- 12.1.1.1. Company Overview
- 12.1.1.2. Products
- 12.1.1.3. Company Financials
- 12.1.1.4. SWOT Analysis
- 12.1.2 Charles Schwab
- 12.1.2.1. Company Overview
- 12.1.2.2. Products
- 12.1.2.3. Company Financials
- 12.1.2.4. SWOT Analysis
- 12.1.3 Fidelity Investments
- 12.1.3.1. Company Overview
- 12.1.3.2. Products
- 12.1.3.3. Company Financials
- 12.1.3.4. SWOT Analysis
- 12.1.4 TD Ameritrade
- 12.1.4.1. Company Overview
- 12.1.4.2. Products
- 12.1.4.3. Company Financials
- 12.1.4.4. SWOT Analysis
- 12.1.5 E-Trade
- 12.1.5.1. Company Overview
- 12.1.5.2. Products
- 12.1.5.3. Company Financials
- 12.1.5.4. SWOT Analysis
- 12.1.6 TastyWorks
- 12.1.6.1. Company Overview
- 12.1.6.2. Products
- 12.1.6.3. Company Financials
- 12.1.6.4. SWOT Analysis
- 12.1.7 Etoro
- 12.1.7.1. Company Overview
- 12.1.7.2. Products
- 12.1.7.3. Company Financials
- 12.1.7.4. SWOT Analysis
- 12.1.8 X-Trade Brokers
- 12.1.8.1. Company Overview
- 12.1.8.2. Products
- 12.1.8.3. Company Financials
- 12.1.8.4. SWOT Analysis
- 12.1.9 IC Markets
- 12.1.9.1. Company Overview
- 12.1.9.2. Products
- 12.1.9.3. Company Financials
- 12.1.9.4. SWOT Analysis
- 12.1.10 Eoption
- 12.1.10.1. Company Overview
- 12.1.10.2. Products
- 12.1.10.3. Company Financials
- 12.1.10.4. SWOT Analysis
- 12.1.11 First Prudential Markets**List Not Exhaustive
- 12.1.11.1. Company Overview
- 12.1.11.2. Products
- 12.1.11.3. Company Financials
- 12.1.11.4. SWOT Analysis
- 12.1.1 Interactive Brokers
- 12.2. Market Entropy
- 12.2.1 Company's Key Areas Served
- 12.2.2 Recent Developments
- 12.3. Company Market Share Analysis 2025
- 12.3.1 Top 5 Companies Market Share Analysis
- 12.3.2 Top 3 Companies Market Share Analysis
- 12.4. List of Potential Customers
- 13. Research Methodology
List of Figures
- Figure 1: Global E-Brokerages Market Revenue Breakdown (Million, %) by Region 2025 & 2033
- Figure 2: North America E-Brokerages Market Revenue (Million), by Client 2025 & 2033
- Figure 3: North America E-Brokerages Market Revenue Share (%), by Client 2025 & 2033
- Figure 4: North America E-Brokerages Market Revenue (Million), by Services Provided 2025 & 2033
- Figure 5: North America E-Brokerages Market Revenue Share (%), by Services Provided 2025 & 2033
- Figure 6: North America E-Brokerages Market Revenue (Million), by Ownership 2025 & 2033
- Figure 7: North America E-Brokerages Market Revenue Share (%), by Ownership 2025 & 2033
- Figure 8: North America E-Brokerages Market Revenue (Million), by Country 2025 & 2033
- Figure 9: North America E-Brokerages Market Revenue Share (%), by Country 2025 & 2033
- Figure 10: Europe E-Brokerages Market Revenue (Million), by Client 2025 & 2033
- Figure 11: Europe E-Brokerages Market Revenue Share (%), by Client 2025 & 2033
- Figure 12: Europe E-Brokerages Market Revenue (Million), by Services Provided 2025 & 2033
- Figure 13: Europe E-Brokerages Market Revenue Share (%), by Services Provided 2025 & 2033
- Figure 14: Europe E-Brokerages Market Revenue (Million), by Ownership 2025 & 2033
- Figure 15: Europe E-Brokerages Market Revenue Share (%), by Ownership 2025 & 2033
- Figure 16: Europe E-Brokerages Market Revenue (Million), by Country 2025 & 2033
- Figure 17: Europe E-Brokerages Market Revenue Share (%), by Country 2025 & 2033
- Figure 18: Asia Pacific E-Brokerages Market Revenue (Million), by Client 2025 & 2033
- Figure 19: Asia Pacific E-Brokerages Market Revenue Share (%), by Client 2025 & 2033
- Figure 20: Asia Pacific E-Brokerages Market Revenue (Million), by Services Provided 2025 & 2033
- Figure 21: Asia Pacific E-Brokerages Market Revenue Share (%), by Services Provided 2025 & 2033
- Figure 22: Asia Pacific E-Brokerages Market Revenue (Million), by Ownership 2025 & 2033
- Figure 23: Asia Pacific E-Brokerages Market Revenue Share (%), by Ownership 2025 & 2033
- Figure 24: Asia Pacific E-Brokerages Market Revenue (Million), by Country 2025 & 2033
- Figure 25: Asia Pacific E-Brokerages Market Revenue Share (%), by Country 2025 & 2033
- Figure 26: South America E-Brokerages Market Revenue (Million), by Client 2025 & 2033
- Figure 27: South America E-Brokerages Market Revenue Share (%), by Client 2025 & 2033
- Figure 28: South America E-Brokerages Market Revenue (Million), by Services Provided 2025 & 2033
- Figure 29: South America E-Brokerages Market Revenue Share (%), by Services Provided 2025 & 2033
- Figure 30: South America E-Brokerages Market Revenue (Million), by Ownership 2025 & 2033
- Figure 31: South America E-Brokerages Market Revenue Share (%), by Ownership 2025 & 2033
- Figure 32: South America E-Brokerages Market Revenue (Million), by Country 2025 & 2033
- Figure 33: South America E-Brokerages Market Revenue Share (%), by Country 2025 & 2033
- Figure 34: Middle East and Africa E-Brokerages Market Revenue (Million), by Client 2025 & 2033
- Figure 35: Middle East and Africa E-Brokerages Market Revenue Share (%), by Client 2025 & 2033
- Figure 36: Middle East and Africa E-Brokerages Market Revenue (Million), by Services Provided 2025 & 2033
- Figure 37: Middle East and Africa E-Brokerages Market Revenue Share (%), by Services Provided 2025 & 2033
- Figure 38: Middle East and Africa E-Brokerages Market Revenue (Million), by Ownership 2025 & 2033
- Figure 39: Middle East and Africa E-Brokerages Market Revenue Share (%), by Ownership 2025 & 2033
- Figure 40: Middle East and Africa E-Brokerages Market Revenue (Million), by Country 2025 & 2033
- Figure 41: Middle East and Africa E-Brokerages Market Revenue Share (%), by Country 2025 & 2033
List of Tables
- Table 1: Global E-Brokerages Market Revenue Million Forecast, by Client 2020 & 2033
- Table 2: Global E-Brokerages Market Revenue Million Forecast, by Services Provided 2020 & 2033
- Table 3: Global E-Brokerages Market Revenue Million Forecast, by Ownership 2020 & 2033
- Table 4: Global E-Brokerages Market Revenue Million Forecast, by Region 2020 & 2033
- Table 5: Global E-Brokerages Market Revenue Million Forecast, by Client 2020 & 2033
- Table 6: Global E-Brokerages Market Revenue Million Forecast, by Services Provided 2020 & 2033
- Table 7: Global E-Brokerages Market Revenue Million Forecast, by Ownership 2020 & 2033
- Table 8: Global E-Brokerages Market Revenue Million Forecast, by Country 2020 & 2033
- Table 9: Global E-Brokerages Market Revenue Million Forecast, by Client 2020 & 2033
- Table 10: Global E-Brokerages Market Revenue Million Forecast, by Services Provided 2020 & 2033
- Table 11: Global E-Brokerages Market Revenue Million Forecast, by Ownership 2020 & 2033
- Table 12: Global E-Brokerages Market Revenue Million Forecast, by Country 2020 & 2033
- Table 13: Global E-Brokerages Market Revenue Million Forecast, by Client 2020 & 2033
- Table 14: Global E-Brokerages Market Revenue Million Forecast, by Services Provided 2020 & 2033
- Table 15: Global E-Brokerages Market Revenue Million Forecast, by Ownership 2020 & 2033
- Table 16: Global E-Brokerages Market Revenue Million Forecast, by Country 2020 & 2033
- Table 17: Global E-Brokerages Market Revenue Million Forecast, by Client 2020 & 2033
- Table 18: Global E-Brokerages Market Revenue Million Forecast, by Services Provided 2020 & 2033
- Table 19: Global E-Brokerages Market Revenue Million Forecast, by Ownership 2020 & 2033
- Table 20: Global E-Brokerages Market Revenue Million Forecast, by Country 2020 & 2033
- Table 21: Global E-Brokerages Market Revenue Million Forecast, by Client 2020 & 2033
- Table 22: Global E-Brokerages Market Revenue Million Forecast, by Services Provided 2020 & 2033
- Table 23: Global E-Brokerages Market Revenue Million Forecast, by Ownership 2020 & 2033
- Table 24: Global E-Brokerages Market Revenue Million Forecast, by Country 2020 & 2033
Frequently Asked Questions
1. What is the projected Compound Annual Growth Rate (CAGR) of the E-Brokerages Market?
The projected CAGR is approximately > 6.50%.
2. Which companies are prominent players in the E-Brokerages Market?
Key companies in the market include Interactive Brokers, Charles Schwab, Fidelity Investments, TD Ameritrade, E-Trade, TastyWorks, Etoro, X-Trade Brokers, IC Markets, Eoption, First Prudential Markets**List Not Exhaustive.
3. What are the main segments of the E-Brokerages Market?
The market segments include Client, Services Provided, Ownership.
4. Can you provide details about the market size?
The market size is estimated to be USD XX Million as of 2022.
5. What are some drivers contributing to market growth?
N/A
6. What are the notable trends driving market growth?
Zero commission in United States equity markets change market dynamics.
7. Are there any restraints impacting market growth?
N/A
8. Can you provide examples of recent developments in the market?
May 2022: Interactive Brokers partnered with TradingView. The new partnership was like a win-win for all parties, particularly for Interactive broker clients as they were now trading directly from their TradingView workspaces and charts.
9. What pricing options are available for accessing the report?
Pricing options include single-user, multi-user, and enterprise licenses priced at USD 4750, USD 5250, and USD 8750 respectively.
10. Is the market size provided in terms of value or volume?
The market size is provided in terms of value, measured in Million.
11. Are there any specific market keywords associated with the report?
Yes, the market keyword associated with the report is "E-Brokerages Market," which aids in identifying and referencing the specific market segment covered.
12. How do I determine which pricing option suits my needs best?
The pricing options vary based on user requirements and access needs. Individual users may opt for single-user licenses, while businesses requiring broader access may choose multi-user or enterprise licenses for cost-effective access to the report.
13. Are there any additional resources or data provided in the E-Brokerages Market report?
While the report offers comprehensive insights, it's advisable to review the specific contents or supplementary materials provided to ascertain if additional resources or data are available.
14. How can I stay updated on further developments or reports in the E-Brokerages Market?
To stay informed about further developments, trends, and reports in the E-Brokerages Market, consider subscribing to industry newsletters, following relevant companies and organizations, or regularly checking reputable industry news sources and publications.
Methodology
Step 1 - Identification of Relevant Samples Size from Population Database


Step 2 - Approaches for Defining Global Market Size (Value, Volume* & Price*)

Note*: In applicable scenarios
Step 3 - Data Sources
Primary Research
- Web Analytics
- Survey Reports
- Research Institute
- Latest Research Reports
- Opinion Leaders
Secondary Research
- Annual Reports
- White Paper
- Latest Press Release
- Industry Association
- Paid Database
- Investor Presentations

Step 4 - Data Triangulation
Involves using different sources of information in order to increase the validity of a study
These sources are likely to be stakeholders in a program - participants, other researchers, program staff, other community members, and so on.
Then we put all data in single framework & apply various statistical tools to find out the dynamic on the market.
During the analysis stage, feedback from the stakeholder groups would be compared to determine areas of agreement as well as areas of divergence