

Key Insights
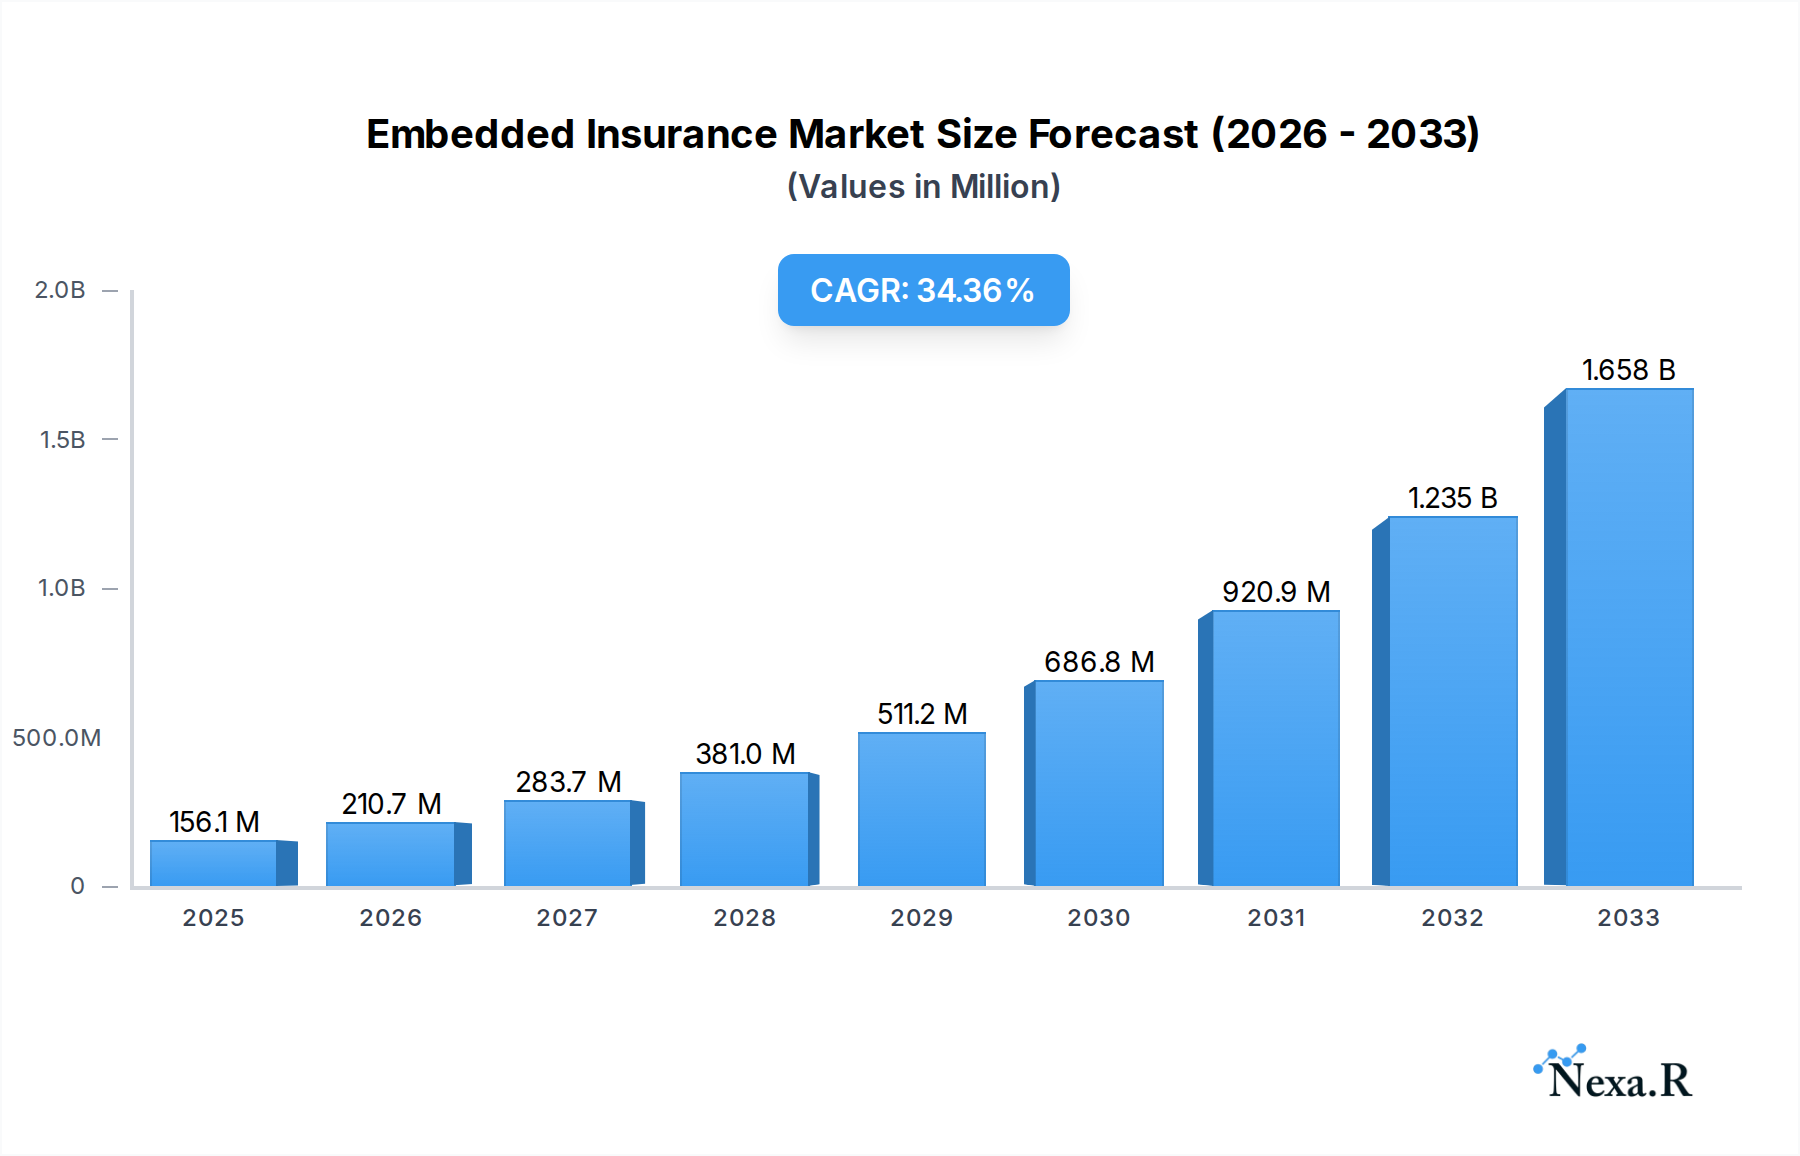
The Embedded Insurance Market is poised for explosive growth, projected to reach USD 156.06 Billion by 2025, driven by a remarkable Compound Annual Growth Rate (CAGR) of 35.14% over the forecast period of 2025-2033. This significant expansion is primarily fueled by the seamless integration of insurance offerings into non-insurance platforms, enhancing customer experience and accessibility. Key drivers include the growing demand for convenient, tailored insurance solutions at the point of sale, particularly for high-value consumer goods like electronics and furniture, as well as specialized areas such as travel insurance. The increasing digitalization of businesses and the rise of e-commerce further amplify the reach and adoption of embedded insurance models. Technological advancements, including AI-powered underwriting and personalized product development, are also playing a crucial role in making these offerings more attractive and efficient.

Embedded Insurance Market Market Size (In Million)
The market's robust growth trajectory is further supported by evolving consumer preferences that favor convenience and immediate protection. Online channels are expected to dominate as the primary distribution method, reflecting the digital-first nature of many embedded insurance partnerships. While the market is brimming with opportunities, potential restraints could emerge from stringent regulatory landscapes in certain regions and the need for robust data security and privacy measures to build and maintain customer trust. Geographically, North America and Europe are anticipated to lead the market in the near term, owing to their mature digital ecosystems and high consumer adoption rates. However, the Asia Pacific region presents a significant untapped potential for rapid growth, propelled by its burgeoning e-commerce sector and a large, digitally-savvy population. The competitive landscape features a mix of established insurance providers and agile InsurTech startups, all vying to capitalize on this dynamic market.
Embedded Insurance Market Company Market Share
Embedded Insurance Market: Unlocking Seamless Protection & Exponential Growth
This comprehensive report offers an in-depth analysis of the global Embedded Insurance market, projected to witness robust expansion and transformative innovation. Explore critical market dynamics, growth trajectories, regional dominance, product landscapes, and the strategic imperatives shaping this rapidly evolving sector. With a focus on quantitative insights and actionable intelligence, this report is an indispensable resource for insurers, Insurtechs, financial institutions, technology providers, and investors seeking to capitalize on the embedded insurance revolution.
Embedded Insurance Market Market Dynamics & Structure
The Embedded Insurance market is characterized by a dynamic interplay of technological innovation, evolving consumer expectations, and a shifting regulatory landscape. Market concentration varies across segments, with some areas dominated by a few key players while others exhibit a more fragmented structure. Technological advancements, particularly in data analytics and API integration, are primary drivers, enabling seamless integration of insurance products at the point of need. However, these innovations also face barriers such as legacy system integration challenges and the need for robust cybersecurity measures. Regulatory frameworks are adapting to accommodate new distribution models, with a growing emphasis on consumer protection and data privacy. Competitive product substitutes exist, ranging from traditional insurance offerings to alternative risk transfer mechanisms, though embedded insurance offers a unique value proposition through its convenience and contextual relevance. End-user demographics are broad, encompassing younger, digitally-native consumers seeking instant protection, as well as established customer bases benefiting from the added value of integrated coverage. Mergers and acquisitions (M&A) trends are significant, indicating a consolidation phase where larger players are acquiring innovative Insurtechs to enhance their embedded offerings and expand market reach. For instance, recent M&A activities are estimated to have reached xx million units in deal volume over the historical period.
- Market Concentration: Varies by Insurance Line, with Electronics and Travel showing higher concentration due to established players.
- Technological Innovation Drivers: AI-powered underwriting, API-first platforms, blockchain for claims processing.
- Regulatory Frameworks: GDPR, CCPA, and evolving regional insurance distribution laws impacting data usage and transparency.
- Competitive Product Substitutes: Traditional point-of-sale insurance, DIY investment platforms.
- End-User Demographics: Millennials and Gen Z are key adopters, valuing convenience and digital experiences.
- M&A Trends: Strategic acquisitions of Insurtechs by incumbent insurers and technology giants to gain embedded capabilities.
Embedded Insurance Market Growth Trends & Insights
The Embedded Insurance market is poised for unprecedented growth, driven by a fundamental shift in how consumers and businesses access and perceive insurance. The estimated market size for the base year 2025 is valued at $xx billion, with a projected Compound Annual Growth Rate (CAGR) of xx% from 2025 to 2033. This robust expansion is fueled by increasing adoption rates across various industries, as non-insurance entities recognize the value of offering protection as a seamless add-on to their core products and services. Technological disruptions, such as the proliferation of IoT devices and the increasing sophistication of AI in risk assessment and personalization, are creating new avenues for embedded insurance. Consumer behavior is a significant catalyst; individuals increasingly expect contextual, on-demand, and friction-free experiences, which embedded insurance perfectly addresses. The integration of insurance at the point of sale or usage eliminates the traditional hassle of shopping for policies separately, leading to higher conversion rates and improved customer loyalty. The market penetration of embedded insurance is expected to rise significantly, moving from xx% in the historical period to an estimated xx% by 2033. This growth is not solely dependent on new customer acquisition but also on upselling and cross-selling opportunities within existing customer bases of partner companies. For example, the "Others" segment, encompassing areas like pet insurance or legal services, is anticipated to witness a substantial surge as innovative solutions emerge. The journey from a niche offering to a mainstream component of commerce is well underway, with data indicating a steady upward trend in market size, from an estimated $xx billion in 2019 to $xx billion by the end of 2024. This trajectory underscores the market's inherent potential and its ability to redefine insurance distribution for the digital age. The strategic implementation of embedded insurance by leading companies is not merely a product enhancement but a core business strategy that drives revenue diversification and strengthens customer relationships, setting a precedent for industry-wide adoption.
Dominant Regions, Countries, or Segments in Embedded Insurance Market
The global Embedded Insurance market exhibits dynamic regional and segment-specific growth patterns. North America, particularly the United States, currently leads in market size and adoption, driven by a mature digital ecosystem, strong consumer propensity for insurance, and a well-established Insurtech landscape. The Electronics insurance segment, due to the high volume of consumer electronics purchases and the inherent risk of damage or theft, is a dominant force within the Insurance Line. The prevalence of online retail and e-commerce platforms facilitates the seamless integration of electronics insurance at the point of purchase, making the Online channel a significant contributor to market growth. Key drivers in this segment include the increasing average selling price of electronic devices, the growing reliance on these devices for daily life and work, and manufacturers' and retailers' recognition of insurance as a revenue enhancer and a customer retention tool. Market share within the Electronics segment is substantial, estimated at xx% of the total embedded insurance market in 2025, with a projected CAGR of xx% through 2033.
In Europe, the UK and Germany are notable for their advanced embedded insurance initiatives, particularly in Travel Insurance. The recovery of the travel sector post-pandemic, coupled with the inherent unpredictability of travel-related risks, has propelled demand for convenient, bundled travel insurance solutions offered by airlines, booking platforms, and travel agencies. Economic policies that encourage consumer spending and robust digital infrastructure further bolster these markets. Asia-Pacific, led by China and India, is emerging as a high-growth region, driven by a burgeoning middle class, increasing smartphone penetration, and a rapidly expanding e-commerce sector. Emerging segments like Furniture insurance, though currently smaller, are showing promising growth, particularly in regions with expanding homeownership and a rising demand for higher-value furnishings.
- Leading Region: North America (USA) – driven by digital maturity and consumer demand.
- Dominant Insurance Line: Electronics – high volume sales and inherent product risk.
- Dominant Channel: Online – facilitated by e-commerce and digital service platforms.
- Key Drivers in Electronics: Increasing device value, consumer reliance, and retailer revenue strategies.
- Growth Potential in Travel Insurance (Europe): Post-pandemic travel rebound and the need for seamless protection.
- Emerging Markets: Asia-Pacific (China, India) showing rapid adoption due to digital growth.
- Niche Segment Growth: Furniture insurance showing traction in developing economies.
Embedded Insurance Market Product Landscape
The embedded insurance product landscape is defined by its adaptability, personalization, and contextual relevance. Innovations are focused on creating granular, on-demand coverage solutions that align perfectly with the lifecycle and usage of underlying products or services. This includes micro-insurance policies for specific events or periods, such as protection for a single rental item or coverage during a specific trip. Unique selling propositions (USPs) revolve around the "invisible" integration, where insurance is a natural extension of the customer journey, minimizing friction and increasing adoption. Technological advancements like AI-powered dynamic pricing allow for policies that adjust based on real-time risk factors, offering fairer premiums to consumers. Performance metrics highlight increased conversion rates, reduced customer acquisition costs for insurers, and enhanced customer lifetime value for platform partners. The application of embedded insurance spans across a multitude of consumer and business needs, from protecting purchased goods to safeguarding against digital risks.
Key Drivers, Barriers & Challenges in Embedded Insurance Market
Key Drivers:
The embedded insurance market is propelled by several powerful forces. Technological advancements, particularly in API integration and data analytics, are fundamental, enabling seamless product embedding and personalized risk assessment. The growing demand for convenience and digital-first experiences from consumers is a major driver, as they seek protection that is integrated into their purchasing journey. For businesses, embedded insurance presents an opportunity to enhance customer value, create new revenue streams, and improve customer loyalty by offering a complete solution. The expansion of e-commerce and digital platforms further facilitates the distribution of these integrated products.
Barriers & Challenges:
Despite its promising outlook, the embedded insurance market faces significant challenges. Regulatory hurdles and compliance complexities related to data privacy and cross-border distribution can slow down market entry and product deployment. Legacy IT systems within incumbent insurers can hinder the seamless integration required for effective embedded solutions. Building trust and ensuring transparency with consumers, who may not fully understand the insurance component being offered, is crucial. Moreover, competition from established insurance providers and the need for robust cybersecurity measures to protect sensitive customer data are ongoing concerns. Supply chain disruptions, while less direct, can impact the availability of underlying products, thereby affecting the demand for associated insurance.
Emerging Opportunities in Embedded Insurance Market
Emerging opportunities in the embedded insurance market are vast and largely untapped. The increasing adoption of the Internet of Things (IoT) presents a significant frontier, enabling usage-based insurance for connected devices, vehicles, and smart homes. The "as-a-service" economy, where consumers increasingly subscribe to services rather than own assets, opens avenues for embedded protection within these subscription models. Furthermore, niche markets such as gig economy worker protection, embedded within platform services, and specialized coverage for the creator economy are poised for growth. Evolving consumer preferences towards sustainability and ethical consumption are also creating opportunities for embedded insurance products that align with these values, such as coverage for refurbished goods or eco-friendly products.
Growth Accelerators in the Embedded Insurance Market Industry
Several catalysts are accelerating the long-term growth of the embedded insurance market. Technological breakthroughs in AI and machine learning are enabling more sophisticated risk modeling and personalized product design, making embedded offerings more attractive and profitable. Strategic partnerships between Insurtechs, traditional insurers, and non-insurance companies are crucial for expanding reach and leveraging existing customer bases. Market expansion strategies, including geographical diversification and the exploration of new industry verticals, are key to sustained growth. The ongoing digitalization of economies worldwide, coupled with a growing acceptance of digital financial services, provides a fertile ground for embedded insurance to flourish.
Key Players Shaping the Embedded Insurance Market Market
- Cover Genius
- Penn Io
- Lemonade
- FetchaQuote
- Fletch
- Bubble
- Companjon
- Rein
- Mulberri
- Qover
- Bolttech
- Igloo
- Assurant
- Bsurance
- Extend
Notable Milestones in Embedded Insurance Market Sector
- November 2023: NJJ, a telecommunications conglomerate, collaborated with Bolttech, an Insurtech company, to offer mobile device insurance for mobile operators.
- October 2023: Modives collaborated with Bindable aimed at introducing embedded insurance into their property segment.
In-Depth Embedded Insurance Market Market Outlook
The future outlook for the embedded insurance market is exceptionally strong, driven by fundamental shifts in consumer behavior and technological innovation. Growth accelerators such as AI-driven personalization, the expansion of the subscription economy, and the increasing digitization of business processes will continue to fuel market expansion. Strategic partnerships between Insurtechs and established brands are expected to intensify, enabling wider product distribution and deeper customer integration. The market is moving towards a future where insurance is not an afterthought but an intrinsic part of everyday transactions, offering unparalleled convenience and value. This proactive approach to risk management will redefine customer expectations and create significant opportunities for early adopters and innovative players in the embedded insurance ecosystem.
Embedded Insurance Market Segmentation
-
1. Insurance Line
- 1.1. Electronics
- 1.2. Furniture
- 1.3. Sports Equipment
- 1.4. Travel Insurance
- 1.5. Others
-
2. Channel
- 2.1. Online
- 2.2. Offline
Embedded Insurance Market Segmentation By Geography
-
1. North America
- 1.1. United States
- 1.2. Canada
-
2. Europe
- 2.1. United Kingdom
- 2.2. France
- 2.3. Italy
- 2.4. Spain
- 2.5. Rest of Europe
-
3. Asia Pacific
- 3.1. China
- 3.2. India
- 3.3. Japan
- 3.4. Rest of Asia Pacific
-
4. Latin America
- 4.1. Mexico
- 4.2. Brazil
- 4.3. Rest of Latin America
- 5. Middle East
-
6. United Arab Emirates
- 6.1. Saudi Arabia
- 6.2. South Africa
- 6.3. Rest of Middle East

Embedded Insurance Market Regional Market Share
Geographic Coverage of Embedded Insurance Market
Embedded Insurance Market REPORT HIGHLIGHTS
| Aspects | Details |
|---|---|
| Study Period | 2020-2034 |
| Base Year | 2025 |
| Estimated Year | 2026 |
| Forecast Period | 2026-2034 |
| Historical Period | 2020-2025 |
| Growth Rate | CAGR of 35.14% from 2020-2034 |
| Segmentation |
|
Table of Contents
- 1. Introduction
- 1.1. Research Scope
- 1.2. Market Segmentation
- 1.3. Research Objective
- 1.4. Definitions and Assumptions
- 2. Executive Summary
- 2.1. Market Snapshot
- 3. Market Dynamics
- 3.1. Market Drivers
- 3.2. Market Restrains
- 3.3. Market Trends
- 3.4. Market Opportunities
- 4. Market Factor Analysis
- 4.1. Porters Five Forces
- 4.1.1. Bargaining Power of Suppliers
- 4.1.2. Bargaining Power of Buyers
- 4.1.3. Threat of New Entrants
- 4.1.4. Threat of Substitutes
- 4.1.5. Competitive Rivalry
- 4.2. PESTEL analysis
- 4.3. BCG Analysis
- 4.3.1. Stars (High Growth, High Market Share)
- 4.3.2. Cash Cows (Low Growth, High Market Share)
- 4.3.3. Question Mark (High Growth, Low Market Share)
- 4.3.4. Dogs (Low Growth, Low Market Share)
- 4.4. Ansoff Matrix Analysis
- 4.5. Supply Chain Analysis
- 4.6. Regulatory Landscape
- 4.7. Current Market Potential and Opportunity Assessment (TAM–SAM–SOM Framework)
- 4.8. NRP Analyst Note
- 4.1. Porters Five Forces
- 5. Market Analysis, Insights and Forecast 2021-2033
- 5.1. Market Analysis, Insights and Forecast - by Insurance Line
- 5.1.1. Electronics
- 5.1.2. Furniture
- 5.1.3. Sports Equipment
- 5.1.4. Travel Insurance
- 5.1.5. Others
- 5.2. Market Analysis, Insights and Forecast - by Channel
- 5.2.1. Online
- 5.2.2. Offline
- 5.3. Market Analysis, Insights and Forecast - by Region
- 5.3.1. North America
- 5.3.2. Europe
- 5.3.3. Asia Pacific
- 5.3.4. Latin America
- 5.3.5. Middle East
- 5.3.6. United Arab Emirates
- 5.1. Market Analysis, Insights and Forecast - by Insurance Line
- 6. Global Embedded Insurance Market Analysis, Insights and Forecast, 2021-2033
- 6.1. Market Analysis, Insights and Forecast - by Insurance Line
- 6.1.1. Electronics
- 6.1.2. Furniture
- 6.1.3. Sports Equipment
- 6.1.4. Travel Insurance
- 6.1.5. Others
- 6.2. Market Analysis, Insights and Forecast - by Channel
- 6.2.1. Online
- 6.2.2. Offline
- 6.1. Market Analysis, Insights and Forecast - by Insurance Line
- 7. North America Embedded Insurance Market Analysis, Insights and Forecast, 2020-2032
- 7.1. Market Analysis, Insights and Forecast - by Insurance Line
- 7.1.1. Electronics
- 7.1.2. Furniture
- 7.1.3. Sports Equipment
- 7.1.4. Travel Insurance
- 7.1.5. Others
- 7.2. Market Analysis, Insights and Forecast - by Channel
- 7.2.1. Online
- 7.2.2. Offline
- 7.1. Market Analysis, Insights and Forecast - by Insurance Line
- 8. Europe Embedded Insurance Market Analysis, Insights and Forecast, 2020-2032
- 8.1. Market Analysis, Insights and Forecast - by Insurance Line
- 8.1.1. Electronics
- 8.1.2. Furniture
- 8.1.3. Sports Equipment
- 8.1.4. Travel Insurance
- 8.1.5. Others
- 8.2. Market Analysis, Insights and Forecast - by Channel
- 8.2.1. Online
- 8.2.2. Offline
- 8.1. Market Analysis, Insights and Forecast - by Insurance Line
- 9. Asia Pacific Embedded Insurance Market Analysis, Insights and Forecast, 2020-2032
- 9.1. Market Analysis, Insights and Forecast - by Insurance Line
- 9.1.1. Electronics
- 9.1.2. Furniture
- 9.1.3. Sports Equipment
- 9.1.4. Travel Insurance
- 9.1.5. Others
- 9.2. Market Analysis, Insights and Forecast - by Channel
- 9.2.1. Online
- 9.2.2. Offline
- 9.1. Market Analysis, Insights and Forecast - by Insurance Line
- 10. Latin America Embedded Insurance Market Analysis, Insights and Forecast, 2020-2032
- 10.1. Market Analysis, Insights and Forecast - by Insurance Line
- 10.1.1. Electronics
- 10.1.2. Furniture
- 10.1.3. Sports Equipment
- 10.1.4. Travel Insurance
- 10.1.5. Others
- 10.2. Market Analysis, Insights and Forecast - by Channel
- 10.2.1. Online
- 10.2.2. Offline
- 10.1. Market Analysis, Insights and Forecast - by Insurance Line
- 11. Middle East Embedded Insurance Market Analysis, Insights and Forecast, 2020-2032
- 11.1. Market Analysis, Insights and Forecast - by Insurance Line
- 11.1.1. Electronics
- 11.1.2. Furniture
- 11.1.3. Sports Equipment
- 11.1.4. Travel Insurance
- 11.1.5. Others
- 11.2. Market Analysis, Insights and Forecast - by Channel
- 11.2.1. Online
- 11.2.2. Offline
- 11.1. Market Analysis, Insights and Forecast - by Insurance Line
- 12. United Arab Emirates Embedded Insurance Market Analysis, Insights and Forecast, 2020-2032
- 12.1. Market Analysis, Insights and Forecast - by Insurance Line
- 12.1.1. Electronics
- 12.1.2. Furniture
- 12.1.3. Sports Equipment
- 12.1.4. Travel Insurance
- 12.1.5. Others
- 12.2. Market Analysis, Insights and Forecast - by Channel
- 12.2.1. Online
- 12.2.2. Offline
- 12.1. Market Analysis, Insights and Forecast - by Insurance Line
- 13. Competitive Analysis
- 13.1. Company Profiles
- 13.1.1 Cover Genius
- 13.1.1.1. Company Overview
- 13.1.1.2. Products
- 13.1.1.3. Company Financials
- 13.1.1.4. SWOT Analysis
- 13.1.2 Penn Io
- 13.1.2.1. Company Overview
- 13.1.2.2. Products
- 13.1.2.3. Company Financials
- 13.1.2.4. SWOT Analysis
- 13.1.3 Lemonade
- 13.1.3.1. Company Overview
- 13.1.3.2. Products
- 13.1.3.3. Company Financials
- 13.1.3.4. SWOT Analysis
- 13.1.4 FetchaQuote
- 13.1.4.1. Company Overview
- 13.1.4.2. Products
- 13.1.4.3. Company Financials
- 13.1.4.4. SWOT Analysis
- 13.1.5 Fletch
- 13.1.5.1. Company Overview
- 13.1.5.2. Products
- 13.1.5.3. Company Financials
- 13.1.5.4. SWOT Analysis
- 13.1.6 Bubble
- 13.1.6.1. Company Overview
- 13.1.6.2. Products
- 13.1.6.3. Company Financials
- 13.1.6.4. SWOT Analysis
- 13.1.7 Companjon
- 13.1.7.1. Company Overview
- 13.1.7.2. Products
- 13.1.7.3. Company Financials
- 13.1.7.4. SWOT Analysis
- 13.1.8 Rein
- 13.1.8.1. Company Overview
- 13.1.8.2. Products
- 13.1.8.3. Company Financials
- 13.1.8.4. SWOT Analysis
- 13.1.9 Mulberri
- 13.1.9.1. Company Overview
- 13.1.9.2. Products
- 13.1.9.3. Company Financials
- 13.1.9.4. SWOT Analysis
- 13.1.10 Qover
- 13.1.10.1. Company Overview
- 13.1.10.2. Products
- 13.1.10.3. Company Financials
- 13.1.10.4. SWOT Analysis
- 13.1.11 Bolttech
- 13.1.11.1. Company Overview
- 13.1.11.2. Products
- 13.1.11.3. Company Financials
- 13.1.11.4. SWOT Analysis
- 13.1.12 Igloo
- 13.1.12.1. Company Overview
- 13.1.12.2. Products
- 13.1.12.3. Company Financials
- 13.1.12.4. SWOT Analysis
- 13.1.13 Assurant
- 13.1.13.1. Company Overview
- 13.1.13.2. Products
- 13.1.13.3. Company Financials
- 13.1.13.4. SWOT Analysis
- 13.1.14 Bsurance
- 13.1.14.1. Company Overview
- 13.1.14.2. Products
- 13.1.14.3. Company Financials
- 13.1.14.4. SWOT Analysis
- 13.1.15 Extend**List Not Exhaustive
- 13.1.15.1. Company Overview
- 13.1.15.2. Products
- 13.1.15.3. Company Financials
- 13.1.15.4. SWOT Analysis
- 13.1.1 Cover Genius
- 13.2. Market Entropy
- 13.2.1 Company's Key Areas Served
- 13.2.2 Recent Developments
- 13.3. Company Market Share Analysis 2025
- 13.3.1 Top 5 Companies Market Share Analysis
- 13.3.2 Top 3 Companies Market Share Analysis
- 13.4. List of Potential Customers
- 14. Research Methodology
List of Figures
- Figure 1: Global Embedded Insurance Market Revenue Breakdown (Million, %) by Region 2025 & 2033
- Figure 2: Global Embedded Insurance Market Volume Breakdown (Billion, %) by Region 2025 & 2033
- Figure 3: North America Embedded Insurance Market Revenue (Million), by Insurance Line 2025 & 2033
- Figure 4: North America Embedded Insurance Market Volume (Billion), by Insurance Line 2025 & 2033
- Figure 5: North America Embedded Insurance Market Revenue Share (%), by Insurance Line 2025 & 2033
- Figure 6: North America Embedded Insurance Market Volume Share (%), by Insurance Line 2025 & 2033
- Figure 7: North America Embedded Insurance Market Revenue (Million), by Channel 2025 & 2033
- Figure 8: North America Embedded Insurance Market Volume (Billion), by Channel 2025 & 2033
- Figure 9: North America Embedded Insurance Market Revenue Share (%), by Channel 2025 & 2033
- Figure 10: North America Embedded Insurance Market Volume Share (%), by Channel 2025 & 2033
- Figure 11: North America Embedded Insurance Market Revenue (Million), by Country 2025 & 2033
- Figure 12: North America Embedded Insurance Market Volume (Billion), by Country 2025 & 2033
- Figure 13: North America Embedded Insurance Market Revenue Share (%), by Country 2025 & 2033
- Figure 14: North America Embedded Insurance Market Volume Share (%), by Country 2025 & 2033
- Figure 15: Europe Embedded Insurance Market Revenue (Million), by Insurance Line 2025 & 2033
- Figure 16: Europe Embedded Insurance Market Volume (Billion), by Insurance Line 2025 & 2033
- Figure 17: Europe Embedded Insurance Market Revenue Share (%), by Insurance Line 2025 & 2033
- Figure 18: Europe Embedded Insurance Market Volume Share (%), by Insurance Line 2025 & 2033
- Figure 19: Europe Embedded Insurance Market Revenue (Million), by Channel 2025 & 2033
- Figure 20: Europe Embedded Insurance Market Volume (Billion), by Channel 2025 & 2033
- Figure 21: Europe Embedded Insurance Market Revenue Share (%), by Channel 2025 & 2033
- Figure 22: Europe Embedded Insurance Market Volume Share (%), by Channel 2025 & 2033
- Figure 23: Europe Embedded Insurance Market Revenue (Million), by Country 2025 & 2033
- Figure 24: Europe Embedded Insurance Market Volume (Billion), by Country 2025 & 2033
- Figure 25: Europe Embedded Insurance Market Revenue Share (%), by Country 2025 & 2033
- Figure 26: Europe Embedded Insurance Market Volume Share (%), by Country 2025 & 2033
- Figure 27: Asia Pacific Embedded Insurance Market Revenue (Million), by Insurance Line 2025 & 2033
- Figure 28: Asia Pacific Embedded Insurance Market Volume (Billion), by Insurance Line 2025 & 2033
- Figure 29: Asia Pacific Embedded Insurance Market Revenue Share (%), by Insurance Line 2025 & 2033
- Figure 30: Asia Pacific Embedded Insurance Market Volume Share (%), by Insurance Line 2025 & 2033
- Figure 31: Asia Pacific Embedded Insurance Market Revenue (Million), by Channel 2025 & 2033
- Figure 32: Asia Pacific Embedded Insurance Market Volume (Billion), by Channel 2025 & 2033
- Figure 33: Asia Pacific Embedded Insurance Market Revenue Share (%), by Channel 2025 & 2033
- Figure 34: Asia Pacific Embedded Insurance Market Volume Share (%), by Channel 2025 & 2033
- Figure 35: Asia Pacific Embedded Insurance Market Revenue (Million), by Country 2025 & 2033
- Figure 36: Asia Pacific Embedded Insurance Market Volume (Billion), by Country 2025 & 2033
- Figure 37: Asia Pacific Embedded Insurance Market Revenue Share (%), by Country 2025 & 2033
- Figure 38: Asia Pacific Embedded Insurance Market Volume Share (%), by Country 2025 & 2033
- Figure 39: Latin America Embedded Insurance Market Revenue (Million), by Insurance Line 2025 & 2033
- Figure 40: Latin America Embedded Insurance Market Volume (Billion), by Insurance Line 2025 & 2033
- Figure 41: Latin America Embedded Insurance Market Revenue Share (%), by Insurance Line 2025 & 2033
- Figure 42: Latin America Embedded Insurance Market Volume Share (%), by Insurance Line 2025 & 2033
- Figure 43: Latin America Embedded Insurance Market Revenue (Million), by Channel 2025 & 2033
- Figure 44: Latin America Embedded Insurance Market Volume (Billion), by Channel 2025 & 2033
- Figure 45: Latin America Embedded Insurance Market Revenue Share (%), by Channel 2025 & 2033
- Figure 46: Latin America Embedded Insurance Market Volume Share (%), by Channel 2025 & 2033
- Figure 47: Latin America Embedded Insurance Market Revenue (Million), by Country 2025 & 2033
- Figure 48: Latin America Embedded Insurance Market Volume (Billion), by Country 2025 & 2033
- Figure 49: Latin America Embedded Insurance Market Revenue Share (%), by Country 2025 & 2033
- Figure 50: Latin America Embedded Insurance Market Volume Share (%), by Country 2025 & 2033
- Figure 51: Middle East Embedded Insurance Market Revenue (Million), by Insurance Line 2025 & 2033
- Figure 52: Middle East Embedded Insurance Market Volume (Billion), by Insurance Line 2025 & 2033
- Figure 53: Middle East Embedded Insurance Market Revenue Share (%), by Insurance Line 2025 & 2033
- Figure 54: Middle East Embedded Insurance Market Volume Share (%), by Insurance Line 2025 & 2033
- Figure 55: Middle East Embedded Insurance Market Revenue (Million), by Channel 2025 & 2033
- Figure 56: Middle East Embedded Insurance Market Volume (Billion), by Channel 2025 & 2033
- Figure 57: Middle East Embedded Insurance Market Revenue Share (%), by Channel 2025 & 2033
- Figure 58: Middle East Embedded Insurance Market Volume Share (%), by Channel 2025 & 2033
- Figure 59: Middle East Embedded Insurance Market Revenue (Million), by Country 2025 & 2033
- Figure 60: Middle East Embedded Insurance Market Volume (Billion), by Country 2025 & 2033
- Figure 61: Middle East Embedded Insurance Market Revenue Share (%), by Country 2025 & 2033
- Figure 62: Middle East Embedded Insurance Market Volume Share (%), by Country 2025 & 2033
- Figure 63: United Arab Emirates Embedded Insurance Market Revenue (Million), by Insurance Line 2025 & 2033
- Figure 64: United Arab Emirates Embedded Insurance Market Volume (Billion), by Insurance Line 2025 & 2033
- Figure 65: United Arab Emirates Embedded Insurance Market Revenue Share (%), by Insurance Line 2025 & 2033
- Figure 66: United Arab Emirates Embedded Insurance Market Volume Share (%), by Insurance Line 2025 & 2033
- Figure 67: United Arab Emirates Embedded Insurance Market Revenue (Million), by Channel 2025 & 2033
- Figure 68: United Arab Emirates Embedded Insurance Market Volume (Billion), by Channel 2025 & 2033
- Figure 69: United Arab Emirates Embedded Insurance Market Revenue Share (%), by Channel 2025 & 2033
- Figure 70: United Arab Emirates Embedded Insurance Market Volume Share (%), by Channel 2025 & 2033
- Figure 71: United Arab Emirates Embedded Insurance Market Revenue (Million), by Country 2025 & 2033
- Figure 72: United Arab Emirates Embedded Insurance Market Volume (Billion), by Country 2025 & 2033
- Figure 73: United Arab Emirates Embedded Insurance Market Revenue Share (%), by Country 2025 & 2033
- Figure 74: United Arab Emirates Embedded Insurance Market Volume Share (%), by Country 2025 & 2033
List of Tables
- Table 1: Global Embedded Insurance Market Revenue Million Forecast, by Insurance Line 2020 & 2033
- Table 2: Global Embedded Insurance Market Volume Billion Forecast, by Insurance Line 2020 & 2033
- Table 3: Global Embedded Insurance Market Revenue Million Forecast, by Channel 2020 & 2033
- Table 4: Global Embedded Insurance Market Volume Billion Forecast, by Channel 2020 & 2033
- Table 5: Global Embedded Insurance Market Revenue Million Forecast, by Region 2020 & 2033
- Table 6: Global Embedded Insurance Market Volume Billion Forecast, by Region 2020 & 2033
- Table 7: Global Embedded Insurance Market Revenue Million Forecast, by Insurance Line 2020 & 2033
- Table 8: Global Embedded Insurance Market Volume Billion Forecast, by Insurance Line 2020 & 2033
- Table 9: Global Embedded Insurance Market Revenue Million Forecast, by Channel 2020 & 2033
- Table 10: Global Embedded Insurance Market Volume Billion Forecast, by Channel 2020 & 2033
- Table 11: Global Embedded Insurance Market Revenue Million Forecast, by Country 2020 & 2033
- Table 12: Global Embedded Insurance Market Volume Billion Forecast, by Country 2020 & 2033
- Table 13: United States Embedded Insurance Market Revenue (Million) Forecast, by Application 2020 & 2033
- Table 14: United States Embedded Insurance Market Volume (Billion) Forecast, by Application 2020 & 2033
- Table 15: Canada Embedded Insurance Market Revenue (Million) Forecast, by Application 2020 & 2033
- Table 16: Canada Embedded Insurance Market Volume (Billion) Forecast, by Application 2020 & 2033
- Table 17: Global Embedded Insurance Market Revenue Million Forecast, by Insurance Line 2020 & 2033
- Table 18: Global Embedded Insurance Market Volume Billion Forecast, by Insurance Line 2020 & 2033
- Table 19: Global Embedded Insurance Market Revenue Million Forecast, by Channel 2020 & 2033
- Table 20: Global Embedded Insurance Market Volume Billion Forecast, by Channel 2020 & 2033
- Table 21: Global Embedded Insurance Market Revenue Million Forecast, by Country 2020 & 2033
- Table 22: Global Embedded Insurance Market Volume Billion Forecast, by Country 2020 & 2033
- Table 23: United Kingdom Embedded Insurance Market Revenue (Million) Forecast, by Application 2020 & 2033
- Table 24: United Kingdom Embedded Insurance Market Volume (Billion) Forecast, by Application 2020 & 2033
- Table 25: France Embedded Insurance Market Revenue (Million) Forecast, by Application 2020 & 2033
- Table 26: France Embedded Insurance Market Volume (Billion) Forecast, by Application 2020 & 2033
- Table 27: Italy Embedded Insurance Market Revenue (Million) Forecast, by Application 2020 & 2033
- Table 28: Italy Embedded Insurance Market Volume (Billion) Forecast, by Application 2020 & 2033
- Table 29: Spain Embedded Insurance Market Revenue (Million) Forecast, by Application 2020 & 2033
- Table 30: Spain Embedded Insurance Market Volume (Billion) Forecast, by Application 2020 & 2033
- Table 31: Rest of Europe Embedded Insurance Market Revenue (Million) Forecast, by Application 2020 & 2033
- Table 32: Rest of Europe Embedded Insurance Market Volume (Billion) Forecast, by Application 2020 & 2033
- Table 33: Global Embedded Insurance Market Revenue Million Forecast, by Insurance Line 2020 & 2033
- Table 34: Global Embedded Insurance Market Volume Billion Forecast, by Insurance Line 2020 & 2033
- Table 35: Global Embedded Insurance Market Revenue Million Forecast, by Channel 2020 & 2033
- Table 36: Global Embedded Insurance Market Volume Billion Forecast, by Channel 2020 & 2033
- Table 37: Global Embedded Insurance Market Revenue Million Forecast, by Country 2020 & 2033
- Table 38: Global Embedded Insurance Market Volume Billion Forecast, by Country 2020 & 2033
- Table 39: China Embedded Insurance Market Revenue (Million) Forecast, by Application 2020 & 2033
- Table 40: China Embedded Insurance Market Volume (Billion) Forecast, by Application 2020 & 2033
- Table 41: India Embedded Insurance Market Revenue (Million) Forecast, by Application 2020 & 2033
- Table 42: India Embedded Insurance Market Volume (Billion) Forecast, by Application 2020 & 2033
- Table 43: Japan Embedded Insurance Market Revenue (Million) Forecast, by Application 2020 & 2033
- Table 44: Japan Embedded Insurance Market Volume (Billion) Forecast, by Application 2020 & 2033
- Table 45: Rest of Asia Pacific Embedded Insurance Market Revenue (Million) Forecast, by Application 2020 & 2033
- Table 46: Rest of Asia Pacific Embedded Insurance Market Volume (Billion) Forecast, by Application 2020 & 2033
- Table 47: Global Embedded Insurance Market Revenue Million Forecast, by Insurance Line 2020 & 2033
- Table 48: Global Embedded Insurance Market Volume Billion Forecast, by Insurance Line 2020 & 2033
- Table 49: Global Embedded Insurance Market Revenue Million Forecast, by Channel 2020 & 2033
- Table 50: Global Embedded Insurance Market Volume Billion Forecast, by Channel 2020 & 2033
- Table 51: Global Embedded Insurance Market Revenue Million Forecast, by Country 2020 & 2033
- Table 52: Global Embedded Insurance Market Volume Billion Forecast, by Country 2020 & 2033
- Table 53: Mexico Embedded Insurance Market Revenue (Million) Forecast, by Application 2020 & 2033
- Table 54: Mexico Embedded Insurance Market Volume (Billion) Forecast, by Application 2020 & 2033
- Table 55: Brazil Embedded Insurance Market Revenue (Million) Forecast, by Application 2020 & 2033
- Table 56: Brazil Embedded Insurance Market Volume (Billion) Forecast, by Application 2020 & 2033
- Table 57: Rest of Latin America Embedded Insurance Market Revenue (Million) Forecast, by Application 2020 & 2033
- Table 58: Rest of Latin America Embedded Insurance Market Volume (Billion) Forecast, by Application 2020 & 2033
- Table 59: Global Embedded Insurance Market Revenue Million Forecast, by Insurance Line 2020 & 2033
- Table 60: Global Embedded Insurance Market Volume Billion Forecast, by Insurance Line 2020 & 2033
- Table 61: Global Embedded Insurance Market Revenue Million Forecast, by Channel 2020 & 2033
- Table 62: Global Embedded Insurance Market Volume Billion Forecast, by Channel 2020 & 2033
- Table 63: Global Embedded Insurance Market Revenue Million Forecast, by Country 2020 & 2033
- Table 64: Global Embedded Insurance Market Volume Billion Forecast, by Country 2020 & 2033
- Table 65: Global Embedded Insurance Market Revenue Million Forecast, by Insurance Line 2020 & 2033
- Table 66: Global Embedded Insurance Market Volume Billion Forecast, by Insurance Line 2020 & 2033
- Table 67: Global Embedded Insurance Market Revenue Million Forecast, by Channel 2020 & 2033
- Table 68: Global Embedded Insurance Market Volume Billion Forecast, by Channel 2020 & 2033
- Table 69: Global Embedded Insurance Market Revenue Million Forecast, by Country 2020 & 2033
- Table 70: Global Embedded Insurance Market Volume Billion Forecast, by Country 2020 & 2033
- Table 71: Saudi Arabia Embedded Insurance Market Revenue (Million) Forecast, by Application 2020 & 2033
- Table 72: Saudi Arabia Embedded Insurance Market Volume (Billion) Forecast, by Application 2020 & 2033
- Table 73: South Africa Embedded Insurance Market Revenue (Million) Forecast, by Application 2020 & 2033
- Table 74: South Africa Embedded Insurance Market Volume (Billion) Forecast, by Application 2020 & 2033
- Table 75: Rest of Middle East Embedded Insurance Market Revenue (Million) Forecast, by Application 2020 & 2033
- Table 76: Rest of Middle East Embedded Insurance Market Volume (Billion) Forecast, by Application 2020 & 2033
Frequently Asked Questions
1. What is the projected Compound Annual Growth Rate (CAGR) of the Embedded Insurance Market?
The projected CAGR is approximately 35.14%.
2. Which companies are prominent players in the Embedded Insurance Market?
Key companies in the market include Cover Genius, Penn Io, Lemonade, FetchaQuote, Fletch, Bubble, Companjon, Rein, Mulberri, Qover, Bolttech, Igloo, Assurant, Bsurance, Extend**List Not Exhaustive.
3. What are the main segments of the Embedded Insurance Market?
The market segments include Insurance Line, Channel.
4. Can you provide details about the market size?
The market size is estimated to be USD 156.06 Million as of 2022.
5. What are some drivers contributing to market growth?
N/A
6. What are the notable trends driving market growth?
Increasing Life Insurance Premiums is Fuelling the Market.
7. Are there any restraints impacting market growth?
N/A
8. Can you provide examples of recent developments in the market?
November 2023: NJJ, a telecommunications conglomerate, collaborated with Bolttech, an Insurtech company, to offer mobile device insurance for mobile operators.
9. What pricing options are available for accessing the report?
Pricing options include single-user, multi-user, and enterprise licenses priced at USD 4750, USD 5250, and USD 8750 respectively.
10. Is the market size provided in terms of value or volume?
The market size is provided in terms of value, measured in Million and volume, measured in Billion.
11. Are there any specific market keywords associated with the report?
Yes, the market keyword associated with the report is "Embedded Insurance Market," which aids in identifying and referencing the specific market segment covered.
12. How do I determine which pricing option suits my needs best?
The pricing options vary based on user requirements and access needs. Individual users may opt for single-user licenses, while businesses requiring broader access may choose multi-user or enterprise licenses for cost-effective access to the report.
13. Are there any additional resources or data provided in the Embedded Insurance Market report?
While the report offers comprehensive insights, it's advisable to review the specific contents or supplementary materials provided to ascertain if additional resources or data are available.
14. How can I stay updated on further developments or reports in the Embedded Insurance Market?
To stay informed about further developments, trends, and reports in the Embedded Insurance Market, consider subscribing to industry newsletters, following relevant companies and organizations, or regularly checking reputable industry news sources and publications.
Methodology
Step 1 - Identification of Relevant Samples Size from Population Database


Step 2 - Approaches for Defining Global Market Size (Value, Volume* & Price*)

Note*: In applicable scenarios
Step 3 - Data Sources
Primary Research
- Web Analytics
- Survey Reports
- Research Institute
- Latest Research Reports
- Opinion Leaders
Secondary Research
- Annual Reports
- White Paper
- Latest Press Release
- Industry Association
- Paid Database
- Investor Presentations

Step 4 - Data Triangulation
Involves using different sources of information in order to increase the validity of a study
These sources are likely to be stakeholders in a program - participants, other researchers, program staff, other community members, and so on.
Then we put all data in single framework & apply various statistical tools to find out the dynamic on the market.
During the analysis stage, feedback from the stakeholder groups would be compared to determine areas of agreement as well as areas of divergence