

Key Insights
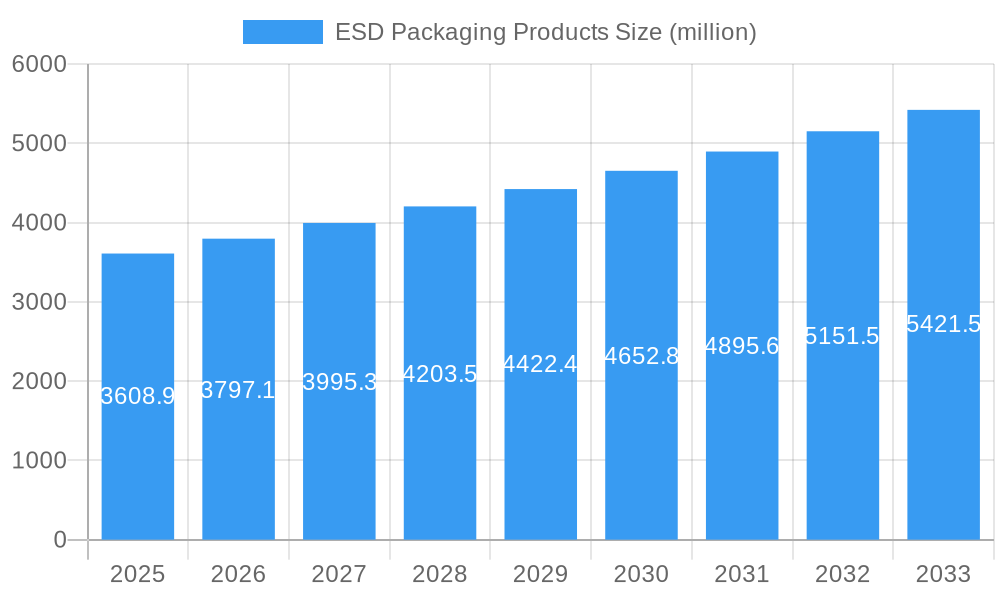
The global ESD packaging products market is poised for substantial growth, projected to reach $3608.9 million in 2025 with a healthy Compound Annual Growth Rate (CAGR) of 5.2% through 2033. This expansion is primarily fueled by the escalating demand from the electronic industry, driven by the continuous innovation and miniaturization of electronic components, making them increasingly susceptible to electrostatic discharge (ESD). The pharmaceutical industry also presents a significant growth avenue, as stringent regulations and the need for product integrity necessitate advanced ESD protective solutions for sensitive medications and medical devices. Furthermore, the chemical industry's requirement for safe handling and storage of electrostatically sensitive materials will contribute to market buoyancy. Emerging economies, particularly in the Asia Pacific region, are expected to be key growth drivers due to the burgeoning electronics manufacturing sector and increasing adoption of advanced packaging solutions.
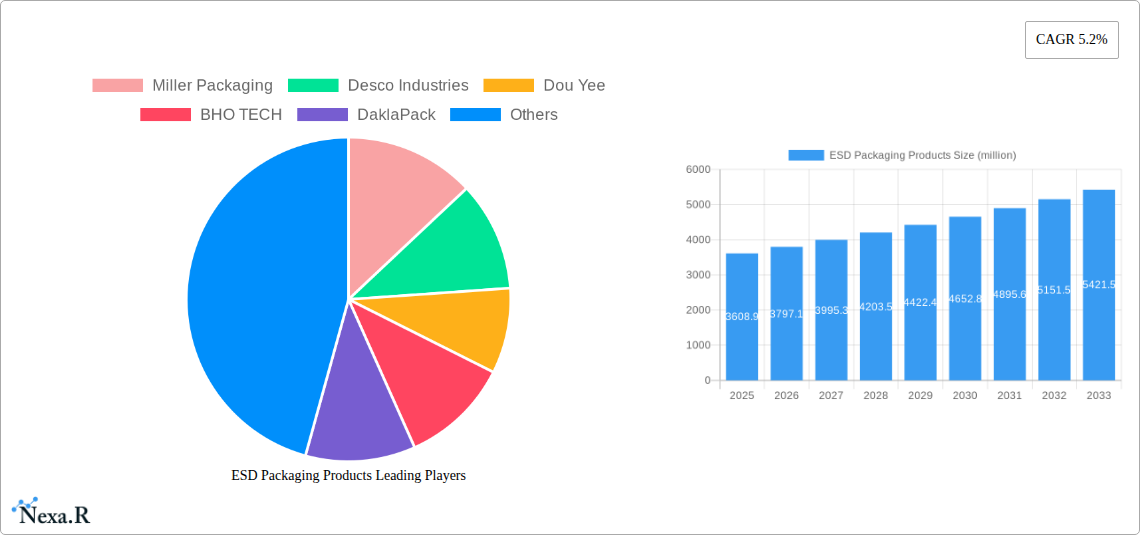
ESD Packaging Products Market Size (In Billion)
The market is segmented by application into the Electronic Industry, Chemical Industry, Pharmaceutical Industry, and Others, with the Electronic Industry dominating due to the widespread use of ESD-sensitive components. By type, Bags are anticipated to hold the largest market share, followed by Sponges, Grids, and Others. Leading players like Miller Packaging, Desco Industries, and Dou Yee are actively investing in research and development to offer innovative ESD packaging solutions that cater to evolving industry needs and regulatory standards. Restraints such as the high cost of specialized ESD packaging materials and potential volatility in raw material prices could slightly temper growth. However, the increasing awareness regarding the detrimental effects of ESD on electronic devices and pharmaceuticals, coupled with the development of more cost-effective and sustainable ESD packaging alternatives, will largely offset these challenges, ensuring a robust growth trajectory for the ESD packaging products market.
ESD Packaging Products Company Market Share
Unveiling the ESD Packaging Products Market: A Comprehensive Analysis (2019-2033)
This in-depth report offers a strategic examination of the global ESD Packaging Products market, providing critical insights for manufacturers, suppliers, and end-users. Covering the historical period from 2019 to 2024 and projecting growth through 2033, with a base and estimated year of 2025, this analysis delves into market dynamics, growth trends, regional dominance, product landscapes, key drivers, barriers, emerging opportunities, growth accelerators, and the competitive panorama. The report is structured to provide actionable intelligence for navigating the evolving demands of industries reliant on electrostatic discharge protection.
ESD Packaging Products Market Dynamics & Structure
The global ESD Packaging Products market exhibits a moderately concentrated structure, with key players investing heavily in technological advancements to meet stringent industry standards. Innovation in materials science, particularly in developing sustainable and highly effective static-dissipative and conductive solutions, serves as a primary driver. Regulatory frameworks, such as those governing the transportation of sensitive electronic components and hazardous chemicals, significantly influence product development and adoption. Competitive product substitutes, including alternative shielding technologies and robust packaging designs, present a constant challenge, necessitating continuous product differentiation and performance enhancement. End-user demographics are increasingly defined by the rapid growth of the electronics manufacturing sector, the expanding pharmaceutical industry's need for sterile and protected packaging, and the chemical industry's requirements for safe containment. Mergers and acquisitions (M&A) trends are evident, with larger entities acquiring smaller innovators to consolidate market share and expand their technological portfolios. For instance, an estimated 15 M&A deals occurred in the historical period (2019-2024), indicating strategic consolidation. Barriers to innovation include the high cost of R&D for advanced materials and the complexity of achieving certifications for specialized applications.
ESD Packaging Products Growth Trends & Insights
The ESD Packaging Products market is projected for robust expansion, driven by the escalating demand for protection against electrostatic discharge (ESD) in an increasingly digitized world. The market size is anticipated to grow from an estimated $7,500 million units in 2025 to $12,000 million units by 2033, exhibiting a Compound Annual Growth Rate (CAGR) of approximately 6.0% during the forecast period (2025-2033). This growth is underpinned by rising adoption rates across diverse industries, particularly within the burgeoning electronic industry, where the miniaturization of components and increased circuit density necessitate superior ESD protection. Technological disruptions, such as advancements in conductive polymers and multi-layer barrier films, are revolutionizing product performance and offering enhanced safeguarding capabilities. Consumer behavior shifts are also playing a pivotal role, with a growing emphasis on product integrity and reliability, compelling businesses to invest in premium packaging solutions. The penetration of ESD packaging products is projected to reach 75% in the high-value electronics segment by 2033. The expanding e-commerce landscape, with its inherent challenges in product handling and transit, further fuels the demand for protective ESD packaging. The pharmaceutical sector's stringent requirements for sterile and contamination-free packaging for sensitive drugs and medical devices also contributes significantly to market growth.
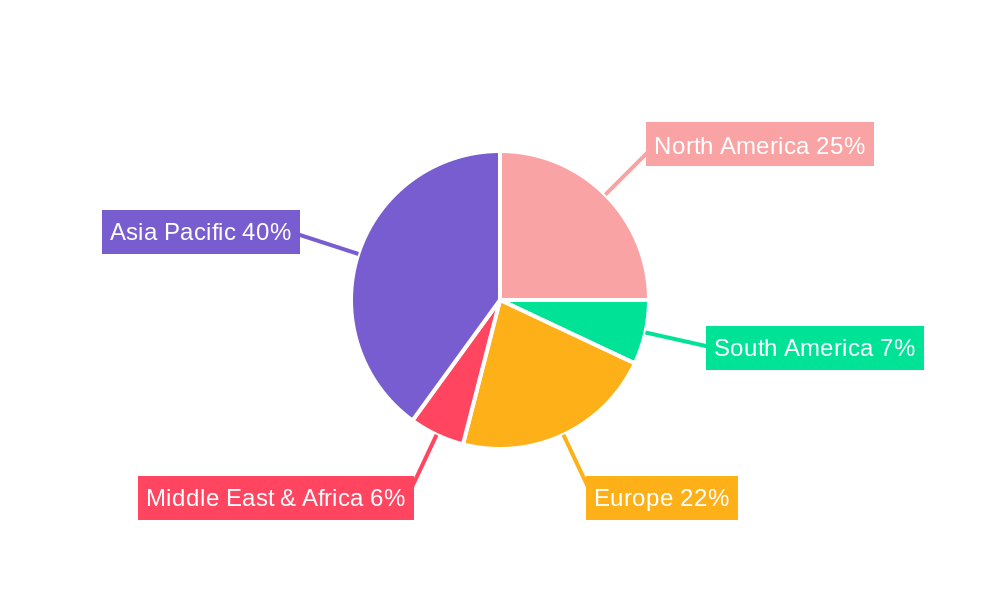
Dominant Regions, Countries, or Segments in ESD Packaging Products
The Electronic Industry segment, within the Application category, is unequivocally the dominant force driving growth in the global ESD Packaging Products market. This dominance stems from the inherent susceptibility of electronic components to electrostatic discharge, which can lead to catastrophic failures and significant financial losses. The relentless pace of innovation in consumer electronics, automotive electronics, and industrial automation fuels a constant demand for advanced ESD protection solutions. The market share attributed to the electronic industry in ESD packaging is estimated at a substantial 65% of the total market in 2025. Key drivers for this segment's supremacy include supportive government policies promoting electronics manufacturing and R&D, coupled with significant investments in advanced manufacturing infrastructure across leading economies.
- Asia Pacific emerges as the leading region, propelled by its status as a global manufacturing hub for electronics. Countries like China, South Korea, Taiwan, and Japan are at the forefront of this demand, housing major electronics manufacturers and semiconductor fabrication plants. The presence of robust supply chains and a conducive business environment further amplifies the region's influence.
- North America, particularly the United States, remains a significant market due to its advanced semiconductor industry, significant presence of aerospace and defense sectors, and stringent quality control standards that mandate high levels of ESD protection.
- The Chemical Industry and Pharmaceutical Industry represent substantial, albeit secondary, markets. The chemical sector requires ESD packaging to prevent ignition risks associated with flammable materials, while the pharmaceutical sector demands it to protect sensitive drug formulations and medical devices from contamination and degradation. The "Others" application segment, encompassing industries like telecommunications and defense, also contributes to market diversification.
Within the Types of ESD Packaging Products, Bags hold the largest market share, estimated at 50% in 2025, owing to their versatility, cost-effectiveness, and ease of use for individual component protection. Sponges and grids are crucial for internal cushioning and component separation, while "Others," including specialized trays and clamshells, cater to niche applications. The growth potential within these segments is intrinsically linked to the specific needs of the dominant electronic industry, with ongoing innovation in bag materials to offer enhanced barrier properties and conductivity.
ESD Packaging Products Product Landscape
The ESD Packaging Products market is characterized by continuous product innovation focused on enhancing static dissipation, shielding capabilities, and environmental sustainability. Novel materials, such as advanced conductive polymers and multilayered barrier films, are being developed to offer superior protection against electrostatic discharge and electromagnetic interference. Applications span from individual component bags for sensitive semiconductors to larger protective solutions for finished electronic goods. Performance metrics are increasingly defined by surface resistivity, shielding effectiveness, and antistatic decay times. Unique selling propositions often revolve around improved material durability, reduced weight, and enhanced recyclability, aligning with growing industry demands for eco-friendly solutions. Technological advancements are leading to specialized products like self-healing ESD materials and smart packaging with embedded ESD indicators.
Key Drivers, Barriers & Challenges in ESD Packaging Products
The ESD Packaging Products market is propelled by several key drivers, most notably the escalating demand for sensitive electronic components, the growing complexity of semiconductor designs, and the stringent quality control requirements across industries. Technological advancements in materials science, leading to more effective and sustainable ESD solutions, also serve as a significant growth catalyst. Furthermore, increasing awareness of the detrimental effects of ESD and the associated financial losses encourages proactive protective measures.
Conversely, the market faces several barriers and challenges. The high cost of advanced ESD-resistant materials can be a restraint for smaller enterprises. Regulatory hurdles and the need for specialized certifications for certain applications can slow down product adoption. Supply chain disruptions, particularly for raw materials, can impact production and lead times. Competitive pressures from alternative packaging methods and the constant need for innovation to stay ahead of technological obsolescence also pose significant challenges.
Emerging Opportunities in ESD Packaging Products
Emerging opportunities within the ESD Packaging Products sector lie in the development of bio-based and biodegradable ESD materials, catering to the growing demand for sustainable packaging solutions. The expansion of the electric vehicle (EV) market, with its increasing reliance on complex electronic systems, presents a significant untapped market for specialized ESD packaging. Furthermore, the integration of smart technologies into packaging, such as embedded sensors for monitoring ESD events, offers innovative applications. The growing trend towards localized manufacturing and supply chain resilience will also create opportunities for regional ESD packaging providers.
Growth Accelerators in the ESD Packaging Products Industry
Catalysts driving long-term growth in the ESD Packaging Products industry include continuous breakthroughs in nanotechnology for enhanced conductive properties and the strategic partnerships between material manufacturers and packaging converters. Market expansion into emerging economies with rapidly developing electronics manufacturing sectors represents another significant growth accelerator. Furthermore, the increasing adoption of industry-wide standards and certifications for ESD protection will standardize demand and encourage investment in advanced solutions. The evolving landscape of 5G technology and its associated infrastructure also demands higher levels of ESD protection for its sensitive components, further fueling market growth.
Key Players Shaping the ESD Packaging Products Market
- Miller Packaging
- Desco Industries
- Dou Yee
- BHO TECH
- DaklaPack
- Sharp Packaging Systems
- Mil-Spec Packaging
- Polyplus Packaging
- Pall Corporation
- TIP Corporation
- Kao Chia
- Selen Science & Technology
- TA&A
- Sanwei Antistatic
- Btree Industry
- ACE ESD(Shanghai)
- Junyue New Material
- Betpak Packaging
- Heyi Packaging
Notable Milestones in ESD Packaging Products Sector
- 2019: Increased investment in R&D for novel conductive polymer formulations to enhance ESD shielding.
- 2020: Introduction of biodegradable ESD bag options to address environmental concerns.
- 2021: Significant growth in demand for ESD packaging for 5G infrastructure components.
- 2022: Major acquisition of a specialized ESD material producer by a larger packaging conglomerate.
- 2023: Development of multi-layer ESD films with improved barrier properties and puncture resistance.
- 2024: Increased focus on smart ESD packaging solutions with integrated monitoring capabilities.
In-Depth ESD Packaging Products Market Outlook
The future market potential for ESD Packaging Products remains exceptionally bright, driven by the relentless evolution of the electronics industry and the increasing awareness of ESD's impact. Growth accelerators will continue to be fueled by technological innovation, particularly in sustainable materials and smart packaging solutions. Strategic opportunities exist in catering to the burgeoning electric vehicle market and expanding into developing economies. Companies that can offer a combination of high-performance, cost-effectiveness, and environmental responsibility will be best positioned for sustained success in this dynamic and critical sector.
ESD Packaging Products Segmentation
-
1. Application
- 1.1. Electronic Industry
- 1.2. Chemical Industry
- 1.3. Pharmaceutical Industry
- 1.4. Others
-
2. Types
- 2.1. Bag
- 2.2. Sponge
- 2.3. Grid
- 2.4. Others
ESD Packaging Products Segmentation By Geography
-
1. North America
- 1.1. United States
- 1.2. Canada
- 1.3. Mexico
-
2. South America
- 2.1. Brazil
- 2.2. Argentina
- 2.3. Rest of South America
-
3. Europe
- 3.1. United Kingdom
- 3.2. Germany
- 3.3. France
- 3.4. Italy
- 3.5. Spain
- 3.6. Russia
- 3.7. Benelux
- 3.8. Nordics
- 3.9. Rest of Europe
-
4. Middle East & Africa
- 4.1. Turkey
- 4.2. Israel
- 4.3. GCC
- 4.4. North Africa
- 4.5. South Africa
- 4.6. Rest of Middle East & Africa
-
5. Asia Pacific
- 5.1. China
- 5.2. India
- 5.3. Japan
- 5.4. South Korea
- 5.5. ASEAN
- 5.6. Oceania
- 5.7. Rest of Asia Pacific
ESD Packaging Products Regional Market Share
Geographic Coverage of ESD Packaging Products
ESD Packaging Products REPORT HIGHLIGHTS
| Aspects | Details |
|---|---|
| Study Period | 2020-2034 |
| Base Year | 2025 |
| Estimated Year | 2026 |
| Forecast Period | 2026-2034 |
| Historical Period | 2020-2025 |
| Growth Rate | CAGR of 5.2% from 2020-2034 |
| Segmentation |
|
Table of Contents
- 1. Introduction
- 1.1. Research Scope
- 1.2. Market Segmentation
- 1.3. Research Objective
- 1.4. Definitions and Assumptions
- 2. Executive Summary
- 2.1. Market Snapshot
- 3. Market Dynamics
- 3.1. Market Drivers
- 3.2. Market Restrains
- 3.3. Market Trends
- 3.4. Market Opportunities
- 4. Market Factor Analysis
- 4.1. Porters Five Forces
- 4.1.1. Bargaining Power of Suppliers
- 4.1.2. Bargaining Power of Buyers
- 4.1.3. Threat of New Entrants
- 4.1.4. Threat of Substitutes
- 4.1.5. Competitive Rivalry
- 4.2. PESTEL analysis
- 4.3. BCG Analysis
- 4.3.1. Stars (High Growth, High Market Share)
- 4.3.2. Cash Cows (Low Growth, High Market Share)
- 4.3.3. Question Mark (High Growth, Low Market Share)
- 4.3.4. Dogs (Low Growth, Low Market Share)
- 4.4. Ansoff Matrix Analysis
- 4.5. Supply Chain Analysis
- 4.6. Regulatory Landscape
- 4.7. Current Market Potential and Opportunity Assessment (TAM–SAM–SOM Framework)
- 4.8. NRP Analyst Note
- 4.1. Porters Five Forces
- 5. Market Analysis, Insights and Forecast 2021-2033
- 5.1. Market Analysis, Insights and Forecast - by Application
- 5.1.1. Electronic Industry
- 5.1.2. Chemical Industry
- 5.1.3. Pharmaceutical Industry
- 5.1.4. Others
- 5.2. Market Analysis, Insights and Forecast - by Types
- 5.2.1. Bag
- 5.2.2. Sponge
- 5.2.3. Grid
- 5.2.4. Others
- 5.3. Market Analysis, Insights and Forecast - by Region
- 5.3.1. North America
- 5.3.2. South America
- 5.3.3. Europe
- 5.3.4. Middle East & Africa
- 5.3.5. Asia Pacific
- 5.1. Market Analysis, Insights and Forecast - by Application
- 6. Global ESD Packaging Products Analysis, Insights and Forecast, 2021-2033
- 6.1. Market Analysis, Insights and Forecast - by Application
- 6.1.1. Electronic Industry
- 6.1.2. Chemical Industry
- 6.1.3. Pharmaceutical Industry
- 6.1.4. Others
- 6.2. Market Analysis, Insights and Forecast - by Types
- 6.2.1. Bag
- 6.2.2. Sponge
- 6.2.3. Grid
- 6.2.4. Others
- 6.1. Market Analysis, Insights and Forecast - by Application
- 7. North America ESD Packaging Products Analysis, Insights and Forecast, 2020-2032
- 7.1. Market Analysis, Insights and Forecast - by Application
- 7.1.1. Electronic Industry
- 7.1.2. Chemical Industry
- 7.1.3. Pharmaceutical Industry
- 7.1.4. Others
- 7.2. Market Analysis, Insights and Forecast - by Types
- 7.2.1. Bag
- 7.2.2. Sponge
- 7.2.3. Grid
- 7.2.4. Others
- 7.1. Market Analysis, Insights and Forecast - by Application
- 8. South America ESD Packaging Products Analysis, Insights and Forecast, 2020-2032
- 8.1. Market Analysis, Insights and Forecast - by Application
- 8.1.1. Electronic Industry
- 8.1.2. Chemical Industry
- 8.1.3. Pharmaceutical Industry
- 8.1.4. Others
- 8.2. Market Analysis, Insights and Forecast - by Types
- 8.2.1. Bag
- 8.2.2. Sponge
- 8.2.3. Grid
- 8.2.4. Others
- 8.1. Market Analysis, Insights and Forecast - by Application
- 9. Europe ESD Packaging Products Analysis, Insights and Forecast, 2020-2032
- 9.1. Market Analysis, Insights and Forecast - by Application
- 9.1.1. Electronic Industry
- 9.1.2. Chemical Industry
- 9.1.3. Pharmaceutical Industry
- 9.1.4. Others
- 9.2. Market Analysis, Insights and Forecast - by Types
- 9.2.1. Bag
- 9.2.2. Sponge
- 9.2.3. Grid
- 9.2.4. Others
- 9.1. Market Analysis, Insights and Forecast - by Application
- 10. Middle East & Africa ESD Packaging Products Analysis, Insights and Forecast, 2020-2032
- 10.1. Market Analysis, Insights and Forecast - by Application
- 10.1.1. Electronic Industry
- 10.1.2. Chemical Industry
- 10.1.3. Pharmaceutical Industry
- 10.1.4. Others
- 10.2. Market Analysis, Insights and Forecast - by Types
- 10.2.1. Bag
- 10.2.2. Sponge
- 10.2.3. Grid
- 10.2.4. Others
- 10.1. Market Analysis, Insights and Forecast - by Application
- 11. Asia Pacific ESD Packaging Products Analysis, Insights and Forecast, 2020-2032
- 11.1. Market Analysis, Insights and Forecast - by Application
- 11.1.1. Electronic Industry
- 11.1.2. Chemical Industry
- 11.1.3. Pharmaceutical Industry
- 11.1.4. Others
- 11.2. Market Analysis, Insights and Forecast - by Types
- 11.2.1. Bag
- 11.2.2. Sponge
- 11.2.3. Grid
- 11.2.4. Others
- 11.1. Market Analysis, Insights and Forecast - by Application
- 12. Competitive Analysis
- 12.1. Company Profiles
- 12.1.1 Miller Packaging
- 12.1.1.1. Company Overview
- 12.1.1.2. Products
- 12.1.1.3. Company Financials
- 12.1.1.4. SWOT Analysis
- 12.1.2 Desco Industries
- 12.1.2.1. Company Overview
- 12.1.2.2. Products
- 12.1.2.3. Company Financials
- 12.1.2.4. SWOT Analysis
- 12.1.3 Dou Yee
- 12.1.3.1. Company Overview
- 12.1.3.2. Products
- 12.1.3.3. Company Financials
- 12.1.3.4. SWOT Analysis
- 12.1.4 BHO TECH
- 12.1.4.1. Company Overview
- 12.1.4.2. Products
- 12.1.4.3. Company Financials
- 12.1.4.4. SWOT Analysis
- 12.1.5 DaklaPack
- 12.1.5.1. Company Overview
- 12.1.5.2. Products
- 12.1.5.3. Company Financials
- 12.1.5.4. SWOT Analysis
- 12.1.6 Sharp Packaging Systems
- 12.1.6.1. Company Overview
- 12.1.6.2. Products
- 12.1.6.3. Company Financials
- 12.1.6.4. SWOT Analysis
- 12.1.7 Mil-Spec Packaging
- 12.1.7.1. Company Overview
- 12.1.7.2. Products
- 12.1.7.3. Company Financials
- 12.1.7.4. SWOT Analysis
- 12.1.8 Polyplus Packaging
- 12.1.8.1. Company Overview
- 12.1.8.2. Products
- 12.1.8.3. Company Financials
- 12.1.8.4. SWOT Analysis
- 12.1.9 Pall Corporation
- 12.1.9.1. Company Overview
- 12.1.9.2. Products
- 12.1.9.3. Company Financials
- 12.1.9.4. SWOT Analysis
- 12.1.10 TIP Corporation
- 12.1.10.1. Company Overview
- 12.1.10.2. Products
- 12.1.10.3. Company Financials
- 12.1.10.4. SWOT Analysis
- 12.1.11 Kao Chia
- 12.1.11.1. Company Overview
- 12.1.11.2. Products
- 12.1.11.3. Company Financials
- 12.1.11.4. SWOT Analysis
- 12.1.12 Selen Science & Technology
- 12.1.12.1. Company Overview
- 12.1.12.2. Products
- 12.1.12.3. Company Financials
- 12.1.12.4. SWOT Analysis
- 12.1.13 TA&A
- 12.1.13.1. Company Overview
- 12.1.13.2. Products
- 12.1.13.3. Company Financials
- 12.1.13.4. SWOT Analysis
- 12.1.14 Sanwei Antistatic
- 12.1.14.1. Company Overview
- 12.1.14.2. Products
- 12.1.14.3. Company Financials
- 12.1.14.4. SWOT Analysis
- 12.1.15 Btree Industry
- 12.1.15.1. Company Overview
- 12.1.15.2. Products
- 12.1.15.3. Company Financials
- 12.1.15.4. SWOT Analysis
- 12.1.16 ACE ESD(Shanghai)
- 12.1.16.1. Company Overview
- 12.1.16.2. Products
- 12.1.16.3. Company Financials
- 12.1.16.4. SWOT Analysis
- 12.1.17 Junyue New Material
- 12.1.17.1. Company Overview
- 12.1.17.2. Products
- 12.1.17.3. Company Financials
- 12.1.17.4. SWOT Analysis
- 12.1.18 Betpak Packaging
- 12.1.18.1. Company Overview
- 12.1.18.2. Products
- 12.1.18.3. Company Financials
- 12.1.18.4. SWOT Analysis
- 12.1.19 Heyi Packaging
- 12.1.19.1. Company Overview
- 12.1.19.2. Products
- 12.1.19.3. Company Financials
- 12.1.19.4. SWOT Analysis
- 12.1.1 Miller Packaging
- 12.2. Market Entropy
- 12.2.1 Company's Key Areas Served
- 12.2.2 Recent Developments
- 12.3. Company Market Share Analysis 2025
- 12.3.1 Top 5 Companies Market Share Analysis
- 12.3.2 Top 3 Companies Market Share Analysis
- 12.4. List of Potential Customers
- 13. Research Methodology
List of Figures
- Figure 1: Global ESD Packaging Products Revenue Breakdown (million, %) by Region 2025 & 2033
- Figure 2: Global ESD Packaging Products Volume Breakdown (K, %) by Region 2025 & 2033
- Figure 3: North America ESD Packaging Products Revenue (million), by Application 2025 & 2033
- Figure 4: North America ESD Packaging Products Volume (K), by Application 2025 & 2033
- Figure 5: North America ESD Packaging Products Revenue Share (%), by Application 2025 & 2033
- Figure 6: North America ESD Packaging Products Volume Share (%), by Application 2025 & 2033
- Figure 7: North America ESD Packaging Products Revenue (million), by Types 2025 & 2033
- Figure 8: North America ESD Packaging Products Volume (K), by Types 2025 & 2033
- Figure 9: North America ESD Packaging Products Revenue Share (%), by Types 2025 & 2033
- Figure 10: North America ESD Packaging Products Volume Share (%), by Types 2025 & 2033
- Figure 11: North America ESD Packaging Products Revenue (million), by Country 2025 & 2033
- Figure 12: North America ESD Packaging Products Volume (K), by Country 2025 & 2033
- Figure 13: North America ESD Packaging Products Revenue Share (%), by Country 2025 & 2033
- Figure 14: North America ESD Packaging Products Volume Share (%), by Country 2025 & 2033
- Figure 15: South America ESD Packaging Products Revenue (million), by Application 2025 & 2033
- Figure 16: South America ESD Packaging Products Volume (K), by Application 2025 & 2033
- Figure 17: South America ESD Packaging Products Revenue Share (%), by Application 2025 & 2033
- Figure 18: South America ESD Packaging Products Volume Share (%), by Application 2025 & 2033
- Figure 19: South America ESD Packaging Products Revenue (million), by Types 2025 & 2033
- Figure 20: South America ESD Packaging Products Volume (K), by Types 2025 & 2033
- Figure 21: South America ESD Packaging Products Revenue Share (%), by Types 2025 & 2033
- Figure 22: South America ESD Packaging Products Volume Share (%), by Types 2025 & 2033
- Figure 23: South America ESD Packaging Products Revenue (million), by Country 2025 & 2033
- Figure 24: South America ESD Packaging Products Volume (K), by Country 2025 & 2033
- Figure 25: South America ESD Packaging Products Revenue Share (%), by Country 2025 & 2033
- Figure 26: South America ESD Packaging Products Volume Share (%), by Country 2025 & 2033
- Figure 27: Europe ESD Packaging Products Revenue (million), by Application 2025 & 2033
- Figure 28: Europe ESD Packaging Products Volume (K), by Application 2025 & 2033
- Figure 29: Europe ESD Packaging Products Revenue Share (%), by Application 2025 & 2033
- Figure 30: Europe ESD Packaging Products Volume Share (%), by Application 2025 & 2033
- Figure 31: Europe ESD Packaging Products Revenue (million), by Types 2025 & 2033
- Figure 32: Europe ESD Packaging Products Volume (K), by Types 2025 & 2033
- Figure 33: Europe ESD Packaging Products Revenue Share (%), by Types 2025 & 2033
- Figure 34: Europe ESD Packaging Products Volume Share (%), by Types 2025 & 2033
- Figure 35: Europe ESD Packaging Products Revenue (million), by Country 2025 & 2033
- Figure 36: Europe ESD Packaging Products Volume (K), by Country 2025 & 2033
- Figure 37: Europe ESD Packaging Products Revenue Share (%), by Country 2025 & 2033
- Figure 38: Europe ESD Packaging Products Volume Share (%), by Country 2025 & 2033
- Figure 39: Middle East & Africa ESD Packaging Products Revenue (million), by Application 2025 & 2033
- Figure 40: Middle East & Africa ESD Packaging Products Volume (K), by Application 2025 & 2033
- Figure 41: Middle East & Africa ESD Packaging Products Revenue Share (%), by Application 2025 & 2033
- Figure 42: Middle East & Africa ESD Packaging Products Volume Share (%), by Application 2025 & 2033
- Figure 43: Middle East & Africa ESD Packaging Products Revenue (million), by Types 2025 & 2033
- Figure 44: Middle East & Africa ESD Packaging Products Volume (K), by Types 2025 & 2033
- Figure 45: Middle East & Africa ESD Packaging Products Revenue Share (%), by Types 2025 & 2033
- Figure 46: Middle East & Africa ESD Packaging Products Volume Share (%), by Types 2025 & 2033
- Figure 47: Middle East & Africa ESD Packaging Products Revenue (million), by Country 2025 & 2033
- Figure 48: Middle East & Africa ESD Packaging Products Volume (K), by Country 2025 & 2033
- Figure 49: Middle East & Africa ESD Packaging Products Revenue Share (%), by Country 2025 & 2033
- Figure 50: Middle East & Africa ESD Packaging Products Volume Share (%), by Country 2025 & 2033
- Figure 51: Asia Pacific ESD Packaging Products Revenue (million), by Application 2025 & 2033
- Figure 52: Asia Pacific ESD Packaging Products Volume (K), by Application 2025 & 2033
- Figure 53: Asia Pacific ESD Packaging Products Revenue Share (%), by Application 2025 & 2033
- Figure 54: Asia Pacific ESD Packaging Products Volume Share (%), by Application 2025 & 2033
- Figure 55: Asia Pacific ESD Packaging Products Revenue (million), by Types 2025 & 2033
- Figure 56: Asia Pacific ESD Packaging Products Volume (K), by Types 2025 & 2033
- Figure 57: Asia Pacific ESD Packaging Products Revenue Share (%), by Types 2025 & 2033
- Figure 58: Asia Pacific ESD Packaging Products Volume Share (%), by Types 2025 & 2033
- Figure 59: Asia Pacific ESD Packaging Products Revenue (million), by Country 2025 & 2033
- Figure 60: Asia Pacific ESD Packaging Products Volume (K), by Country 2025 & 2033
- Figure 61: Asia Pacific ESD Packaging Products Revenue Share (%), by Country 2025 & 2033
- Figure 62: Asia Pacific ESD Packaging Products Volume Share (%), by Country 2025 & 2033
List of Tables
- Table 1: Global ESD Packaging Products Revenue million Forecast, by Application 2020 & 2033
- Table 2: Global ESD Packaging Products Volume K Forecast, by Application 2020 & 2033
- Table 3: Global ESD Packaging Products Revenue million Forecast, by Types 2020 & 2033
- Table 4: Global ESD Packaging Products Volume K Forecast, by Types 2020 & 2033
- Table 5: Global ESD Packaging Products Revenue million Forecast, by Region 2020 & 2033
- Table 6: Global ESD Packaging Products Volume K Forecast, by Region 2020 & 2033
- Table 7: Global ESD Packaging Products Revenue million Forecast, by Application 2020 & 2033
- Table 8: Global ESD Packaging Products Volume K Forecast, by Application 2020 & 2033
- Table 9: Global ESD Packaging Products Revenue million Forecast, by Types 2020 & 2033
- Table 10: Global ESD Packaging Products Volume K Forecast, by Types 2020 & 2033
- Table 11: Global ESD Packaging Products Revenue million Forecast, by Country 2020 & 2033
- Table 12: Global ESD Packaging Products Volume K Forecast, by Country 2020 & 2033
- Table 13: United States ESD Packaging Products Revenue (million) Forecast, by Application 2020 & 2033
- Table 14: United States ESD Packaging Products Volume (K) Forecast, by Application 2020 & 2033
- Table 15: Canada ESD Packaging Products Revenue (million) Forecast, by Application 2020 & 2033
- Table 16: Canada ESD Packaging Products Volume (K) Forecast, by Application 2020 & 2033
- Table 17: Mexico ESD Packaging Products Revenue (million) Forecast, by Application 2020 & 2033
- Table 18: Mexico ESD Packaging Products Volume (K) Forecast, by Application 2020 & 2033
- Table 19: Global ESD Packaging Products Revenue million Forecast, by Application 2020 & 2033
- Table 20: Global ESD Packaging Products Volume K Forecast, by Application 2020 & 2033
- Table 21: Global ESD Packaging Products Revenue million Forecast, by Types 2020 & 2033
- Table 22: Global ESD Packaging Products Volume K Forecast, by Types 2020 & 2033
- Table 23: Global ESD Packaging Products Revenue million Forecast, by Country 2020 & 2033
- Table 24: Global ESD Packaging Products Volume K Forecast, by Country 2020 & 2033
- Table 25: Brazil ESD Packaging Products Revenue (million) Forecast, by Application 2020 & 2033
- Table 26: Brazil ESD Packaging Products Volume (K) Forecast, by Application 2020 & 2033
- Table 27: Argentina ESD Packaging Products Revenue (million) Forecast, by Application 2020 & 2033
- Table 28: Argentina ESD Packaging Products Volume (K) Forecast, by Application 2020 & 2033
- Table 29: Rest of South America ESD Packaging Products Revenue (million) Forecast, by Application 2020 & 2033
- Table 30: Rest of South America ESD Packaging Products Volume (K) Forecast, by Application 2020 & 2033
- Table 31: Global ESD Packaging Products Revenue million Forecast, by Application 2020 & 2033
- Table 32: Global ESD Packaging Products Volume K Forecast, by Application 2020 & 2033
- Table 33: Global ESD Packaging Products Revenue million Forecast, by Types 2020 & 2033
- Table 34: Global ESD Packaging Products Volume K Forecast, by Types 2020 & 2033
- Table 35: Global ESD Packaging Products Revenue million Forecast, by Country 2020 & 2033
- Table 36: Global ESD Packaging Products Volume K Forecast, by Country 2020 & 2033
- Table 37: United Kingdom ESD Packaging Products Revenue (million) Forecast, by Application 2020 & 2033
- Table 38: United Kingdom ESD Packaging Products Volume (K) Forecast, by Application 2020 & 2033
- Table 39: Germany ESD Packaging Products Revenue (million) Forecast, by Application 2020 & 2033
- Table 40: Germany ESD Packaging Products Volume (K) Forecast, by Application 2020 & 2033
- Table 41: France ESD Packaging Products Revenue (million) Forecast, by Application 2020 & 2033
- Table 42: France ESD Packaging Products Volume (K) Forecast, by Application 2020 & 2033
- Table 43: Italy ESD Packaging Products Revenue (million) Forecast, by Application 2020 & 2033
- Table 44: Italy ESD Packaging Products Volume (K) Forecast, by Application 2020 & 2033
- Table 45: Spain ESD Packaging Products Revenue (million) Forecast, by Application 2020 & 2033
- Table 46: Spain ESD Packaging Products Volume (K) Forecast, by Application 2020 & 2033
- Table 47: Russia ESD Packaging Products Revenue (million) Forecast, by Application 2020 & 2033
- Table 48: Russia ESD Packaging Products Volume (K) Forecast, by Application 2020 & 2033
- Table 49: Benelux ESD Packaging Products Revenue (million) Forecast, by Application 2020 & 2033
- Table 50: Benelux ESD Packaging Products Volume (K) Forecast, by Application 2020 & 2033
- Table 51: Nordics ESD Packaging Products Revenue (million) Forecast, by Application 2020 & 2033
- Table 52: Nordics ESD Packaging Products Volume (K) Forecast, by Application 2020 & 2033
- Table 53: Rest of Europe ESD Packaging Products Revenue (million) Forecast, by Application 2020 & 2033
- Table 54: Rest of Europe ESD Packaging Products Volume (K) Forecast, by Application 2020 & 2033
- Table 55: Global ESD Packaging Products Revenue million Forecast, by Application 2020 & 2033
- Table 56: Global ESD Packaging Products Volume K Forecast, by Application 2020 & 2033
- Table 57: Global ESD Packaging Products Revenue million Forecast, by Types 2020 & 2033
- Table 58: Global ESD Packaging Products Volume K Forecast, by Types 2020 & 2033
- Table 59: Global ESD Packaging Products Revenue million Forecast, by Country 2020 & 2033
- Table 60: Global ESD Packaging Products Volume K Forecast, by Country 2020 & 2033
- Table 61: Turkey ESD Packaging Products Revenue (million) Forecast, by Application 2020 & 2033
- Table 62: Turkey ESD Packaging Products Volume (K) Forecast, by Application 2020 & 2033
- Table 63: Israel ESD Packaging Products Revenue (million) Forecast, by Application 2020 & 2033
- Table 64: Israel ESD Packaging Products Volume (K) Forecast, by Application 2020 & 2033
- Table 65: GCC ESD Packaging Products Revenue (million) Forecast, by Application 2020 & 2033
- Table 66: GCC ESD Packaging Products Volume (K) Forecast, by Application 2020 & 2033
- Table 67: North Africa ESD Packaging Products Revenue (million) Forecast, by Application 2020 & 2033
- Table 68: North Africa ESD Packaging Products Volume (K) Forecast, by Application 2020 & 2033
- Table 69: South Africa ESD Packaging Products Revenue (million) Forecast, by Application 2020 & 2033
- Table 70: South Africa ESD Packaging Products Volume (K) Forecast, by Application 2020 & 2033
- Table 71: Rest of Middle East & Africa ESD Packaging Products Revenue (million) Forecast, by Application 2020 & 2033
- Table 72: Rest of Middle East & Africa ESD Packaging Products Volume (K) Forecast, by Application 2020 & 2033
- Table 73: Global ESD Packaging Products Revenue million Forecast, by Application 2020 & 2033
- Table 74: Global ESD Packaging Products Volume K Forecast, by Application 2020 & 2033
- Table 75: Global ESD Packaging Products Revenue million Forecast, by Types 2020 & 2033
- Table 76: Global ESD Packaging Products Volume K Forecast, by Types 2020 & 2033
- Table 77: Global ESD Packaging Products Revenue million Forecast, by Country 2020 & 2033
- Table 78: Global ESD Packaging Products Volume K Forecast, by Country 2020 & 2033
- Table 79: China ESD Packaging Products Revenue (million) Forecast, by Application 2020 & 2033
- Table 80: China ESD Packaging Products Volume (K) Forecast, by Application 2020 & 2033
- Table 81: India ESD Packaging Products Revenue (million) Forecast, by Application 2020 & 2033
- Table 82: India ESD Packaging Products Volume (K) Forecast, by Application 2020 & 2033
- Table 83: Japan ESD Packaging Products Revenue (million) Forecast, by Application 2020 & 2033
- Table 84: Japan ESD Packaging Products Volume (K) Forecast, by Application 2020 & 2033
- Table 85: South Korea ESD Packaging Products Revenue (million) Forecast, by Application 2020 & 2033
- Table 86: South Korea ESD Packaging Products Volume (K) Forecast, by Application 2020 & 2033
- Table 87: ASEAN ESD Packaging Products Revenue (million) Forecast, by Application 2020 & 2033
- Table 88: ASEAN ESD Packaging Products Volume (K) Forecast, by Application 2020 & 2033
- Table 89: Oceania ESD Packaging Products Revenue (million) Forecast, by Application 2020 & 2033
- Table 90: Oceania ESD Packaging Products Volume (K) Forecast, by Application 2020 & 2033
- Table 91: Rest of Asia Pacific ESD Packaging Products Revenue (million) Forecast, by Application 2020 & 2033
- Table 92: Rest of Asia Pacific ESD Packaging Products Volume (K) Forecast, by Application 2020 & 2033
Frequently Asked Questions
1. What is the projected Compound Annual Growth Rate (CAGR) of the ESD Packaging Products?
The projected CAGR is approximately 5.2%.
2. Which companies are prominent players in the ESD Packaging Products?
Key companies in the market include Miller Packaging, Desco Industries, Dou Yee, BHO TECH, DaklaPack, Sharp Packaging Systems, Mil-Spec Packaging, Polyplus Packaging, Pall Corporation, TIP Corporation, Kao Chia, Selen Science & Technology, TA&A, Sanwei Antistatic, Btree Industry, ACE ESD(Shanghai), Junyue New Material, Betpak Packaging, Heyi Packaging.
3. What are the main segments of the ESD Packaging Products?
The market segments include Application, Types.
4. Can you provide details about the market size?
The market size is estimated to be USD 3608.9 million as of 2022.
5. What are some drivers contributing to market growth?
N/A
6. What are the notable trends driving market growth?
N/A
7. Are there any restraints impacting market growth?
N/A
8. Can you provide examples of recent developments in the market?
N/A
9. What pricing options are available for accessing the report?
Pricing options include single-user, multi-user, and enterprise licenses priced at USD 3350.00, USD 5025.00, and USD 6700.00 respectively.
10. Is the market size provided in terms of value or volume?
The market size is provided in terms of value, measured in million and volume, measured in K.
11. Are there any specific market keywords associated with the report?
Yes, the market keyword associated with the report is "ESD Packaging Products," which aids in identifying and referencing the specific market segment covered.
12. How do I determine which pricing option suits my needs best?
The pricing options vary based on user requirements and access needs. Individual users may opt for single-user licenses, while businesses requiring broader access may choose multi-user or enterprise licenses for cost-effective access to the report.
13. Are there any additional resources or data provided in the ESD Packaging Products report?
While the report offers comprehensive insights, it's advisable to review the specific contents or supplementary materials provided to ascertain if additional resources or data are available.
14. How can I stay updated on further developments or reports in the ESD Packaging Products?
To stay informed about further developments, trends, and reports in the ESD Packaging Products, consider subscribing to industry newsletters, following relevant companies and organizations, or regularly checking reputable industry news sources and publications.
Methodology
Step 1 - Identification of Relevant Samples Size from Population Database


Step 2 - Approaches for Defining Global Market Size (Value, Volume* & Price*)

Note*: In applicable scenarios
Step 3 - Data Sources
Primary Research
- Web Analytics
- Survey Reports
- Research Institute
- Latest Research Reports
- Opinion Leaders
Secondary Research
- Annual Reports
- White Paper
- Latest Press Release
- Industry Association
- Paid Database
- Investor Presentations

Step 4 - Data Triangulation
Involves using different sources of information in order to increase the validity of a study
These sources are likely to be stakeholders in a program - participants, other researchers, program staff, other community members, and so on.
Then we put all data in single framework & apply various statistical tools to find out the dynamic on the market.
During the analysis stage, feedback from the stakeholder groups would be compared to determine areas of agreement as well as areas of divergence