

Key Insights
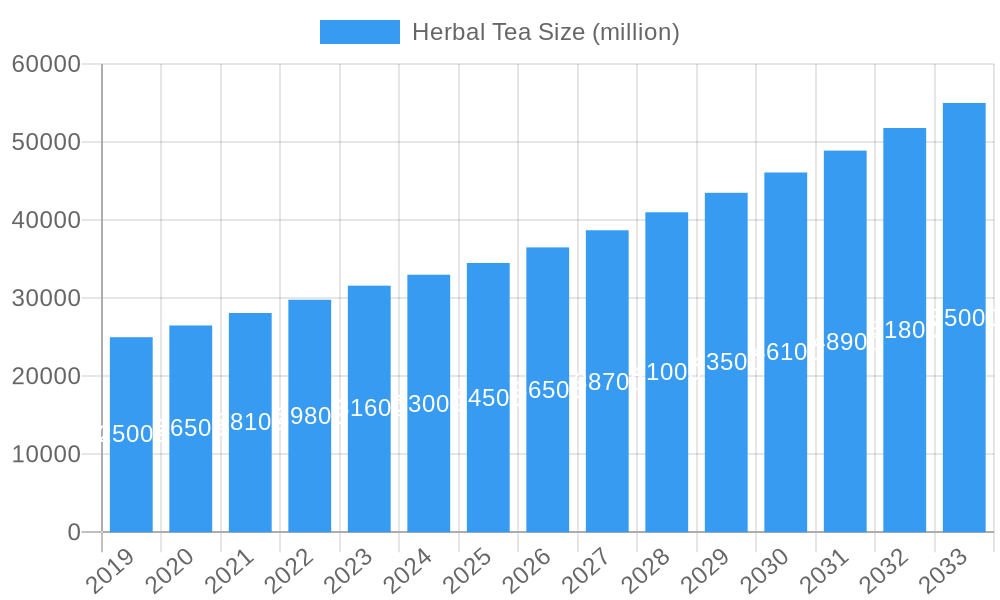
The global Herbal Tea market is experiencing robust growth, projected to reach a substantial market size of USD 55 billion by 2033, expanding at a Compound Annual Growth Rate (CAGR) of 6.5% from its estimated USD 33 billion in 2025. This upward trajectory is primarily propelled by a confluence of evolving consumer preferences towards healthier lifestyle choices, a heightened awareness of the natural health benefits associated with herbal infusions, and an increasing demand for diverse and innovative flavor profiles. The market is witnessing a significant surge in the consumption of herbal teas as consumers actively seek alternatives to sugary beverages and artificial additives. Furthermore, a growing emphasis on holistic well-being, stress reduction, and immune system support directly fuels the demand for specific herbal blends. The retail landscape is adapting to this trend with a proliferation of specialized herbal tea products, innovative packaging, and a stronger presence across various distribution channels, from large supermarkets to independent and specialist retailers.
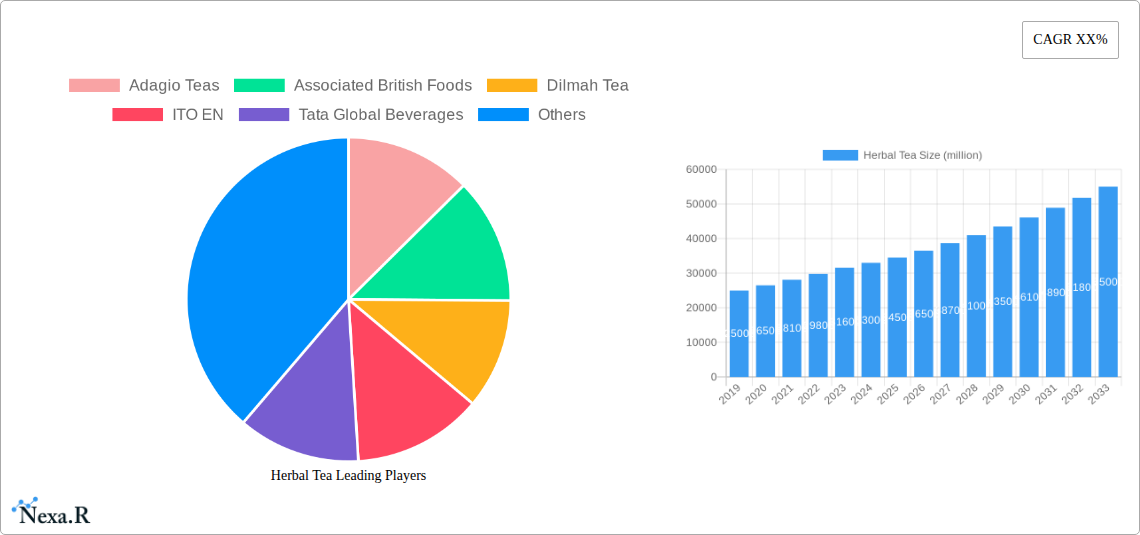
Herbal Tea Market Size (In Billion)
The market dynamics are further shaped by key drivers such as the rising disposable incomes in emerging economies, leading to greater purchasing power for premium and health-conscious products. Innovative product development, including functional herbal teas designed for specific health outcomes like sleep aid or digestive support, also plays a crucial role. However, challenges such as the fluctuating prices of raw herbs and intense competition from established players and new entrants pose potential restraints. The market segmentation reveals a balanced distribution across various applications, with Supermarkets and Hypermarkets leading in terms of volume, closely followed by Independent Retailers and Specialist Retailers catering to niche demands. Among the types, Green Tea continues to hold a significant share due to its perceived health benefits, while Black Tea remains a staple. The Asia Pacific region, driven by the large populations and increasing health consciousness in countries like China and India, is expected to emerge as a dominant force, with North America and Europe also demonstrating strong and consistent growth.
Herbal Tea Company Market Share
Herbal Tea Market Report: Dynamics, Growth, and Global Outlook (2019-2033)
This comprehensive report provides an in-depth analysis of the global herbal tea market, examining its intricate dynamics, growth trajectories, and future potential. Spanning from 2019 to 2033, with a base year of 2025, this study offers critical insights for industry professionals, stakeholders, and investors seeking to navigate this evolving and high-demand sector. We delve into market segmentation by application and type, highlighting regional dominance and key players that are shaping the landscape.
Herbal Tea Market Dynamics & Structure
The global herbal tea market is characterized by a moderate concentration, with key players like Associated British Foods, Tata Global Beverages, and Unilever holding significant market share. Technological innovation is primarily driven by the development of novel blends, functional ingredients, and sustainable sourcing practices. The regulatory framework for herbal teas varies by region, with a growing emphasis on product safety, labeling accuracy, and claims substantiation, particularly concerning health benefits. Competitive product substitutes include other functional beverages, dietary supplements, and traditional medicinal remedies. End-user demographics are increasingly diverse, encompassing health-conscious millennials, aging populations seeking natural remedies, and consumers exploring novel flavor profiles. Mergers and acquisitions (M&A) activity is a notable trend, as larger corporations seek to expand their portfolios and gain access to niche markets and innovative brands.
- Market Concentration: Moderate, with top players holding significant but not dominant shares.
- Technological Innovation: Focus on functional ingredients, unique flavor combinations, and eco-friendly packaging.
- Regulatory Frameworks: Increasing scrutiny on health claims and ingredient transparency.
- Competitive Product Substitutes: Functional beverages, fortified drinks, and traditional health tonics.
- End-User Demographics: Broad appeal across age groups, driven by health and wellness trends.
- M&A Trends: Strategic acquisitions to enhance product offerings and market reach, with approximately 5-7 significant deals projected annually.
Herbal Tea Growth Trends & Insights
The herbal tea market is poised for robust growth over the forecast period, driven by escalating consumer awareness of health and wellness. The global market size, valued at approximately $25,500 million in 2025, is projected to reach an impressive $39,800 million by 2033, exhibiting a compound annual growth rate (CAGR) of around 5.8% during the 2025–2033 period. Adoption rates are steadily increasing, fueled by the perception of herbal teas as natural, healthy alternatives to sugary beverages. Technological disruptions are minor but include advancements in extraction methods to preserve beneficial compounds and innovative brewing technologies for enhanced consumer convenience. Consumer behavior shifts are pivotal, with a growing preference for sustainably sourced, ethically produced, and personalized herbal tea experiences. The historical period (2019–2024) witnessed a steady upward trajectory, with market penetration reaching approximately 35% of the global beverage market by the end of 2024. The base year 2025 signifies a strong foundation for this anticipated expansion.
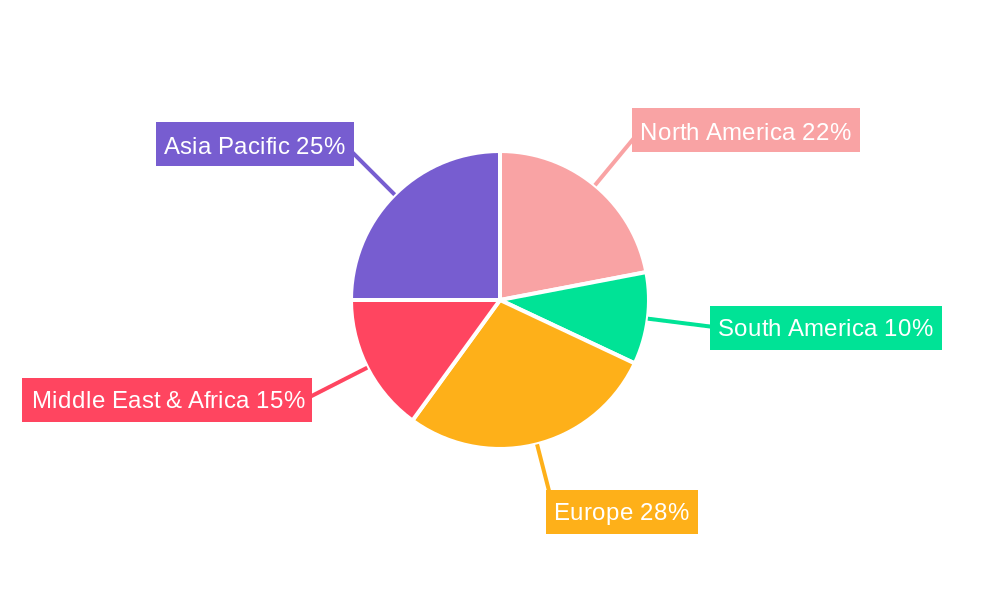
Dominant Regions, Countries, or Segments in Herbal Tea
The Supermarkets and Hypermarkets segment is a dominant force within the herbal tea market's application landscape, driven by wide accessibility and diverse product offerings. This segment is estimated to hold approximately 45% of the market share in 2025, representing a market value of $11,475 million. North America, particularly the United States and Canada, leads in terms of regional consumption, driven by a strong wellness culture and high disposable incomes. The United States is projected to contribute $6,200 million to the global herbal tea market by 2025. Key drivers for this dominance include robust distribution networks, effective marketing campaigns by major retailers, and favorable consumer purchasing habits. The Green Tea segment, within the "Types" categorization, is also a significant growth engine, with an estimated market share of 28% in 2025, valued at $7,140 million. This is attributed to its perceived health benefits, including antioxidant properties and metabolism-boosting effects. Economic policies supporting healthy lifestyle choices and advanced retail infrastructure further solidify the dominance of these segments and regions.
- Dominant Application Segment: Supermarkets and Hypermarkets (approx. 45% market share in 2025)
- Key Drivers: Wide availability, extensive product variety, promotional activities.
- Dominant Region: North America (especially USA and Canada)
- Key Drivers: Strong wellness culture, high consumer spending, established distribution channels.
- Dominant Tea Type: Green Tea (approx. 28% market share in 2025)
- Key Drivers: Perceived health benefits, widespread consumer awareness.
Herbal Tea Product Landscape
The herbal tea product landscape is characterized by an explosion of innovation, with manufacturers continuously introducing new blends and functional varieties. Yellow Tea, a niche but growing segment, is gaining traction for its unique processing and delicate flavor profiles, contributing an estimated $400 million to the market in 2025. Applications extend beyond traditional beverages, with herbal extracts finding their way into functional foods, dietary supplements, and even cosmetic products. Performance metrics are increasingly focused on the concentration of active compounds and scientifically validated health benefits. Unique selling propositions often revolve around organic certification, specific health outcomes (e.g., stress relief, digestive support), and unique flavor fusions. Technological advancements in encapsulation and flavor stabilization are enhancing product quality and shelf life, further driving consumer appeal and market expansion.
Key Drivers, Barriers & Challenges in Herbal Tea
The herbal tea industry is propelled by several key drivers. The burgeoning global health and wellness trend is paramount, encouraging consumers to seek natural and functional beverages. Growing awareness of the potential health benefits associated with various herbs, such as chamomile for relaxation and peppermint for digestion, is a significant factor. Economic prosperity in emerging markets, leading to increased disposable income, also fuels demand. Technological advancements in cultivation and processing methods are improving product quality and efficacy.
Conversely, the market faces several barriers and challenges. Supply chain disruptions, particularly those related to agricultural yields and international logistics, can impact availability and pricing. Stringent and varied regulatory hurdles across different countries, especially concerning health claims and ingredient sourcing, can slow down market entry and product development. Intense competition from established beverage giants and the emergence of new, innovative brands also presents a challenge. The fluctuating cost of raw materials, influenced by weather patterns and geopolitical events, poses a significant economic restraint.
Emerging Opportunities in Herbal Tea
Emerging opportunities in the herbal tea market lie in several key areas. Untapped markets in developing economies, where awareness of herbal wellness is growing, present significant expansion potential, with an estimated potential market value of $3,000 million by 2030. Innovative applications of herbal extracts in functional foods and beverages, beyond traditional tea forms, are gaining traction. The increasing consumer demand for personalized wellness solutions is opening doors for customized herbal tea blends tailored to specific health needs and preferences. Furthermore, the growing trend towards sustainable and ethically sourced products provides an opportunity for brands that prioritize transparency and environmental responsibility in their supply chains.
Growth Accelerators in the Herbal Tea Industry
Growth accelerators in the herbal tea industry are multifaceted, driven by ongoing innovation and strategic market expansion. Technological breakthroughs in agricultural practices, such as precision farming for herbs and advanced extraction techniques, are enhancing the quality and potency of active ingredients. Strategic partnerships between herbal tea manufacturers and wellness influencers or health practitioners are amplifying consumer reach and trust. Furthermore, market expansion strategies, including the development of e-commerce platforms and direct-to-consumer models, are tapping into new customer bases and improving accessibility, especially in regions with nascent retail infrastructures. The introduction of functional ingredients and novel flavor profiles tailored to emerging health trends will continue to drive robust long-term growth.
Key Players Shaping the Herbal Tea Market
- Adagio Teas
- Associated British Foods
- Dilmah Tea
- ITO EN
- Tata Global Beverages
- Unilever
Notable Milestones in Herbal Tea Sector
- 2021: Increased consumer demand for immune-boosting herbal blends following global health concerns.
- 2022: Launch of new functional herbal tea lines focusing on stress relief and sleep enhancement.
- 2023: Growing emphasis on sustainable sourcing and eco-friendly packaging across major brands.
- 2024: Introduction of novel herbal ingredient combinations in the functional beverage sector.
- Q1 2025: Anticipated increase in R&D for personalized herbal tea formulations.
In-Depth Herbal Tea Market Outlook
The future outlook for the herbal tea market is exceptionally promising, fueled by sustained consumer interest in natural wellness solutions. The convergence of health consciousness, a desire for unique sensory experiences, and advancements in product development are key growth accelerators. Strategic opportunities abound for companies that can innovate with functional ingredients, prioritize sustainability, and effectively communicate the health benefits of their products. The market is expected to witness continued expansion driven by both established players and agile startups. The projected growth trajectory underscores the enduring appeal and evolving potential of the herbal tea sector.
Herbal Tea Segmentation
-
1. Application
- 1.1. Supermarkets and Hypermarkets
- 1.2. Independent Retailers
- 1.3. Specialist Retailers
- 1.4. Convenience Stores
- 1.5. Others
-
2. Types
- 2.1. Black Tea
- 2.2. Green Tea
- 2.3. Yellow Tea
Herbal Tea Segmentation By Geography
-
1. North America
- 1.1. United States
- 1.2. Canada
- 1.3. Mexico
-
2. South America
- 2.1. Brazil
- 2.2. Argentina
- 2.3. Rest of South America
-
3. Europe
- 3.1. United Kingdom
- 3.2. Germany
- 3.3. France
- 3.4. Italy
- 3.5. Spain
- 3.6. Russia
- 3.7. Benelux
- 3.8. Nordics
- 3.9. Rest of Europe
-
4. Middle East & Africa
- 4.1. Turkey
- 4.2. Israel
- 4.3. GCC
- 4.4. North Africa
- 4.5. South Africa
- 4.6. Rest of Middle East & Africa
-
5. Asia Pacific
- 5.1. China
- 5.2. India
- 5.3. Japan
- 5.4. South Korea
- 5.5. ASEAN
- 5.6. Oceania
- 5.7. Rest of Asia Pacific
Herbal Tea Regional Market Share
Geographic Coverage of Herbal Tea
Herbal Tea REPORT HIGHLIGHTS
| Aspects | Details |
|---|---|
| Study Period | 2020-2034 |
| Base Year | 2025 |
| Estimated Year | 2026 |
| Forecast Period | 2026-2034 |
| Historical Period | 2020-2025 |
| Growth Rate | CAGR of XX% from 2020-2034 |
| Segmentation |
|
Table of Contents
- 1. Introduction
- 1.1. Research Scope
- 1.2. Market Segmentation
- 1.3. Research Methodology
- 1.4. Definitions and Assumptions
- 2. Executive Summary
- 2.1. Introduction
- 3. Market Dynamics
- 3.1. Introduction
- 3.2. Market Drivers
- 3.3. Market Restrains
- 3.4. Market Trends
- 4. Market Factor Analysis
- 4.1. Porters Five Forces
- 4.2. Supply/Value Chain
- 4.3. PESTEL analysis
- 4.4. Market Entropy
- 4.5. Patent/Trademark Analysis
- 5. Global Herbal Tea Analysis, Insights and Forecast, 2020-2032
- 5.1. Market Analysis, Insights and Forecast - by Application
- 5.1.1. Supermarkets and Hypermarkets
- 5.1.2. Independent Retailers
- 5.1.3. Specialist Retailers
- 5.1.4. Convenience Stores
- 5.1.5. Others
- 5.2. Market Analysis, Insights and Forecast - by Types
- 5.2.1. Black Tea
- 5.2.2. Green Tea
- 5.2.3. Yellow Tea
- 5.3. Market Analysis, Insights and Forecast - by Region
- 5.3.1. North America
- 5.3.2. South America
- 5.3.3. Europe
- 5.3.4. Middle East & Africa
- 5.3.5. Asia Pacific
- 5.1. Market Analysis, Insights and Forecast - by Application
- 6. North America Herbal Tea Analysis, Insights and Forecast, 2020-2032
- 6.1. Market Analysis, Insights and Forecast - by Application
- 6.1.1. Supermarkets and Hypermarkets
- 6.1.2. Independent Retailers
- 6.1.3. Specialist Retailers
- 6.1.4. Convenience Stores
- 6.1.5. Others
- 6.2. Market Analysis, Insights and Forecast - by Types
- 6.2.1. Black Tea
- 6.2.2. Green Tea
- 6.2.3. Yellow Tea
- 6.1. Market Analysis, Insights and Forecast - by Application
- 7. South America Herbal Tea Analysis, Insights and Forecast, 2020-2032
- 7.1. Market Analysis, Insights and Forecast - by Application
- 7.1.1. Supermarkets and Hypermarkets
- 7.1.2. Independent Retailers
- 7.1.3. Specialist Retailers
- 7.1.4. Convenience Stores
- 7.1.5. Others
- 7.2. Market Analysis, Insights and Forecast - by Types
- 7.2.1. Black Tea
- 7.2.2. Green Tea
- 7.2.3. Yellow Tea
- 7.1. Market Analysis, Insights and Forecast - by Application
- 8. Europe Herbal Tea Analysis, Insights and Forecast, 2020-2032
- 8.1. Market Analysis, Insights and Forecast - by Application
- 8.1.1. Supermarkets and Hypermarkets
- 8.1.2. Independent Retailers
- 8.1.3. Specialist Retailers
- 8.1.4. Convenience Stores
- 8.1.5. Others
- 8.2. Market Analysis, Insights and Forecast - by Types
- 8.2.1. Black Tea
- 8.2.2. Green Tea
- 8.2.3. Yellow Tea
- 8.1. Market Analysis, Insights and Forecast - by Application
- 9. Middle East & Africa Herbal Tea Analysis, Insights and Forecast, 2020-2032
- 9.1. Market Analysis, Insights and Forecast - by Application
- 9.1.1. Supermarkets and Hypermarkets
- 9.1.2. Independent Retailers
- 9.1.3. Specialist Retailers
- 9.1.4. Convenience Stores
- 9.1.5. Others
- 9.2. Market Analysis, Insights and Forecast - by Types
- 9.2.1. Black Tea
- 9.2.2. Green Tea
- 9.2.3. Yellow Tea
- 9.1. Market Analysis, Insights and Forecast - by Application
- 10. Asia Pacific Herbal Tea Analysis, Insights and Forecast, 2020-2032
- 10.1. Market Analysis, Insights and Forecast - by Application
- 10.1.1. Supermarkets and Hypermarkets
- 10.1.2. Independent Retailers
- 10.1.3. Specialist Retailers
- 10.1.4. Convenience Stores
- 10.1.5. Others
- 10.2. Market Analysis, Insights and Forecast - by Types
- 10.2.1. Black Tea
- 10.2.2. Green Tea
- 10.2.3. Yellow Tea
- 10.1. Market Analysis, Insights and Forecast - by Application
- 11. Competitive Analysis
- 11.1. Global Market Share Analysis 2025
- 11.2. Company Profiles
- 11.2.1 Adagio Teas
- 11.2.1.1. Overview
- 11.2.1.2. Products
- 11.2.1.3. SWOT Analysis
- 11.2.1.4. Recent Developments
- 11.2.1.5. Financials (Based on Availability)
- 11.2.2 Associated British Foods
- 11.2.2.1. Overview
- 11.2.2.2. Products
- 11.2.2.3. SWOT Analysis
- 11.2.2.4. Recent Developments
- 11.2.2.5. Financials (Based on Availability)
- 11.2.3 Dilmah Tea
- 11.2.3.1. Overview
- 11.2.3.2. Products
- 11.2.3.3. SWOT Analysis
- 11.2.3.4. Recent Developments
- 11.2.3.5. Financials (Based on Availability)
- 11.2.4 ITO EN
- 11.2.4.1. Overview
- 11.2.4.2. Products
- 11.2.4.3. SWOT Analysis
- 11.2.4.4. Recent Developments
- 11.2.4.5. Financials (Based on Availability)
- 11.2.5 Tata Global Beverages
- 11.2.5.1. Overview
- 11.2.5.2. Products
- 11.2.5.3. SWOT Analysis
- 11.2.5.4. Recent Developments
- 11.2.5.5. Financials (Based on Availability)
- 11.2.6 Unilever
- 11.2.6.1. Overview
- 11.2.6.2. Products
- 11.2.6.3. SWOT Analysis
- 11.2.6.4. Recent Developments
- 11.2.6.5. Financials (Based on Availability)
- 11.2.1 Adagio Teas
List of Figures
- Figure 1: Global Herbal Tea Revenue Breakdown (million, %) by Region 2025 & 2033
- Figure 2: Global Herbal Tea Volume Breakdown (K, %) by Region 2025 & 2033
- Figure 3: North America Herbal Tea Revenue (million), by Application 2025 & 2033
- Figure 4: North America Herbal Tea Volume (K), by Application 2025 & 2033
- Figure 5: North America Herbal Tea Revenue Share (%), by Application 2025 & 2033
- Figure 6: North America Herbal Tea Volume Share (%), by Application 2025 & 2033
- Figure 7: North America Herbal Tea Revenue (million), by Types 2025 & 2033
- Figure 8: North America Herbal Tea Volume (K), by Types 2025 & 2033
- Figure 9: North America Herbal Tea Revenue Share (%), by Types 2025 & 2033
- Figure 10: North America Herbal Tea Volume Share (%), by Types 2025 & 2033
- Figure 11: North America Herbal Tea Revenue (million), by Country 2025 & 2033
- Figure 12: North America Herbal Tea Volume (K), by Country 2025 & 2033
- Figure 13: North America Herbal Tea Revenue Share (%), by Country 2025 & 2033
- Figure 14: North America Herbal Tea Volume Share (%), by Country 2025 & 2033
- Figure 15: South America Herbal Tea Revenue (million), by Application 2025 & 2033
- Figure 16: South America Herbal Tea Volume (K), by Application 2025 & 2033
- Figure 17: South America Herbal Tea Revenue Share (%), by Application 2025 & 2033
- Figure 18: South America Herbal Tea Volume Share (%), by Application 2025 & 2033
- Figure 19: South America Herbal Tea Revenue (million), by Types 2025 & 2033
- Figure 20: South America Herbal Tea Volume (K), by Types 2025 & 2033
- Figure 21: South America Herbal Tea Revenue Share (%), by Types 2025 & 2033
- Figure 22: South America Herbal Tea Volume Share (%), by Types 2025 & 2033
- Figure 23: South America Herbal Tea Revenue (million), by Country 2025 & 2033
- Figure 24: South America Herbal Tea Volume (K), by Country 2025 & 2033
- Figure 25: South America Herbal Tea Revenue Share (%), by Country 2025 & 2033
- Figure 26: South America Herbal Tea Volume Share (%), by Country 2025 & 2033
- Figure 27: Europe Herbal Tea Revenue (million), by Application 2025 & 2033
- Figure 28: Europe Herbal Tea Volume (K), by Application 2025 & 2033
- Figure 29: Europe Herbal Tea Revenue Share (%), by Application 2025 & 2033
- Figure 30: Europe Herbal Tea Volume Share (%), by Application 2025 & 2033
- Figure 31: Europe Herbal Tea Revenue (million), by Types 2025 & 2033
- Figure 32: Europe Herbal Tea Volume (K), by Types 2025 & 2033
- Figure 33: Europe Herbal Tea Revenue Share (%), by Types 2025 & 2033
- Figure 34: Europe Herbal Tea Volume Share (%), by Types 2025 & 2033
- Figure 35: Europe Herbal Tea Revenue (million), by Country 2025 & 2033
- Figure 36: Europe Herbal Tea Volume (K), by Country 2025 & 2033
- Figure 37: Europe Herbal Tea Revenue Share (%), by Country 2025 & 2033
- Figure 38: Europe Herbal Tea Volume Share (%), by Country 2025 & 2033
- Figure 39: Middle East & Africa Herbal Tea Revenue (million), by Application 2025 & 2033
- Figure 40: Middle East & Africa Herbal Tea Volume (K), by Application 2025 & 2033
- Figure 41: Middle East & Africa Herbal Tea Revenue Share (%), by Application 2025 & 2033
- Figure 42: Middle East & Africa Herbal Tea Volume Share (%), by Application 2025 & 2033
- Figure 43: Middle East & Africa Herbal Tea Revenue (million), by Types 2025 & 2033
- Figure 44: Middle East & Africa Herbal Tea Volume (K), by Types 2025 & 2033
- Figure 45: Middle East & Africa Herbal Tea Revenue Share (%), by Types 2025 & 2033
- Figure 46: Middle East & Africa Herbal Tea Volume Share (%), by Types 2025 & 2033
- Figure 47: Middle East & Africa Herbal Tea Revenue (million), by Country 2025 & 2033
- Figure 48: Middle East & Africa Herbal Tea Volume (K), by Country 2025 & 2033
- Figure 49: Middle East & Africa Herbal Tea Revenue Share (%), by Country 2025 & 2033
- Figure 50: Middle East & Africa Herbal Tea Volume Share (%), by Country 2025 & 2033
- Figure 51: Asia Pacific Herbal Tea Revenue (million), by Application 2025 & 2033
- Figure 52: Asia Pacific Herbal Tea Volume (K), by Application 2025 & 2033
- Figure 53: Asia Pacific Herbal Tea Revenue Share (%), by Application 2025 & 2033
- Figure 54: Asia Pacific Herbal Tea Volume Share (%), by Application 2025 & 2033
- Figure 55: Asia Pacific Herbal Tea Revenue (million), by Types 2025 & 2033
- Figure 56: Asia Pacific Herbal Tea Volume (K), by Types 2025 & 2033
- Figure 57: Asia Pacific Herbal Tea Revenue Share (%), by Types 2025 & 2033
- Figure 58: Asia Pacific Herbal Tea Volume Share (%), by Types 2025 & 2033
- Figure 59: Asia Pacific Herbal Tea Revenue (million), by Country 2025 & 2033
- Figure 60: Asia Pacific Herbal Tea Volume (K), by Country 2025 & 2033
- Figure 61: Asia Pacific Herbal Tea Revenue Share (%), by Country 2025 & 2033
- Figure 62: Asia Pacific Herbal Tea Volume Share (%), by Country 2025 & 2033
List of Tables
- Table 1: Global Herbal Tea Revenue million Forecast, by Application 2020 & 2033
- Table 2: Global Herbal Tea Volume K Forecast, by Application 2020 & 2033
- Table 3: Global Herbal Tea Revenue million Forecast, by Types 2020 & 2033
- Table 4: Global Herbal Tea Volume K Forecast, by Types 2020 & 2033
- Table 5: Global Herbal Tea Revenue million Forecast, by Region 2020 & 2033
- Table 6: Global Herbal Tea Volume K Forecast, by Region 2020 & 2033
- Table 7: Global Herbal Tea Revenue million Forecast, by Application 2020 & 2033
- Table 8: Global Herbal Tea Volume K Forecast, by Application 2020 & 2033
- Table 9: Global Herbal Tea Revenue million Forecast, by Types 2020 & 2033
- Table 10: Global Herbal Tea Volume K Forecast, by Types 2020 & 2033
- Table 11: Global Herbal Tea Revenue million Forecast, by Country 2020 & 2033
- Table 12: Global Herbal Tea Volume K Forecast, by Country 2020 & 2033
- Table 13: United States Herbal Tea Revenue (million) Forecast, by Application 2020 & 2033
- Table 14: United States Herbal Tea Volume (K) Forecast, by Application 2020 & 2033
- Table 15: Canada Herbal Tea Revenue (million) Forecast, by Application 2020 & 2033
- Table 16: Canada Herbal Tea Volume (K) Forecast, by Application 2020 & 2033
- Table 17: Mexico Herbal Tea Revenue (million) Forecast, by Application 2020 & 2033
- Table 18: Mexico Herbal Tea Volume (K) Forecast, by Application 2020 & 2033
- Table 19: Global Herbal Tea Revenue million Forecast, by Application 2020 & 2033
- Table 20: Global Herbal Tea Volume K Forecast, by Application 2020 & 2033
- Table 21: Global Herbal Tea Revenue million Forecast, by Types 2020 & 2033
- Table 22: Global Herbal Tea Volume K Forecast, by Types 2020 & 2033
- Table 23: Global Herbal Tea Revenue million Forecast, by Country 2020 & 2033
- Table 24: Global Herbal Tea Volume K Forecast, by Country 2020 & 2033
- Table 25: Brazil Herbal Tea Revenue (million) Forecast, by Application 2020 & 2033
- Table 26: Brazil Herbal Tea Volume (K) Forecast, by Application 2020 & 2033
- Table 27: Argentina Herbal Tea Revenue (million) Forecast, by Application 2020 & 2033
- Table 28: Argentina Herbal Tea Volume (K) Forecast, by Application 2020 & 2033
- Table 29: Rest of South America Herbal Tea Revenue (million) Forecast, by Application 2020 & 2033
- Table 30: Rest of South America Herbal Tea Volume (K) Forecast, by Application 2020 & 2033
- Table 31: Global Herbal Tea Revenue million Forecast, by Application 2020 & 2033
- Table 32: Global Herbal Tea Volume K Forecast, by Application 2020 & 2033
- Table 33: Global Herbal Tea Revenue million Forecast, by Types 2020 & 2033
- Table 34: Global Herbal Tea Volume K Forecast, by Types 2020 & 2033
- Table 35: Global Herbal Tea Revenue million Forecast, by Country 2020 & 2033
- Table 36: Global Herbal Tea Volume K Forecast, by Country 2020 & 2033
- Table 37: United Kingdom Herbal Tea Revenue (million) Forecast, by Application 2020 & 2033
- Table 38: United Kingdom Herbal Tea Volume (K) Forecast, by Application 2020 & 2033
- Table 39: Germany Herbal Tea Revenue (million) Forecast, by Application 2020 & 2033
- Table 40: Germany Herbal Tea Volume (K) Forecast, by Application 2020 & 2033
- Table 41: France Herbal Tea Revenue (million) Forecast, by Application 2020 & 2033
- Table 42: France Herbal Tea Volume (K) Forecast, by Application 2020 & 2033
- Table 43: Italy Herbal Tea Revenue (million) Forecast, by Application 2020 & 2033
- Table 44: Italy Herbal Tea Volume (K) Forecast, by Application 2020 & 2033
- Table 45: Spain Herbal Tea Revenue (million) Forecast, by Application 2020 & 2033
- Table 46: Spain Herbal Tea Volume (K) Forecast, by Application 2020 & 2033
- Table 47: Russia Herbal Tea Revenue (million) Forecast, by Application 2020 & 2033
- Table 48: Russia Herbal Tea Volume (K) Forecast, by Application 2020 & 2033
- Table 49: Benelux Herbal Tea Revenue (million) Forecast, by Application 2020 & 2033
- Table 50: Benelux Herbal Tea Volume (K) Forecast, by Application 2020 & 2033
- Table 51: Nordics Herbal Tea Revenue (million) Forecast, by Application 2020 & 2033
- Table 52: Nordics Herbal Tea Volume (K) Forecast, by Application 2020 & 2033
- Table 53: Rest of Europe Herbal Tea Revenue (million) Forecast, by Application 2020 & 2033
- Table 54: Rest of Europe Herbal Tea Volume (K) Forecast, by Application 2020 & 2033
- Table 55: Global Herbal Tea Revenue million Forecast, by Application 2020 & 2033
- Table 56: Global Herbal Tea Volume K Forecast, by Application 2020 & 2033
- Table 57: Global Herbal Tea Revenue million Forecast, by Types 2020 & 2033
- Table 58: Global Herbal Tea Volume K Forecast, by Types 2020 & 2033
- Table 59: Global Herbal Tea Revenue million Forecast, by Country 2020 & 2033
- Table 60: Global Herbal Tea Volume K Forecast, by Country 2020 & 2033
- Table 61: Turkey Herbal Tea Revenue (million) Forecast, by Application 2020 & 2033
- Table 62: Turkey Herbal Tea Volume (K) Forecast, by Application 2020 & 2033
- Table 63: Israel Herbal Tea Revenue (million) Forecast, by Application 2020 & 2033
- Table 64: Israel Herbal Tea Volume (K) Forecast, by Application 2020 & 2033
- Table 65: GCC Herbal Tea Revenue (million) Forecast, by Application 2020 & 2033
- Table 66: GCC Herbal Tea Volume (K) Forecast, by Application 2020 & 2033
- Table 67: North Africa Herbal Tea Revenue (million) Forecast, by Application 2020 & 2033
- Table 68: North Africa Herbal Tea Volume (K) Forecast, by Application 2020 & 2033
- Table 69: South Africa Herbal Tea Revenue (million) Forecast, by Application 2020 & 2033
- Table 70: South Africa Herbal Tea Volume (K) Forecast, by Application 2020 & 2033
- Table 71: Rest of Middle East & Africa Herbal Tea Revenue (million) Forecast, by Application 2020 & 2033
- Table 72: Rest of Middle East & Africa Herbal Tea Volume (K) Forecast, by Application 2020 & 2033
- Table 73: Global Herbal Tea Revenue million Forecast, by Application 2020 & 2033
- Table 74: Global Herbal Tea Volume K Forecast, by Application 2020 & 2033
- Table 75: Global Herbal Tea Revenue million Forecast, by Types 2020 & 2033
- Table 76: Global Herbal Tea Volume K Forecast, by Types 2020 & 2033
- Table 77: Global Herbal Tea Revenue million Forecast, by Country 2020 & 2033
- Table 78: Global Herbal Tea Volume K Forecast, by Country 2020 & 2033
- Table 79: China Herbal Tea Revenue (million) Forecast, by Application 2020 & 2033
- Table 80: China Herbal Tea Volume (K) Forecast, by Application 2020 & 2033
- Table 81: India Herbal Tea Revenue (million) Forecast, by Application 2020 & 2033
- Table 82: India Herbal Tea Volume (K) Forecast, by Application 2020 & 2033
- Table 83: Japan Herbal Tea Revenue (million) Forecast, by Application 2020 & 2033
- Table 84: Japan Herbal Tea Volume (K) Forecast, by Application 2020 & 2033
- Table 85: South Korea Herbal Tea Revenue (million) Forecast, by Application 2020 & 2033
- Table 86: South Korea Herbal Tea Volume (K) Forecast, by Application 2020 & 2033
- Table 87: ASEAN Herbal Tea Revenue (million) Forecast, by Application 2020 & 2033
- Table 88: ASEAN Herbal Tea Volume (K) Forecast, by Application 2020 & 2033
- Table 89: Oceania Herbal Tea Revenue (million) Forecast, by Application 2020 & 2033
- Table 90: Oceania Herbal Tea Volume (K) Forecast, by Application 2020 & 2033
- Table 91: Rest of Asia Pacific Herbal Tea Revenue (million) Forecast, by Application 2020 & 2033
- Table 92: Rest of Asia Pacific Herbal Tea Volume (K) Forecast, by Application 2020 & 2033
Frequently Asked Questions
1. What is the projected Compound Annual Growth Rate (CAGR) of the Herbal Tea?
The projected CAGR is approximately XX%.
2. Which companies are prominent players in the Herbal Tea?
Key companies in the market include Adagio Teas, Associated British Foods, Dilmah Tea, ITO EN, Tata Global Beverages, Unilever.
3. What are the main segments of the Herbal Tea?
The market segments include Application, Types.
4. Can you provide details about the market size?
The market size is estimated to be USD XXX million as of 2022.
5. What are some drivers contributing to market growth?
N/A
6. What are the notable trends driving market growth?
N/A
7. Are there any restraints impacting market growth?
N/A
8. Can you provide examples of recent developments in the market?
N/A
9. What pricing options are available for accessing the report?
Pricing options include single-user, multi-user, and enterprise licenses priced at USD 3350.00, USD 5025.00, and USD 6700.00 respectively.
10. Is the market size provided in terms of value or volume?
The market size is provided in terms of value, measured in million and volume, measured in K.
11. Are there any specific market keywords associated with the report?
Yes, the market keyword associated with the report is "Herbal Tea," which aids in identifying and referencing the specific market segment covered.
12. How do I determine which pricing option suits my needs best?
The pricing options vary based on user requirements and access needs. Individual users may opt for single-user licenses, while businesses requiring broader access may choose multi-user or enterprise licenses for cost-effective access to the report.
13. Are there any additional resources or data provided in the Herbal Tea report?
While the report offers comprehensive insights, it's advisable to review the specific contents or supplementary materials provided to ascertain if additional resources or data are available.
14. How can I stay updated on further developments or reports in the Herbal Tea?
To stay informed about further developments, trends, and reports in the Herbal Tea, consider subscribing to industry newsletters, following relevant companies and organizations, or regularly checking reputable industry news sources and publications.
Methodology
Step 1 - Identification of Relevant Samples Size from Population Database


Step 2 - Approaches for Defining Global Market Size (Value, Volume* & Price*)

Note*: In applicable scenarios
Step 3 - Data Sources
Primary Research
- Web Analytics
- Survey Reports
- Research Institute
- Latest Research Reports
- Opinion Leaders
Secondary Research
- Annual Reports
- White Paper
- Latest Press Release
- Industry Association
- Paid Database
- Investor Presentations

Step 4 - Data Triangulation
Involves using different sources of information in order to increase the validity of a study
These sources are likely to be stakeholders in a program - participants, other researchers, program staff, other community members, and so on.
Then we put all data in single framework & apply various statistical tools to find out the dynamic on the market.
During the analysis stage, feedback from the stakeholder groups would be compared to determine areas of agreement as well as areas of divergence