

Key Insights
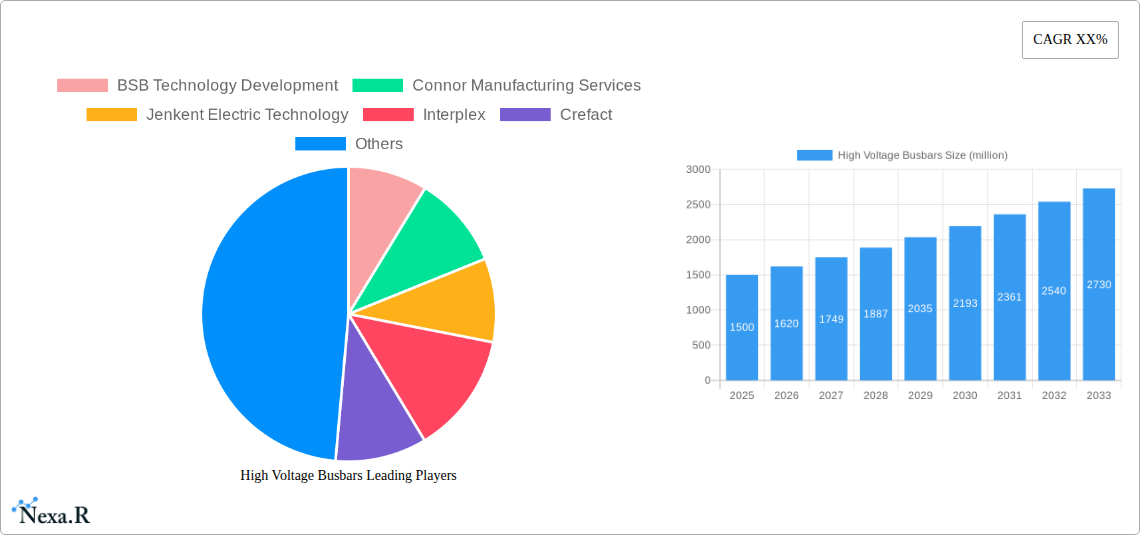
The high-voltage busbar market is poised for significant expansion, fueled by escalating demand in electric vehicles (EVs), renewable energy integration, and the growth of high-voltage direct current (HVDC) transmission systems. The market is projected to grow at a Compound Annual Growth Rate (CAGR) of 4.9% from a market size of 17.7 billion in the base year 2025. Key drivers include the accelerated global adoption of EVs, necessitating efficient power distribution, and the increasing integration of renewable energy sources requiring robust high-voltage infrastructure. Technological advancements in materials and insulation further support market growth. While initial HVDC investment costs may present a challenge, the long-term efficiency benefits are a strong counterpoint. Intense competition among established and emerging players drives innovation and competitive pricing.
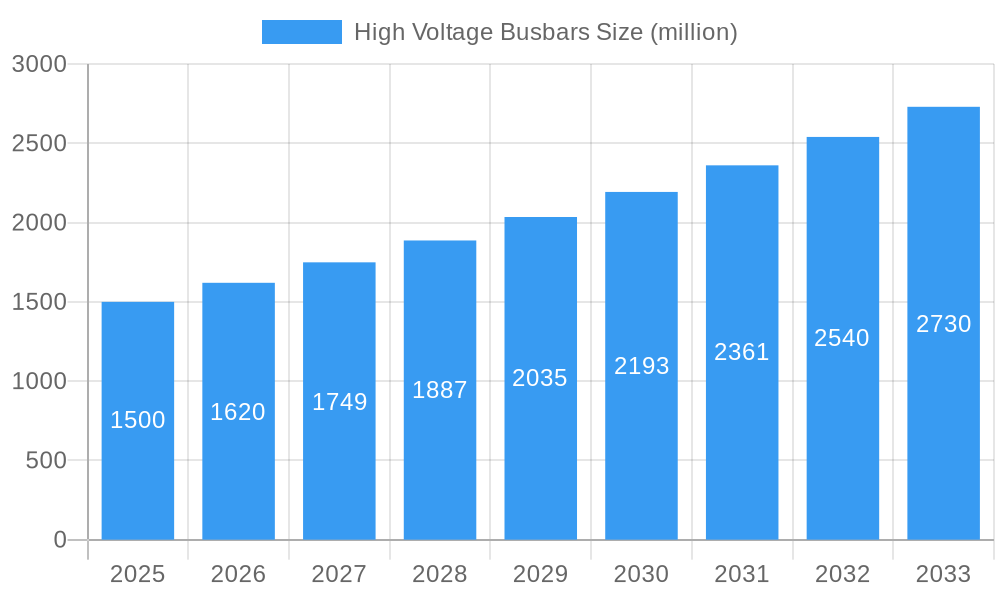
High Voltage Busbars Market Size (In Billion)
Market segmentation is expected to span diverse materials, voltage ratings, and applications, including automotive, power grids, and industrial sectors. North America and Europe are anticipated to lead growth due to developed infrastructure and early adoption trends. However, the Asia-Pacific region is set for substantial expansion, driven by its burgeoning EV market and significant renewable energy investments. Challenges include maintaining supply chain stability and adhering to rigorous safety and regulatory standards for high-voltage applications. Despite these factors, the long-term outlook for the high-voltage busbar market is exceptionally strong, driven by the global imperative for electrification and sustainable energy solutions.
High Voltage Busbars Company Market Share
High Voltage Busbars Market Report: 2019-2033
This comprehensive report provides an in-depth analysis of the high voltage busbars market, encompassing market dynamics, growth trends, regional segmentation, product landscape, key players, and future outlook. The study period covers 2019-2033, with 2025 as the base and estimated year. This report is invaluable for industry professionals, investors, and strategic decision-makers seeking to understand and capitalize on opportunities within this rapidly evolving sector. The report analyzes the parent market of power transmission and distribution equipment and the child market of electric vehicle charging infrastructure.
High Voltage Busbars Market Dynamics & Structure
The high voltage busbars market is characterized by moderate concentration, with key players vying for market share. Technological innovation, particularly in materials science and design, is a major driver, alongside stringent regulatory frameworks focused on safety and efficiency. Competitive substitutes, such as alternative power transmission technologies, pose a challenge. The end-user base spans diverse sectors, including power generation, transmission & distribution, renewable energy, and increasingly, electric vehicle charging infrastructure. M&A activity has been moderate, with xx deals recorded between 2019 and 2024, signifying consolidation and strategic expansion efforts.
- Market Concentration: Moderately concentrated, with the top 5 players holding an estimated 45% market share in 2025.
- Technological Innovation: Focus on lightweight, high-conductivity materials (e.g., copper alloys, aluminum) and improved insulation technologies.
- Regulatory Landscape: Stringent safety standards and efficiency regulations are driving innovation and shaping market dynamics.
- Competitive Substitutes: Fiber optic cables and wireless power transfer technologies pose a long-term competitive threat.
- End-User Demographics: Power utilities, renewable energy developers, and the rapidly growing EV charging infrastructure market are key end-users.
- M&A Activity: xx M&A deals in 2019-2024, indicating a trend towards consolidation and expansion. Further xx deals are predicted for the forecast period.
High Voltage Busbars Growth Trends & Insights
The high voltage busbars market exhibited a CAGR of xx% during the historical period (2019-2024), reaching a market size of $xx billion in 2025. This growth is primarily driven by the expanding renewable energy sector, increasing demand for reliable power transmission and distribution, and the burgeoning electric vehicle charging infrastructure. Technological advancements, such as the adoption of advanced materials and improved designs, further enhance market expansion. Consumer behavior shifts towards sustainable energy solutions and increasing focus on grid modernization are key contributing factors. Market penetration in developing economies presents significant growth opportunities. The forecast period (2025-2033) projects a CAGR of xx%, driven by continued investments in renewable energy and grid infrastructure upgrades, with the market size expected to reach $xx billion by 2033.
Dominant Regions, Countries, or Segments in High Voltage Busbars
North America currently holds the largest market share, driven by robust investments in renewable energy infrastructure and stringent regulatory frameworks promoting grid modernization. Europe follows closely, with significant adoption in wind and solar power projects. Asia-Pacific is poised for rapid growth, fueled by increasing energy demands and substantial investments in grid infrastructure development. The automotive sector (EV charging) is a rapidly growing segment, experiencing the highest CAGR, while the power generation segment maintains the largest market share.
- North America: Strong regulatory push for grid modernization, high renewable energy adoption.
- Europe: Significant investments in renewable energy projects, particularly wind and solar.
- Asia-Pacific: High growth potential driven by increasing energy demand and infrastructure development.
- Automotive Segment (EV charging): Highest CAGR due to the booming electric vehicle market.
- Power Generation Segment: Holds the largest market share, driven by ongoing power plant upgrades and expansion.
High Voltage Busbars Product Landscape
High voltage busbars are evolving from traditional copper-based designs towards lighter, more efficient, and reliable options utilizing advanced materials and innovative manufacturing processes. Key advancements include improved insulation systems, enhanced thermal management capabilities, and miniaturization for space-saving applications. Unique selling propositions center on superior conductivity, durability, and safety features, coupled with customized designs to meet specific application requirements.
Key Drivers, Barriers & Challenges in High Voltage Busbars
Key Drivers: The increasing adoption of renewable energy sources, the expansion of electric vehicle charging infrastructure, and the need for more efficient and reliable power grids are driving significant growth in the high voltage busbars market. Government initiatives promoting sustainable energy and grid modernization further fuel market expansion.
Key Challenges: The fluctuating prices of raw materials (copper, aluminum), supply chain disruptions, and intense competition from alternative technologies pose considerable challenges. Stringent safety and environmental regulations require significant investment in research and development, impacting profitability.
Emerging Opportunities in High Voltage Busbars
The integration of smart grid technologies, the growing adoption of high-voltage direct current (HVDC) transmission, and the emergence of new applications in microgrids and distributed generation offer significant growth opportunities. Furthermore, the increasing demand for electric vehicles and the expansion of fast-charging infrastructure create a substantial market for specialized high-voltage busbars.
Growth Accelerators in the High Voltage Busbars Industry
Technological advancements in materials science, miniaturization techniques, and improved insulation systems are driving efficiency gains and performance enhancements. Strategic partnerships between manufacturers and grid operators foster innovation and deployment of advanced solutions. Expansion into emerging markets and diversification into new applications further accelerate growth.
Key Players Shaping the High Voltage Busbars Market
- BSB Technology Development
- Connor Manufacturing Services
- Jenkent Electric Technology
- Interplex
- Crefact
- EG Electronics
- RHI's busbars
- TE Connectivity
- Rogers Corporation
- Auto-Kabel
- Methode Electronics
- Suncall
- Iwis e-tec
- Mersen
- RHI Electric
- Intercable Automotive Solutions (Aptiv)
- Everwin Technology
Notable Milestones in High Voltage Busbars Sector
- 2020, Q3: Introduction of a novel high-temperature superconductor busbar technology by [Company Name].
- 2022, Q1: Merger between two key players, leading to increased market consolidation.
- 2023, Q4: Launch of a new lightweight aluminum busbar designed for EV charging stations by [Company Name].
In-Depth High Voltage Busbars Market Outlook
The high voltage busbars market is poised for sustained growth over the forecast period, driven by the ongoing expansion of renewable energy, grid modernization initiatives, and the surging demand from the electric vehicle sector. Strategic investments in research and development, focusing on advanced materials and innovative designs, will further shape market dynamics. Opportunities abound for companies adopting a proactive approach towards innovation and strategic partnerships, creating a positive outlook for this crucial component in the power transmission and distribution landscape.
High Voltage Busbars Segmentation
-
1. Application
- 1.1. Electric Vehicles (EVs)
- 1.2. Power
- 1.3. Data Centers
- 1.4. Industrial Applications
- 1.5. Others
-
2. Types
- 2.1. Copper Busbars
- 2.2. Aluminium Busbars
- 2.3. Others
High Voltage Busbars Segmentation By Geography
-
1. North America
- 1.1. United States
- 1.2. Canada
- 1.3. Mexico
-
2. South America
- 2.1. Brazil
- 2.2. Argentina
- 2.3. Rest of South America
-
3. Europe
- 3.1. United Kingdom
- 3.2. Germany
- 3.3. France
- 3.4. Italy
- 3.5. Spain
- 3.6. Russia
- 3.7. Benelux
- 3.8. Nordics
- 3.9. Rest of Europe
-
4. Middle East & Africa
- 4.1. Turkey
- 4.2. Israel
- 4.3. GCC
- 4.4. North Africa
- 4.5. South Africa
- 4.6. Rest of Middle East & Africa
-
5. Asia Pacific
- 5.1. China
- 5.2. India
- 5.3. Japan
- 5.4. South Korea
- 5.5. ASEAN
- 5.6. Oceania
- 5.7. Rest of Asia Pacific

High Voltage Busbars Regional Market Share
Geographic Coverage of High Voltage Busbars
High Voltage Busbars REPORT HIGHLIGHTS
| Aspects | Details |
|---|---|
| Study Period | 2020-2034 |
| Base Year | 2025 |
| Estimated Year | 2026 |
| Forecast Period | 2026-2034 |
| Historical Period | 2020-2025 |
| Growth Rate | CAGR of 4.9% from 2020-2034 |
| Segmentation |
|
Table of Contents
- 1. Introduction
- 1.1. Research Scope
- 1.2. Market Segmentation
- 1.3. Research Methodology
- 1.4. Definitions and Assumptions
- 2. Executive Summary
- 2.1. Introduction
- 3. Market Dynamics
- 3.1. Introduction
- 3.2. Market Drivers
- 3.3. Market Restrains
- 3.4. Market Trends
- 4. Market Factor Analysis
- 4.1. Porters Five Forces
- 4.2. Supply/Value Chain
- 4.3. PESTEL analysis
- 4.4. Market Entropy
- 4.5. Patent/Trademark Analysis
- 5. Global High Voltage Busbars Analysis, Insights and Forecast, 2020-2032
- 5.1. Market Analysis, Insights and Forecast - by Application
- 5.1.1. Electric Vehicles (EVs)
- 5.1.2. Power
- 5.1.3. Data Centers
- 5.1.4. Industrial Applications
- 5.1.5. Others
- 5.2. Market Analysis, Insights and Forecast - by Types
- 5.2.1. Copper Busbars
- 5.2.2. Aluminium Busbars
- 5.2.3. Others
- 5.3. Market Analysis, Insights and Forecast - by Region
- 5.3.1. North America
- 5.3.2. South America
- 5.3.3. Europe
- 5.3.4. Middle East & Africa
- 5.3.5. Asia Pacific
- 5.1. Market Analysis, Insights and Forecast - by Application
- 6. North America High Voltage Busbars Analysis, Insights and Forecast, 2020-2032
- 6.1. Market Analysis, Insights and Forecast - by Application
- 6.1.1. Electric Vehicles (EVs)
- 6.1.2. Power
- 6.1.3. Data Centers
- 6.1.4. Industrial Applications
- 6.1.5. Others
- 6.2. Market Analysis, Insights and Forecast - by Types
- 6.2.1. Copper Busbars
- 6.2.2. Aluminium Busbars
- 6.2.3. Others
- 6.1. Market Analysis, Insights and Forecast - by Application
- 7. South America High Voltage Busbars Analysis, Insights and Forecast, 2020-2032
- 7.1. Market Analysis, Insights and Forecast - by Application
- 7.1.1. Electric Vehicles (EVs)
- 7.1.2. Power
- 7.1.3. Data Centers
- 7.1.4. Industrial Applications
- 7.1.5. Others
- 7.2. Market Analysis, Insights and Forecast - by Types
- 7.2.1. Copper Busbars
- 7.2.2. Aluminium Busbars
- 7.2.3. Others
- 7.1. Market Analysis, Insights and Forecast - by Application
- 8. Europe High Voltage Busbars Analysis, Insights and Forecast, 2020-2032
- 8.1. Market Analysis, Insights and Forecast - by Application
- 8.1.1. Electric Vehicles (EVs)
- 8.1.2. Power
- 8.1.3. Data Centers
- 8.1.4. Industrial Applications
- 8.1.5. Others
- 8.2. Market Analysis, Insights and Forecast - by Types
- 8.2.1. Copper Busbars
- 8.2.2. Aluminium Busbars
- 8.2.3. Others
- 8.1. Market Analysis, Insights and Forecast - by Application
- 9. Middle East & Africa High Voltage Busbars Analysis, Insights and Forecast, 2020-2032
- 9.1. Market Analysis, Insights and Forecast - by Application
- 9.1.1. Electric Vehicles (EVs)
- 9.1.2. Power
- 9.1.3. Data Centers
- 9.1.4. Industrial Applications
- 9.1.5. Others
- 9.2. Market Analysis, Insights and Forecast - by Types
- 9.2.1. Copper Busbars
- 9.2.2. Aluminium Busbars
- 9.2.3. Others
- 9.1. Market Analysis, Insights and Forecast - by Application
- 10. Asia Pacific High Voltage Busbars Analysis, Insights and Forecast, 2020-2032
- 10.1. Market Analysis, Insights and Forecast - by Application
- 10.1.1. Electric Vehicles (EVs)
- 10.1.2. Power
- 10.1.3. Data Centers
- 10.1.4. Industrial Applications
- 10.1.5. Others
- 10.2. Market Analysis, Insights and Forecast - by Types
- 10.2.1. Copper Busbars
- 10.2.2. Aluminium Busbars
- 10.2.3. Others
- 10.1. Market Analysis, Insights and Forecast - by Application
- 11. Competitive Analysis
- 11.1. Global Market Share Analysis 2025
- 11.2. Company Profiles
- 11.2.1 BSB Technology Development
- 11.2.1.1. Overview
- 11.2.1.2. Products
- 11.2.1.3. SWOT Analysis
- 11.2.1.4. Recent Developments
- 11.2.1.5. Financials (Based on Availability)
- 11.2.2 Connor Manufacturing Services
- 11.2.2.1. Overview
- 11.2.2.2. Products
- 11.2.2.3. SWOT Analysis
- 11.2.2.4. Recent Developments
- 11.2.2.5. Financials (Based on Availability)
- 11.2.3 Jenkent Electric Technology
- 11.2.3.1. Overview
- 11.2.3.2. Products
- 11.2.3.3. SWOT Analysis
- 11.2.3.4. Recent Developments
- 11.2.3.5. Financials (Based on Availability)
- 11.2.4 Interplex
- 11.2.4.1. Overview
- 11.2.4.2. Products
- 11.2.4.3. SWOT Analysis
- 11.2.4.4. Recent Developments
- 11.2.4.5. Financials (Based on Availability)
- 11.2.5 Crefact
- 11.2.5.1. Overview
- 11.2.5.2. Products
- 11.2.5.3. SWOT Analysis
- 11.2.5.4. Recent Developments
- 11.2.5.5. Financials (Based on Availability)
- 11.2.6 EG Electronics
- 11.2.6.1. Overview
- 11.2.6.2. Products
- 11.2.6.3. SWOT Analysis
- 11.2.6.4. Recent Developments
- 11.2.6.5. Financials (Based on Availability)
- 11.2.7 RHI's busbars
- 11.2.7.1. Overview
- 11.2.7.2. Products
- 11.2.7.3. SWOT Analysis
- 11.2.7.4. Recent Developments
- 11.2.7.5. Financials (Based on Availability)
- 11.2.8 TE Connectivity
- 11.2.8.1. Overview
- 11.2.8.2. Products
- 11.2.8.3. SWOT Analysis
- 11.2.8.4. Recent Developments
- 11.2.8.5. Financials (Based on Availability)
- 11.2.9 Rogers Corporation
- 11.2.9.1. Overview
- 11.2.9.2. Products
- 11.2.9.3. SWOT Analysis
- 11.2.9.4. Recent Developments
- 11.2.9.5. Financials (Based on Availability)
- 11.2.10 Auto-Kabel
- 11.2.10.1. Overview
- 11.2.10.2. Products
- 11.2.10.3. SWOT Analysis
- 11.2.10.4. Recent Developments
- 11.2.10.5. Financials (Based on Availability)
- 11.2.11 Methode Electronics
- 11.2.11.1. Overview
- 11.2.11.2. Products
- 11.2.11.3. SWOT Analysis
- 11.2.11.4. Recent Developments
- 11.2.11.5. Financials (Based on Availability)
- 11.2.12 Suncall
- 11.2.12.1. Overview
- 11.2.12.2. Products
- 11.2.12.3. SWOT Analysis
- 11.2.12.4. Recent Developments
- 11.2.12.5. Financials (Based on Availability)
- 11.2.13 Iwis e-tec
- 11.2.13.1. Overview
- 11.2.13.2. Products
- 11.2.13.3. SWOT Analysis
- 11.2.13.4. Recent Developments
- 11.2.13.5. Financials (Based on Availability)
- 11.2.14 Mersen
- 11.2.14.1. Overview
- 11.2.14.2. Products
- 11.2.14.3. SWOT Analysis
- 11.2.14.4. Recent Developments
- 11.2.14.5. Financials (Based on Availability)
- 11.2.15 RHI ELectric
- 11.2.15.1. Overview
- 11.2.15.2. Products
- 11.2.15.3. SWOT Analysis
- 11.2.15.4. Recent Developments
- 11.2.15.5. Financials (Based on Availability)
- 11.2.16 Intercable Automotive Solutions (Aptiv)
- 11.2.16.1. Overview
- 11.2.16.2. Products
- 11.2.16.3. SWOT Analysis
- 11.2.16.4. Recent Developments
- 11.2.16.5. Financials (Based on Availability)
- 11.2.17 Everwin Technology
- 11.2.17.1. Overview
- 11.2.17.2. Products
- 11.2.17.3. SWOT Analysis
- 11.2.17.4. Recent Developments
- 11.2.17.5. Financials (Based on Availability)
- 11.2.1 BSB Technology Development
List of Figures
- Figure 1: Global High Voltage Busbars Revenue Breakdown (billion, %) by Region 2025 & 2033
- Figure 2: Global High Voltage Busbars Volume Breakdown (K, %) by Region 2025 & 2033
- Figure 3: North America High Voltage Busbars Revenue (billion), by Application 2025 & 2033
- Figure 4: North America High Voltage Busbars Volume (K), by Application 2025 & 2033
- Figure 5: North America High Voltage Busbars Revenue Share (%), by Application 2025 & 2033
- Figure 6: North America High Voltage Busbars Volume Share (%), by Application 2025 & 2033
- Figure 7: North America High Voltage Busbars Revenue (billion), by Types 2025 & 2033
- Figure 8: North America High Voltage Busbars Volume (K), by Types 2025 & 2033
- Figure 9: North America High Voltage Busbars Revenue Share (%), by Types 2025 & 2033
- Figure 10: North America High Voltage Busbars Volume Share (%), by Types 2025 & 2033
- Figure 11: North America High Voltage Busbars Revenue (billion), by Country 2025 & 2033
- Figure 12: North America High Voltage Busbars Volume (K), by Country 2025 & 2033
- Figure 13: North America High Voltage Busbars Revenue Share (%), by Country 2025 & 2033
- Figure 14: North America High Voltage Busbars Volume Share (%), by Country 2025 & 2033
- Figure 15: South America High Voltage Busbars Revenue (billion), by Application 2025 & 2033
- Figure 16: South America High Voltage Busbars Volume (K), by Application 2025 & 2033
- Figure 17: South America High Voltage Busbars Revenue Share (%), by Application 2025 & 2033
- Figure 18: South America High Voltage Busbars Volume Share (%), by Application 2025 & 2033
- Figure 19: South America High Voltage Busbars Revenue (billion), by Types 2025 & 2033
- Figure 20: South America High Voltage Busbars Volume (K), by Types 2025 & 2033
- Figure 21: South America High Voltage Busbars Revenue Share (%), by Types 2025 & 2033
- Figure 22: South America High Voltage Busbars Volume Share (%), by Types 2025 & 2033
- Figure 23: South America High Voltage Busbars Revenue (billion), by Country 2025 & 2033
- Figure 24: South America High Voltage Busbars Volume (K), by Country 2025 & 2033
- Figure 25: South America High Voltage Busbars Revenue Share (%), by Country 2025 & 2033
- Figure 26: South America High Voltage Busbars Volume Share (%), by Country 2025 & 2033
- Figure 27: Europe High Voltage Busbars Revenue (billion), by Application 2025 & 2033
- Figure 28: Europe High Voltage Busbars Volume (K), by Application 2025 & 2033
- Figure 29: Europe High Voltage Busbars Revenue Share (%), by Application 2025 & 2033
- Figure 30: Europe High Voltage Busbars Volume Share (%), by Application 2025 & 2033
- Figure 31: Europe High Voltage Busbars Revenue (billion), by Types 2025 & 2033
- Figure 32: Europe High Voltage Busbars Volume (K), by Types 2025 & 2033
- Figure 33: Europe High Voltage Busbars Revenue Share (%), by Types 2025 & 2033
- Figure 34: Europe High Voltage Busbars Volume Share (%), by Types 2025 & 2033
- Figure 35: Europe High Voltage Busbars Revenue (billion), by Country 2025 & 2033
- Figure 36: Europe High Voltage Busbars Volume (K), by Country 2025 & 2033
- Figure 37: Europe High Voltage Busbars Revenue Share (%), by Country 2025 & 2033
- Figure 38: Europe High Voltage Busbars Volume Share (%), by Country 2025 & 2033
- Figure 39: Middle East & Africa High Voltage Busbars Revenue (billion), by Application 2025 & 2033
- Figure 40: Middle East & Africa High Voltage Busbars Volume (K), by Application 2025 & 2033
- Figure 41: Middle East & Africa High Voltage Busbars Revenue Share (%), by Application 2025 & 2033
- Figure 42: Middle East & Africa High Voltage Busbars Volume Share (%), by Application 2025 & 2033
- Figure 43: Middle East & Africa High Voltage Busbars Revenue (billion), by Types 2025 & 2033
- Figure 44: Middle East & Africa High Voltage Busbars Volume (K), by Types 2025 & 2033
- Figure 45: Middle East & Africa High Voltage Busbars Revenue Share (%), by Types 2025 & 2033
- Figure 46: Middle East & Africa High Voltage Busbars Volume Share (%), by Types 2025 & 2033
- Figure 47: Middle East & Africa High Voltage Busbars Revenue (billion), by Country 2025 & 2033
- Figure 48: Middle East & Africa High Voltage Busbars Volume (K), by Country 2025 & 2033
- Figure 49: Middle East & Africa High Voltage Busbars Revenue Share (%), by Country 2025 & 2033
- Figure 50: Middle East & Africa High Voltage Busbars Volume Share (%), by Country 2025 & 2033
- Figure 51: Asia Pacific High Voltage Busbars Revenue (billion), by Application 2025 & 2033
- Figure 52: Asia Pacific High Voltage Busbars Volume (K), by Application 2025 & 2033
- Figure 53: Asia Pacific High Voltage Busbars Revenue Share (%), by Application 2025 & 2033
- Figure 54: Asia Pacific High Voltage Busbars Volume Share (%), by Application 2025 & 2033
- Figure 55: Asia Pacific High Voltage Busbars Revenue (billion), by Types 2025 & 2033
- Figure 56: Asia Pacific High Voltage Busbars Volume (K), by Types 2025 & 2033
- Figure 57: Asia Pacific High Voltage Busbars Revenue Share (%), by Types 2025 & 2033
- Figure 58: Asia Pacific High Voltage Busbars Volume Share (%), by Types 2025 & 2033
- Figure 59: Asia Pacific High Voltage Busbars Revenue (billion), by Country 2025 & 2033
- Figure 60: Asia Pacific High Voltage Busbars Volume (K), by Country 2025 & 2033
- Figure 61: Asia Pacific High Voltage Busbars Revenue Share (%), by Country 2025 & 2033
- Figure 62: Asia Pacific High Voltage Busbars Volume Share (%), by Country 2025 & 2033
List of Tables
- Table 1: Global High Voltage Busbars Revenue billion Forecast, by Application 2020 & 2033
- Table 2: Global High Voltage Busbars Volume K Forecast, by Application 2020 & 2033
- Table 3: Global High Voltage Busbars Revenue billion Forecast, by Types 2020 & 2033
- Table 4: Global High Voltage Busbars Volume K Forecast, by Types 2020 & 2033
- Table 5: Global High Voltage Busbars Revenue billion Forecast, by Region 2020 & 2033
- Table 6: Global High Voltage Busbars Volume K Forecast, by Region 2020 & 2033
- Table 7: Global High Voltage Busbars Revenue billion Forecast, by Application 2020 & 2033
- Table 8: Global High Voltage Busbars Volume K Forecast, by Application 2020 & 2033
- Table 9: Global High Voltage Busbars Revenue billion Forecast, by Types 2020 & 2033
- Table 10: Global High Voltage Busbars Volume K Forecast, by Types 2020 & 2033
- Table 11: Global High Voltage Busbars Revenue billion Forecast, by Country 2020 & 2033
- Table 12: Global High Voltage Busbars Volume K Forecast, by Country 2020 & 2033
- Table 13: United States High Voltage Busbars Revenue (billion) Forecast, by Application 2020 & 2033
- Table 14: United States High Voltage Busbars Volume (K) Forecast, by Application 2020 & 2033
- Table 15: Canada High Voltage Busbars Revenue (billion) Forecast, by Application 2020 & 2033
- Table 16: Canada High Voltage Busbars Volume (K) Forecast, by Application 2020 & 2033
- Table 17: Mexico High Voltage Busbars Revenue (billion) Forecast, by Application 2020 & 2033
- Table 18: Mexico High Voltage Busbars Volume (K) Forecast, by Application 2020 & 2033
- Table 19: Global High Voltage Busbars Revenue billion Forecast, by Application 2020 & 2033
- Table 20: Global High Voltage Busbars Volume K Forecast, by Application 2020 & 2033
- Table 21: Global High Voltage Busbars Revenue billion Forecast, by Types 2020 & 2033
- Table 22: Global High Voltage Busbars Volume K Forecast, by Types 2020 & 2033
- Table 23: Global High Voltage Busbars Revenue billion Forecast, by Country 2020 & 2033
- Table 24: Global High Voltage Busbars Volume K Forecast, by Country 2020 & 2033
- Table 25: Brazil High Voltage Busbars Revenue (billion) Forecast, by Application 2020 & 2033
- Table 26: Brazil High Voltage Busbars Volume (K) Forecast, by Application 2020 & 2033
- Table 27: Argentina High Voltage Busbars Revenue (billion) Forecast, by Application 2020 & 2033
- Table 28: Argentina High Voltage Busbars Volume (K) Forecast, by Application 2020 & 2033
- Table 29: Rest of South America High Voltage Busbars Revenue (billion) Forecast, by Application 2020 & 2033
- Table 30: Rest of South America High Voltage Busbars Volume (K) Forecast, by Application 2020 & 2033
- Table 31: Global High Voltage Busbars Revenue billion Forecast, by Application 2020 & 2033
- Table 32: Global High Voltage Busbars Volume K Forecast, by Application 2020 & 2033
- Table 33: Global High Voltage Busbars Revenue billion Forecast, by Types 2020 & 2033
- Table 34: Global High Voltage Busbars Volume K Forecast, by Types 2020 & 2033
- Table 35: Global High Voltage Busbars Revenue billion Forecast, by Country 2020 & 2033
- Table 36: Global High Voltage Busbars Volume K Forecast, by Country 2020 & 2033
- Table 37: United Kingdom High Voltage Busbars Revenue (billion) Forecast, by Application 2020 & 2033
- Table 38: United Kingdom High Voltage Busbars Volume (K) Forecast, by Application 2020 & 2033
- Table 39: Germany High Voltage Busbars Revenue (billion) Forecast, by Application 2020 & 2033
- Table 40: Germany High Voltage Busbars Volume (K) Forecast, by Application 2020 & 2033
- Table 41: France High Voltage Busbars Revenue (billion) Forecast, by Application 2020 & 2033
- Table 42: France High Voltage Busbars Volume (K) Forecast, by Application 2020 & 2033
- Table 43: Italy High Voltage Busbars Revenue (billion) Forecast, by Application 2020 & 2033
- Table 44: Italy High Voltage Busbars Volume (K) Forecast, by Application 2020 & 2033
- Table 45: Spain High Voltage Busbars Revenue (billion) Forecast, by Application 2020 & 2033
- Table 46: Spain High Voltage Busbars Volume (K) Forecast, by Application 2020 & 2033
- Table 47: Russia High Voltage Busbars Revenue (billion) Forecast, by Application 2020 & 2033
- Table 48: Russia High Voltage Busbars Volume (K) Forecast, by Application 2020 & 2033
- Table 49: Benelux High Voltage Busbars Revenue (billion) Forecast, by Application 2020 & 2033
- Table 50: Benelux High Voltage Busbars Volume (K) Forecast, by Application 2020 & 2033
- Table 51: Nordics High Voltage Busbars Revenue (billion) Forecast, by Application 2020 & 2033
- Table 52: Nordics High Voltage Busbars Volume (K) Forecast, by Application 2020 & 2033
- Table 53: Rest of Europe High Voltage Busbars Revenue (billion) Forecast, by Application 2020 & 2033
- Table 54: Rest of Europe High Voltage Busbars Volume (K) Forecast, by Application 2020 & 2033
- Table 55: Global High Voltage Busbars Revenue billion Forecast, by Application 2020 & 2033
- Table 56: Global High Voltage Busbars Volume K Forecast, by Application 2020 & 2033
- Table 57: Global High Voltage Busbars Revenue billion Forecast, by Types 2020 & 2033
- Table 58: Global High Voltage Busbars Volume K Forecast, by Types 2020 & 2033
- Table 59: Global High Voltage Busbars Revenue billion Forecast, by Country 2020 & 2033
- Table 60: Global High Voltage Busbars Volume K Forecast, by Country 2020 & 2033
- Table 61: Turkey High Voltage Busbars Revenue (billion) Forecast, by Application 2020 & 2033
- Table 62: Turkey High Voltage Busbars Volume (K) Forecast, by Application 2020 & 2033
- Table 63: Israel High Voltage Busbars Revenue (billion) Forecast, by Application 2020 & 2033
- Table 64: Israel High Voltage Busbars Volume (K) Forecast, by Application 2020 & 2033
- Table 65: GCC High Voltage Busbars Revenue (billion) Forecast, by Application 2020 & 2033
- Table 66: GCC High Voltage Busbars Volume (K) Forecast, by Application 2020 & 2033
- Table 67: North Africa High Voltage Busbars Revenue (billion) Forecast, by Application 2020 & 2033
- Table 68: North Africa High Voltage Busbars Volume (K) Forecast, by Application 2020 & 2033
- Table 69: South Africa High Voltage Busbars Revenue (billion) Forecast, by Application 2020 & 2033
- Table 70: South Africa High Voltage Busbars Volume (K) Forecast, by Application 2020 & 2033
- Table 71: Rest of Middle East & Africa High Voltage Busbars Revenue (billion) Forecast, by Application 2020 & 2033
- Table 72: Rest of Middle East & Africa High Voltage Busbars Volume (K) Forecast, by Application 2020 & 2033
- Table 73: Global High Voltage Busbars Revenue billion Forecast, by Application 2020 & 2033
- Table 74: Global High Voltage Busbars Volume K Forecast, by Application 2020 & 2033
- Table 75: Global High Voltage Busbars Revenue billion Forecast, by Types 2020 & 2033
- Table 76: Global High Voltage Busbars Volume K Forecast, by Types 2020 & 2033
- Table 77: Global High Voltage Busbars Revenue billion Forecast, by Country 2020 & 2033
- Table 78: Global High Voltage Busbars Volume K Forecast, by Country 2020 & 2033
- Table 79: China High Voltage Busbars Revenue (billion) Forecast, by Application 2020 & 2033
- Table 80: China High Voltage Busbars Volume (K) Forecast, by Application 2020 & 2033
- Table 81: India High Voltage Busbars Revenue (billion) Forecast, by Application 2020 & 2033
- Table 82: India High Voltage Busbars Volume (K) Forecast, by Application 2020 & 2033
- Table 83: Japan High Voltage Busbars Revenue (billion) Forecast, by Application 2020 & 2033
- Table 84: Japan High Voltage Busbars Volume (K) Forecast, by Application 2020 & 2033
- Table 85: South Korea High Voltage Busbars Revenue (billion) Forecast, by Application 2020 & 2033
- Table 86: South Korea High Voltage Busbars Volume (K) Forecast, by Application 2020 & 2033
- Table 87: ASEAN High Voltage Busbars Revenue (billion) Forecast, by Application 2020 & 2033
- Table 88: ASEAN High Voltage Busbars Volume (K) Forecast, by Application 2020 & 2033
- Table 89: Oceania High Voltage Busbars Revenue (billion) Forecast, by Application 2020 & 2033
- Table 90: Oceania High Voltage Busbars Volume (K) Forecast, by Application 2020 & 2033
- Table 91: Rest of Asia Pacific High Voltage Busbars Revenue (billion) Forecast, by Application 2020 & 2033
- Table 92: Rest of Asia Pacific High Voltage Busbars Volume (K) Forecast, by Application 2020 & 2033
Frequently Asked Questions
1. What is the projected Compound Annual Growth Rate (CAGR) of the High Voltage Busbars?
The projected CAGR is approximately 4.9%.
2. Which companies are prominent players in the High Voltage Busbars?
Key companies in the market include BSB Technology Development, Connor Manufacturing Services, Jenkent Electric Technology, Interplex, Crefact, EG Electronics, RHI's busbars, TE Connectivity, Rogers Corporation, Auto-Kabel, Methode Electronics, Suncall, Iwis e-tec, Mersen, RHI ELectric, Intercable Automotive Solutions (Aptiv), Everwin Technology.
3. What are the main segments of the High Voltage Busbars?
The market segments include Application, Types.
4. Can you provide details about the market size?
The market size is estimated to be USD 17.7 billion as of 2022.
5. What are some drivers contributing to market growth?
N/A
6. What are the notable trends driving market growth?
N/A
7. Are there any restraints impacting market growth?
N/A
8. Can you provide examples of recent developments in the market?
N/A
9. What pricing options are available for accessing the report?
Pricing options include single-user, multi-user, and enterprise licenses priced at USD 4350.00, USD 6525.00, and USD 8700.00 respectively.
10. Is the market size provided in terms of value or volume?
The market size is provided in terms of value, measured in billion and volume, measured in K.
11. Are there any specific market keywords associated with the report?
Yes, the market keyword associated with the report is "High Voltage Busbars," which aids in identifying and referencing the specific market segment covered.
12. How do I determine which pricing option suits my needs best?
The pricing options vary based on user requirements and access needs. Individual users may opt for single-user licenses, while businesses requiring broader access may choose multi-user or enterprise licenses for cost-effective access to the report.
13. Are there any additional resources or data provided in the High Voltage Busbars report?
While the report offers comprehensive insights, it's advisable to review the specific contents or supplementary materials provided to ascertain if additional resources or data are available.
14. How can I stay updated on further developments or reports in the High Voltage Busbars?
To stay informed about further developments, trends, and reports in the High Voltage Busbars, consider subscribing to industry newsletters, following relevant companies and organizations, or regularly checking reputable industry news sources and publications.
Methodology
Step 1 - Identification of Relevant Samples Size from Population Database


Step 2 - Approaches for Defining Global Market Size (Value, Volume* & Price*)

Note*: In applicable scenarios
Step 3 - Data Sources
Primary Research
- Web Analytics
- Survey Reports
- Research Institute
- Latest Research Reports
- Opinion Leaders
Secondary Research
- Annual Reports
- White Paper
- Latest Press Release
- Industry Association
- Paid Database
- Investor Presentations

Step 4 - Data Triangulation
Involves using different sources of information in order to increase the validity of a study
These sources are likely to be stakeholders in a program - participants, other researchers, program staff, other community members, and so on.
Then we put all data in single framework & apply various statistical tools to find out the dynamic on the market.
During the analysis stage, feedback from the stakeholder groups would be compared to determine areas of agreement as well as areas of divergence