

Key Insights
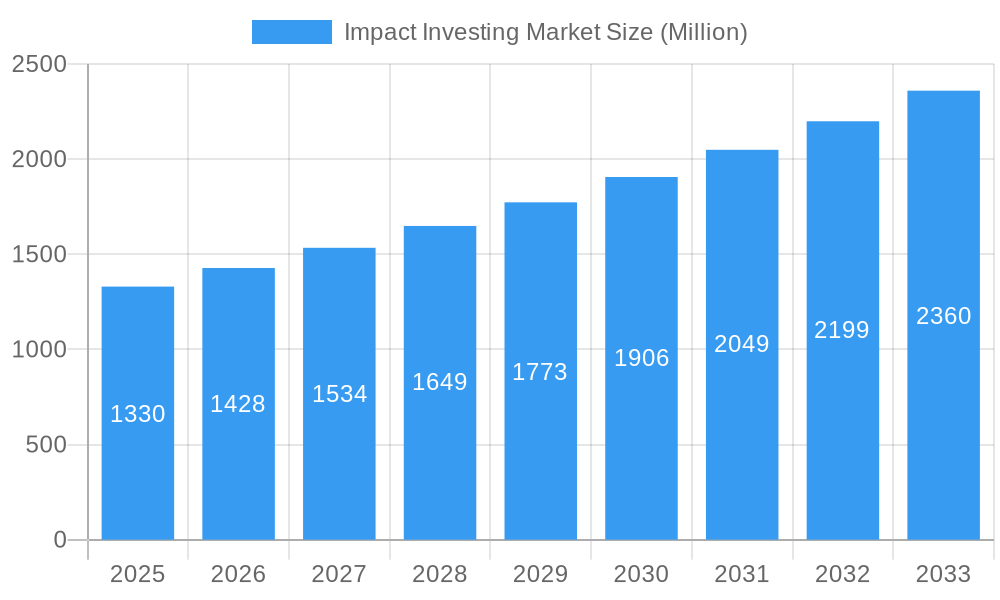
The impact investing market, valued at $1.33 billion in 2025, is projected to experience robust growth, exhibiting a compound annual growth rate (CAGR) of 7.17% from 2025 to 2033. This expansion is driven by several key factors. Increasing awareness of environmental, social, and governance (ESG) factors among investors is a primary driver, pushing capital towards ventures with demonstrable positive social and environmental impact. Furthermore, growing regulatory pressure encouraging sustainable investments, coupled with the rising demand for transparency and accountability in business practices, fuels this market's trajectory. The increasing availability of sophisticated impact measurement and management tools also empowers investors to better assess and track the social and environmental returns of their investments, fostering confidence and further driving growth. Finally, the emergence of innovative financial instruments designed specifically for impact investments, such as green bonds and social impact bonds, is broadening the range of investment opportunities and attracting a wider pool of capital.
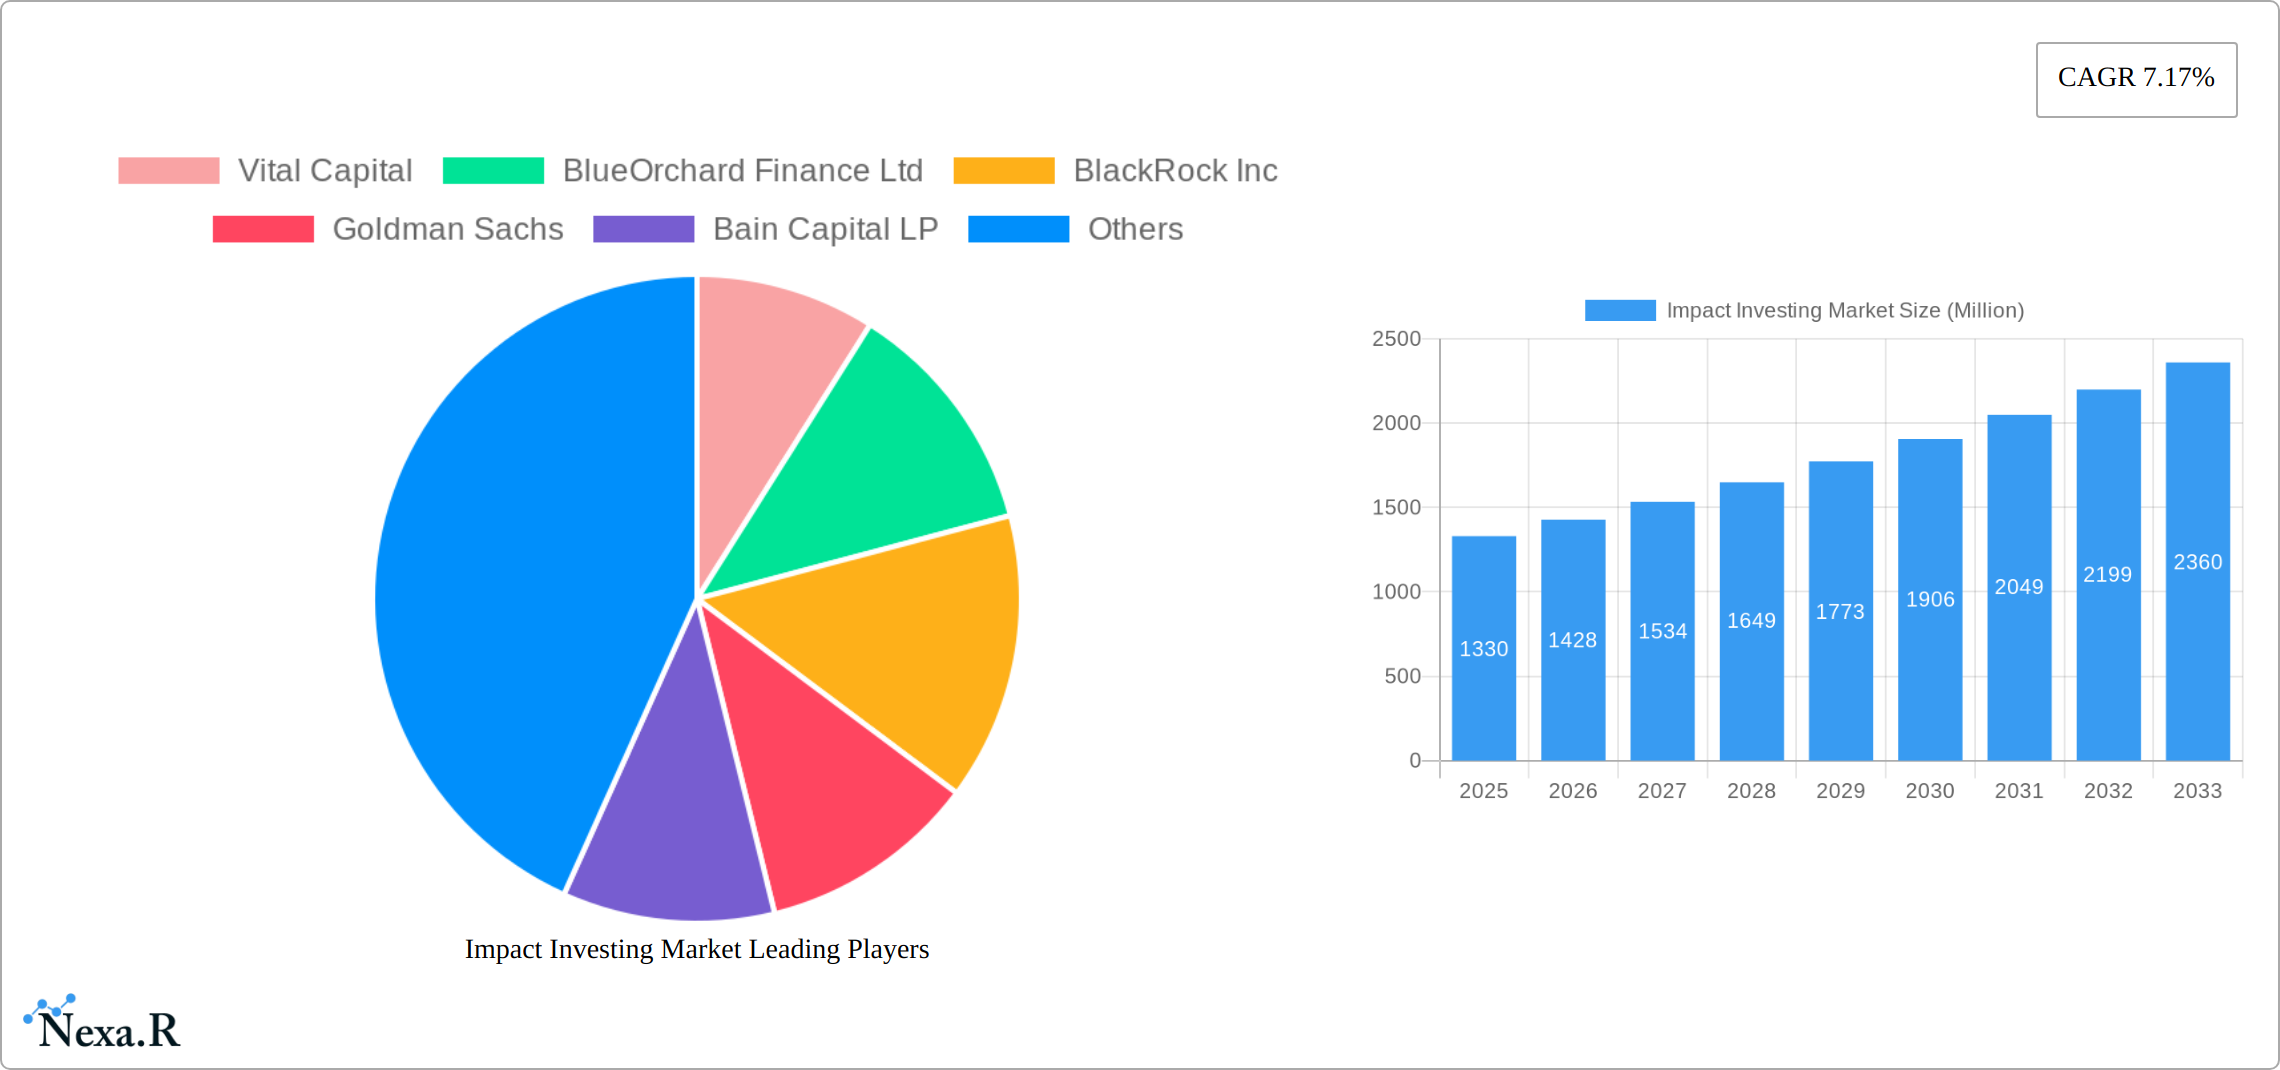
Impact Investing Market Market Size (In Billion)
The market segmentation reveals a diverse landscape of investment strategies, likely encompassing various sectors such as renewable energy, sustainable agriculture, affordable housing, and education. Leading players such as Vital Capital, BlueOrchard Finance Ltd, BlackRock Inc, and Goldman Sachs are actively shaping the market, reflecting the increasing mainstream acceptance of impact investing. However, challenges remain. While the market demonstrates strong growth potential, inconsistent impact measurement standards can hinder broader adoption. Furthermore, the relatively higher risk perception associated with some impact investments compared to traditional ones may deter some investors. Overcoming these hurdles through standardization and robust data reporting will be crucial for unlocking the full potential of the impact investing market in the coming years. The forecast period, 2025-2033, promises significant growth, driven by the confluence of these factors, positioning impact investing as a crucial component of a more sustainable and equitable financial future.
Impact Investing Market Company Market Share
Impact Investing Market: A Comprehensive Report (2019-2033)
This in-depth report provides a comprehensive analysis of the Impact Investing Market, encompassing market dynamics, growth trends, regional dominance, product landscapes, key players, and future outlook. The study period covers 2019-2033, with 2025 as the base and estimated year. The report offers invaluable insights for investors, industry professionals, and strategic decision-makers seeking to navigate this rapidly evolving market. The market is segmented into various sub-sectors, providing a granular view of its composition. The total market size in 2025 is estimated at xx Million and is projected to reach xx Million by 2033, exhibiting a CAGR of xx%.
Impact Investing Market Dynamics & Structure
This section analyzes the Impact Investing Market's structure, focusing on market concentration, technological advancements, regulatory influences, competitive dynamics, and M&A activity. The market shows a moderately concentrated structure, with several large players holding significant market share. However, the emergence of specialized firms and niche players is leading to increased competition.
- Market Concentration: The top 5 players (BlackRock Inc, Goldman Sachs, Bain Capital LP, Morgan Stanley, Prudential Financial Inc) hold approximately xx% of the market share in 2025.
- Technological Innovation: Fintech advancements are streamlining impact investing processes, improving transparency, and broadening access. However, data standardization and integration remain significant innovation barriers.
- Regulatory Frameworks: Varying regulatory landscapes across jurisdictions influence investment strategies and compliance requirements. Harmonization efforts are underway, but inconsistencies persist.
- Competitive Product Substitutes: Traditional investment vehicles remain competitive alternatives. The unique value proposition of impact investing, however, continues to attract investors seeking both financial returns and social impact.
- End-User Demographics: A growing segment of impact-conscious investors (high-net-worth individuals, institutional investors, and foundations) drive market demand.
- M&A Trends: The recent acquisitions of GIP by BlackRock Inc. and Kreos Capital by BlackRock Inc. illustrate the consolidation trend within the industry, driven by increased competition and the pursuit of diversified portfolios. The total value of M&A deals in 2024 was estimated at xx Million, a xx% increase from 2023.
Impact Investing Market Growth Trends & Insights
The Impact Investing Market is experiencing robust growth, driven by a confluence of factors. Increased awareness of environmental, social, and governance (ESG) factors is paramount, fueling a surge in demand for sustainable and responsible investments. Market expansion has been significant from 2019-2024, and this upward trajectory is forecast to continue, even accelerate, in the coming years. Technological advancements, particularly blockchain and AI, are revolutionizing impact measurement and reporting, enhancing transparency and efficiency. Furthermore, a fundamental shift in consumer preferences toward ethical and sustainable investments is a key propellant of market growth. This preference is not limited to individual investors; institutional investors are increasingly incorporating ESG criteria into their investment strategies.
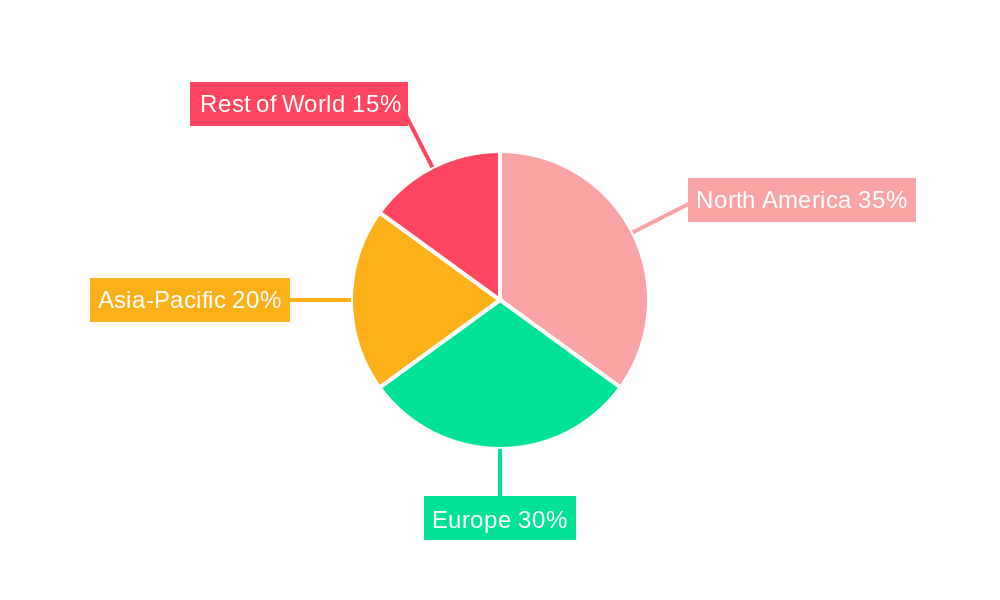
Dominant Regions, Countries, or Segments in Impact Investing Market
While North America and Europe currently hold the largest market shares, driven by strong regulatory frameworks, established impact investment firms, and high concentrations of investors, significant growth potential lies elsewhere. Let's examine the key players:
- North America: Robust regulatory support for ESG investing, a mature impact investing ecosystem with major firms, and a substantial pool of both institutional and individual investors contribute to its leading position.
- Europe: The EU Sustainable Finance Disclosure Regulation (SFDR) has significantly influenced the market, alongside heightened ESG risk awareness and a strong commitment to the UN Sustainable Development Goals.
- Asia-Pacific: This region presents the fastest projected growth rate, fueled by rapid economic expansion, a burgeoning middle class, and supportive government initiatives promoting sustainable development. Specific countries within this region, like India and China, are emerging as impactful players due to their large populations and developing economies.
- Latin America: A growing number of impact investing initiatives are focusing on this region, addressing critical social and environmental challenges while tapping into the potential for significant returns.
- Africa: While still a relatively nascent market, Africa presents immense potential for impact investing, focusing on addressing development challenges and fostering sustainable economic growth.
Impact Investing Market Product Landscape
The Impact Investing Market showcases a diverse array of products and services catering to various investor needs and risk profiles. These include private equity funds, venture capital, debt financing, and real estate investments, all strategically focused on sectors such as renewable energy, affordable housing, sustainable agriculture, and social enterprises. Product innovation is a key driver, characterized by an increasing emphasis on transparency, robust impact measurement methodologies, and diversified investment options. Technological advancements play a crucial role in enabling the tracking and verification of social and environmental impacts, instilling greater confidence and accountability.
Key Drivers, Barriers & Challenges in Impact Investing Market
Key Drivers:
- Increased awareness of ESG factors among investors.
- Growing demand for sustainable and responsible investments.
- Technological advancements facilitating impact measurement and reporting.
- Supportive government policies and regulations.
Key Challenges:
- Data standardization and comparability of impact metrics remain a challenge.
- Difficulty in accurately measuring and verifying social and environmental impact.
- Limited access to capital for some impact investing initiatives, particularly in developing countries. This results in a funding gap estimated at xx Million in 2025.
- Competition from traditional investment vehicles.
Emerging Opportunities in Impact Investing Market
- Untapped markets in developing countries.
- Growing demand for impact investing solutions in emerging sectors, such as sustainable technology and circular economy.
- Increased focus on blended finance models that combine public and private capital.
- Growing interest in impact measurement and reporting standards.
Growth Accelerators in the Impact Investing Market Industry
Several key factors are accelerating growth within the impact investing market. Technological advancements, particularly blockchain for enhanced transparency and the development of sophisticated impact measurement methodologies, are paramount. Strategic partnerships between impact investors, governments, and non-governmental organizations (NGOs) are proving highly effective in fostering market expansion. Furthermore, increasing regulatory support and a growing awareness of ESG issues among investors are fueling this momentum. The emergence of blended finance models, combining philanthropic and commercial capital, is also playing a significant role in scaling impact investments.
Key Players Shaping the Impact Investing Market Market
- Vital Capital
- BlueOrchard Finance Ltd
- BlackRock Inc
- Goldman Sachs
- Bain Capital LP
- Morgan Stanley
- Prudential Financial Inc
- Manulife Investment Management Holdings (Canada) Inc
- Leapfrog Investments
- Community Investment Management LLC
- List Not Exhaustive
Notable Milestones in Impact Investing Market Sector
- August 2023: BlackRock Inc. acquired Kreos Capital, expanding its presence in the venture debt market.
- January 2024: Staley Point Capital and Bain Capital Real Estate completed a USD 38.4 million sale of an industrial property, highlighting strong demand in the sector.
- January 2024: BlackRock Inc. acquired GIP for USD 3 billion in cash and 12 million shares, demonstrating significant consolidation in the infrastructure investment space.
In-Depth Impact Investing Market Market Outlook
The Impact Investing Market is poised for substantial growth throughout the forecast period (2025-2033). This positive outlook is driven by a powerful combination of technological advancements, increasing ESG awareness, supportive regulatory environments, and strategic partnerships. Innovative investment vehicles are continuously emerging, creating attractive opportunities for both established players and new entrants. A particularly exciting area of growth lies in developing economies, offering compelling returns for investors committed to sustainable and impactful outcomes. The market's future trajectory suggests a continued shift toward a more responsible and sustainable global financial system.
Impact Investing Market Segmentation
-
1. Type
- 1.1. Institutional Investors
- 1.2. Individual Investors
-
2. End User
- 2.1. Education
- 2.2. Agriculture
- 2.3. Healthcare
- 2.4. Climate Tech
Impact Investing Market Segmentation By Geography
-
1. North America
- 1.1. United States
- 1.2. Canada
- 1.3. Mexico
-
2. South America
- 2.1. Brazil
- 2.2. Argentina
- 2.3. Rest of South America
-
3. Europe
- 3.1. United Kingdom
- 3.2. Germany
- 3.3. France
- 3.4. Italy
- 3.5. Spain
- 3.6. Russia
- 3.7. Benelux
- 3.8. Nordics
- 3.9. Rest of Europe
-
4. Middle East & Africa
- 4.1. Turkey
- 4.2. Israel
- 4.3. GCC
- 4.4. North Africa
- 4.5. South Africa
- 4.6. Rest of Middle East & Africa
-
5. Asia Pacific
- 5.1. China
- 5.2. India
- 5.3. Japan
- 5.4. South Korea
- 5.5. ASEAN
- 5.6. Oceania
- 5.7. Rest of Asia Pacific
Impact Investing Market Regional Market Share
Geographic Coverage of Impact Investing Market
Impact Investing Market REPORT HIGHLIGHTS
| Aspects | Details |
|---|---|
| Study Period | 2020-2034 |
| Base Year | 2025 |
| Estimated Year | 2026 |
| Forecast Period | 2026-2034 |
| Historical Period | 2020-2025 |
| Growth Rate | CAGR of 7.17% from 2020-2034 |
| Segmentation |
|
Table of Contents
- 1. Introduction
- 1.1. Research Scope
- 1.2. Market Segmentation
- 1.3. Research Objective
- 1.4. Definitions and Assumptions
- 2. Executive Summary
- 2.1. Market Snapshot
- 3. Market Dynamics
- 3.1. Market Drivers
- 3.2. Market Restrains
- 3.3. Market Trends
- 3.4. Market Opportunities
- 4. Market Factor Analysis
- 4.1. Porters Five Forces
- 4.1.1. Bargaining Power of Suppliers
- 4.1.2. Bargaining Power of Buyers
- 4.1.3. Threat of New Entrants
- 4.1.4. Threat of Substitutes
- 4.1.5. Competitive Rivalry
- 4.2. PESTEL analysis
- 4.3. BCG Analysis
- 4.3.1. Stars (High Growth, High Market Share)
- 4.3.2. Cash Cows (Low Growth, High Market Share)
- 4.3.3. Question Mark (High Growth, Low Market Share)
- 4.3.4. Dogs (Low Growth, Low Market Share)
- 4.4. Ansoff Matrix Analysis
- 4.5. Supply Chain Analysis
- 4.6. Regulatory Landscape
- 4.7. Current Market Potential and Opportunity Assessment (TAM–SAM–SOM Framework)
- 4.8. NRP Analyst Note
- 4.1. Porters Five Forces
- 5. Market Analysis, Insights and Forecast 2021-2033
- 5.1. Market Analysis, Insights and Forecast - by Type
- 5.1.1. Institutional Investors
- 5.1.2. Individual Investors
- 5.2. Market Analysis, Insights and Forecast - by End User
- 5.2.1. Education
- 5.2.2. Agriculture
- 5.2.3. Healthcare
- 5.2.4. Climate Tech
- 5.3. Market Analysis, Insights and Forecast - by Region
- 5.3.1. North America
- 5.3.2. South America
- 5.3.3. Europe
- 5.3.4. Middle East & Africa
- 5.3.5. Asia Pacific
- 5.1. Market Analysis, Insights and Forecast - by Type
- 6. Global Impact Investing Market Analysis, Insights and Forecast, 2021-2033
- 6.1. Market Analysis, Insights and Forecast - by Type
- 6.1.1. Institutional Investors
- 6.1.2. Individual Investors
- 6.2. Market Analysis, Insights and Forecast - by End User
- 6.2.1. Education
- 6.2.2. Agriculture
- 6.2.3. Healthcare
- 6.2.4. Climate Tech
- 6.1. Market Analysis, Insights and Forecast - by Type
- 7. North America Impact Investing Market Analysis, Insights and Forecast, 2020-2032
- 7.1. Market Analysis, Insights and Forecast - by Type
- 7.1.1. Institutional Investors
- 7.1.2. Individual Investors
- 7.2. Market Analysis, Insights and Forecast - by End User
- 7.2.1. Education
- 7.2.2. Agriculture
- 7.2.3. Healthcare
- 7.2.4. Climate Tech
- 7.1. Market Analysis, Insights and Forecast - by Type
- 8. South America Impact Investing Market Analysis, Insights and Forecast, 2020-2032
- 8.1. Market Analysis, Insights and Forecast - by Type
- 8.1.1. Institutional Investors
- 8.1.2. Individual Investors
- 8.2. Market Analysis, Insights and Forecast - by End User
- 8.2.1. Education
- 8.2.2. Agriculture
- 8.2.3. Healthcare
- 8.2.4. Climate Tech
- 8.1. Market Analysis, Insights and Forecast - by Type
- 9. Europe Impact Investing Market Analysis, Insights and Forecast, 2020-2032
- 9.1. Market Analysis, Insights and Forecast - by Type
- 9.1.1. Institutional Investors
- 9.1.2. Individual Investors
- 9.2. Market Analysis, Insights and Forecast - by End User
- 9.2.1. Education
- 9.2.2. Agriculture
- 9.2.3. Healthcare
- 9.2.4. Climate Tech
- 9.1. Market Analysis, Insights and Forecast - by Type
- 10. Middle East & Africa Impact Investing Market Analysis, Insights and Forecast, 2020-2032
- 10.1. Market Analysis, Insights and Forecast - by Type
- 10.1.1. Institutional Investors
- 10.1.2. Individual Investors
- 10.2. Market Analysis, Insights and Forecast - by End User
- 10.2.1. Education
- 10.2.2. Agriculture
- 10.2.3. Healthcare
- 10.2.4. Climate Tech
- 10.1. Market Analysis, Insights and Forecast - by Type
- 11. Asia Pacific Impact Investing Market Analysis, Insights and Forecast, 2020-2032
- 11.1. Market Analysis, Insights and Forecast - by Type
- 11.1.1. Institutional Investors
- 11.1.2. Individual Investors
- 11.2. Market Analysis, Insights and Forecast - by End User
- 11.2.1. Education
- 11.2.2. Agriculture
- 11.2.3. Healthcare
- 11.2.4. Climate Tech
- 11.1. Market Analysis, Insights and Forecast - by Type
- 12. Competitive Analysis
- 12.1. Company Profiles
- 12.1.1 Vital Capital
- 12.1.1.1. Company Overview
- 12.1.1.2. Products
- 12.1.1.3. Company Financials
- 12.1.1.4. SWOT Analysis
- 12.1.2 BlueOrchard Finance Ltd
- 12.1.2.1. Company Overview
- 12.1.2.2. Products
- 12.1.2.3. Company Financials
- 12.1.2.4. SWOT Analysis
- 12.1.3 BlackRock Inc
- 12.1.3.1. Company Overview
- 12.1.3.2. Products
- 12.1.3.3. Company Financials
- 12.1.3.4. SWOT Analysis
- 12.1.4 Goldman Sachs
- 12.1.4.1. Company Overview
- 12.1.4.2. Products
- 12.1.4.3. Company Financials
- 12.1.4.4. SWOT Analysis
- 12.1.5 Bain Capital LP
- 12.1.5.1. Company Overview
- 12.1.5.2. Products
- 12.1.5.3. Company Financials
- 12.1.5.4. SWOT Analysis
- 12.1.6 Morgan Stanley
- 12.1.6.1. Company Overview
- 12.1.6.2. Products
- 12.1.6.3. Company Financials
- 12.1.6.4. SWOT Analysis
- 12.1.7 Prudential Financial Inc
- 12.1.7.1. Company Overview
- 12.1.7.2. Products
- 12.1.7.3. Company Financials
- 12.1.7.4. SWOT Analysis
- 12.1.8 Manulife Investment Management Holdings (Canada) Inc
- 12.1.8.1. Company Overview
- 12.1.8.2. Products
- 12.1.8.3. Company Financials
- 12.1.8.4. SWOT Analysis
- 12.1.9 Leapfrog Investments
- 12.1.9.1. Company Overview
- 12.1.9.2. Products
- 12.1.9.3. Company Financials
- 12.1.9.4. SWOT Analysis
- 12.1.10 Community Investment Management LLC**List Not Exhaustive
- 12.1.10.1. Company Overview
- 12.1.10.2. Products
- 12.1.10.3. Company Financials
- 12.1.10.4. SWOT Analysis
- 12.1.1 Vital Capital
- 12.2. Market Entropy
- 12.2.1 Company's Key Areas Served
- 12.2.2 Recent Developments
- 12.3. Company Market Share Analysis 2025
- 12.3.1 Top 5 Companies Market Share Analysis
- 12.3.2 Top 3 Companies Market Share Analysis
- 12.4. List of Potential Customers
- 13. Research Methodology
List of Figures
- Figure 1: Global Impact Investing Market Revenue Breakdown (Million, %) by Region 2025 & 2033
- Figure 2: Global Impact Investing Market Volume Breakdown (Trillion, %) by Region 2025 & 2033
- Figure 3: North America Impact Investing Market Revenue (Million), by Type 2025 & 2033
- Figure 4: North America Impact Investing Market Volume (Trillion), by Type 2025 & 2033
- Figure 5: North America Impact Investing Market Revenue Share (%), by Type 2025 & 2033
- Figure 6: North America Impact Investing Market Volume Share (%), by Type 2025 & 2033
- Figure 7: North America Impact Investing Market Revenue (Million), by End User 2025 & 2033
- Figure 8: North America Impact Investing Market Volume (Trillion), by End User 2025 & 2033
- Figure 9: North America Impact Investing Market Revenue Share (%), by End User 2025 & 2033
- Figure 10: North America Impact Investing Market Volume Share (%), by End User 2025 & 2033
- Figure 11: North America Impact Investing Market Revenue (Million), by Country 2025 & 2033
- Figure 12: North America Impact Investing Market Volume (Trillion), by Country 2025 & 2033
- Figure 13: North America Impact Investing Market Revenue Share (%), by Country 2025 & 2033
- Figure 14: North America Impact Investing Market Volume Share (%), by Country 2025 & 2033
- Figure 15: South America Impact Investing Market Revenue (Million), by Type 2025 & 2033
- Figure 16: South America Impact Investing Market Volume (Trillion), by Type 2025 & 2033
- Figure 17: South America Impact Investing Market Revenue Share (%), by Type 2025 & 2033
- Figure 18: South America Impact Investing Market Volume Share (%), by Type 2025 & 2033
- Figure 19: South America Impact Investing Market Revenue (Million), by End User 2025 & 2033
- Figure 20: South America Impact Investing Market Volume (Trillion), by End User 2025 & 2033
- Figure 21: South America Impact Investing Market Revenue Share (%), by End User 2025 & 2033
- Figure 22: South America Impact Investing Market Volume Share (%), by End User 2025 & 2033
- Figure 23: South America Impact Investing Market Revenue (Million), by Country 2025 & 2033
- Figure 24: South America Impact Investing Market Volume (Trillion), by Country 2025 & 2033
- Figure 25: South America Impact Investing Market Revenue Share (%), by Country 2025 & 2033
- Figure 26: South America Impact Investing Market Volume Share (%), by Country 2025 & 2033
- Figure 27: Europe Impact Investing Market Revenue (Million), by Type 2025 & 2033
- Figure 28: Europe Impact Investing Market Volume (Trillion), by Type 2025 & 2033
- Figure 29: Europe Impact Investing Market Revenue Share (%), by Type 2025 & 2033
- Figure 30: Europe Impact Investing Market Volume Share (%), by Type 2025 & 2033
- Figure 31: Europe Impact Investing Market Revenue (Million), by End User 2025 & 2033
- Figure 32: Europe Impact Investing Market Volume (Trillion), by End User 2025 & 2033
- Figure 33: Europe Impact Investing Market Revenue Share (%), by End User 2025 & 2033
- Figure 34: Europe Impact Investing Market Volume Share (%), by End User 2025 & 2033
- Figure 35: Europe Impact Investing Market Revenue (Million), by Country 2025 & 2033
- Figure 36: Europe Impact Investing Market Volume (Trillion), by Country 2025 & 2033
- Figure 37: Europe Impact Investing Market Revenue Share (%), by Country 2025 & 2033
- Figure 38: Europe Impact Investing Market Volume Share (%), by Country 2025 & 2033
- Figure 39: Middle East & Africa Impact Investing Market Revenue (Million), by Type 2025 & 2033
- Figure 40: Middle East & Africa Impact Investing Market Volume (Trillion), by Type 2025 & 2033
- Figure 41: Middle East & Africa Impact Investing Market Revenue Share (%), by Type 2025 & 2033
- Figure 42: Middle East & Africa Impact Investing Market Volume Share (%), by Type 2025 & 2033
- Figure 43: Middle East & Africa Impact Investing Market Revenue (Million), by End User 2025 & 2033
- Figure 44: Middle East & Africa Impact Investing Market Volume (Trillion), by End User 2025 & 2033
- Figure 45: Middle East & Africa Impact Investing Market Revenue Share (%), by End User 2025 & 2033
- Figure 46: Middle East & Africa Impact Investing Market Volume Share (%), by End User 2025 & 2033
- Figure 47: Middle East & Africa Impact Investing Market Revenue (Million), by Country 2025 & 2033
- Figure 48: Middle East & Africa Impact Investing Market Volume (Trillion), by Country 2025 & 2033
- Figure 49: Middle East & Africa Impact Investing Market Revenue Share (%), by Country 2025 & 2033
- Figure 50: Middle East & Africa Impact Investing Market Volume Share (%), by Country 2025 & 2033
- Figure 51: Asia Pacific Impact Investing Market Revenue (Million), by Type 2025 & 2033
- Figure 52: Asia Pacific Impact Investing Market Volume (Trillion), by Type 2025 & 2033
- Figure 53: Asia Pacific Impact Investing Market Revenue Share (%), by Type 2025 & 2033
- Figure 54: Asia Pacific Impact Investing Market Volume Share (%), by Type 2025 & 2033
- Figure 55: Asia Pacific Impact Investing Market Revenue (Million), by End User 2025 & 2033
- Figure 56: Asia Pacific Impact Investing Market Volume (Trillion), by End User 2025 & 2033
- Figure 57: Asia Pacific Impact Investing Market Revenue Share (%), by End User 2025 & 2033
- Figure 58: Asia Pacific Impact Investing Market Volume Share (%), by End User 2025 & 2033
- Figure 59: Asia Pacific Impact Investing Market Revenue (Million), by Country 2025 & 2033
- Figure 60: Asia Pacific Impact Investing Market Volume (Trillion), by Country 2025 & 2033
- Figure 61: Asia Pacific Impact Investing Market Revenue Share (%), by Country 2025 & 2033
- Figure 62: Asia Pacific Impact Investing Market Volume Share (%), by Country 2025 & 2033
List of Tables
- Table 1: Global Impact Investing Market Revenue Million Forecast, by Type 2020 & 2033
- Table 2: Global Impact Investing Market Volume Trillion Forecast, by Type 2020 & 2033
- Table 3: Global Impact Investing Market Revenue Million Forecast, by End User 2020 & 2033
- Table 4: Global Impact Investing Market Volume Trillion Forecast, by End User 2020 & 2033
- Table 5: Global Impact Investing Market Revenue Million Forecast, by Region 2020 & 2033
- Table 6: Global Impact Investing Market Volume Trillion Forecast, by Region 2020 & 2033
- Table 7: Global Impact Investing Market Revenue Million Forecast, by Type 2020 & 2033
- Table 8: Global Impact Investing Market Volume Trillion Forecast, by Type 2020 & 2033
- Table 9: Global Impact Investing Market Revenue Million Forecast, by End User 2020 & 2033
- Table 10: Global Impact Investing Market Volume Trillion Forecast, by End User 2020 & 2033
- Table 11: Global Impact Investing Market Revenue Million Forecast, by Country 2020 & 2033
- Table 12: Global Impact Investing Market Volume Trillion Forecast, by Country 2020 & 2033
- Table 13: United States Impact Investing Market Revenue (Million) Forecast, by Application 2020 & 2033
- Table 14: United States Impact Investing Market Volume (Trillion) Forecast, by Application 2020 & 2033
- Table 15: Canada Impact Investing Market Revenue (Million) Forecast, by Application 2020 & 2033
- Table 16: Canada Impact Investing Market Volume (Trillion) Forecast, by Application 2020 & 2033
- Table 17: Mexico Impact Investing Market Revenue (Million) Forecast, by Application 2020 & 2033
- Table 18: Mexico Impact Investing Market Volume (Trillion) Forecast, by Application 2020 & 2033
- Table 19: Global Impact Investing Market Revenue Million Forecast, by Type 2020 & 2033
- Table 20: Global Impact Investing Market Volume Trillion Forecast, by Type 2020 & 2033
- Table 21: Global Impact Investing Market Revenue Million Forecast, by End User 2020 & 2033
- Table 22: Global Impact Investing Market Volume Trillion Forecast, by End User 2020 & 2033
- Table 23: Global Impact Investing Market Revenue Million Forecast, by Country 2020 & 2033
- Table 24: Global Impact Investing Market Volume Trillion Forecast, by Country 2020 & 2033
- Table 25: Brazil Impact Investing Market Revenue (Million) Forecast, by Application 2020 & 2033
- Table 26: Brazil Impact Investing Market Volume (Trillion) Forecast, by Application 2020 & 2033
- Table 27: Argentina Impact Investing Market Revenue (Million) Forecast, by Application 2020 & 2033
- Table 28: Argentina Impact Investing Market Volume (Trillion) Forecast, by Application 2020 & 2033
- Table 29: Rest of South America Impact Investing Market Revenue (Million) Forecast, by Application 2020 & 2033
- Table 30: Rest of South America Impact Investing Market Volume (Trillion) Forecast, by Application 2020 & 2033
- Table 31: Global Impact Investing Market Revenue Million Forecast, by Type 2020 & 2033
- Table 32: Global Impact Investing Market Volume Trillion Forecast, by Type 2020 & 2033
- Table 33: Global Impact Investing Market Revenue Million Forecast, by End User 2020 & 2033
- Table 34: Global Impact Investing Market Volume Trillion Forecast, by End User 2020 & 2033
- Table 35: Global Impact Investing Market Revenue Million Forecast, by Country 2020 & 2033
- Table 36: Global Impact Investing Market Volume Trillion Forecast, by Country 2020 & 2033
- Table 37: United Kingdom Impact Investing Market Revenue (Million) Forecast, by Application 2020 & 2033
- Table 38: United Kingdom Impact Investing Market Volume (Trillion) Forecast, by Application 2020 & 2033
- Table 39: Germany Impact Investing Market Revenue (Million) Forecast, by Application 2020 & 2033
- Table 40: Germany Impact Investing Market Volume (Trillion) Forecast, by Application 2020 & 2033
- Table 41: France Impact Investing Market Revenue (Million) Forecast, by Application 2020 & 2033
- Table 42: France Impact Investing Market Volume (Trillion) Forecast, by Application 2020 & 2033
- Table 43: Italy Impact Investing Market Revenue (Million) Forecast, by Application 2020 & 2033
- Table 44: Italy Impact Investing Market Volume (Trillion) Forecast, by Application 2020 & 2033
- Table 45: Spain Impact Investing Market Revenue (Million) Forecast, by Application 2020 & 2033
- Table 46: Spain Impact Investing Market Volume (Trillion) Forecast, by Application 2020 & 2033
- Table 47: Russia Impact Investing Market Revenue (Million) Forecast, by Application 2020 & 2033
- Table 48: Russia Impact Investing Market Volume (Trillion) Forecast, by Application 2020 & 2033
- Table 49: Benelux Impact Investing Market Revenue (Million) Forecast, by Application 2020 & 2033
- Table 50: Benelux Impact Investing Market Volume (Trillion) Forecast, by Application 2020 & 2033
- Table 51: Nordics Impact Investing Market Revenue (Million) Forecast, by Application 2020 & 2033
- Table 52: Nordics Impact Investing Market Volume (Trillion) Forecast, by Application 2020 & 2033
- Table 53: Rest of Europe Impact Investing Market Revenue (Million) Forecast, by Application 2020 & 2033
- Table 54: Rest of Europe Impact Investing Market Volume (Trillion) Forecast, by Application 2020 & 2033
- Table 55: Global Impact Investing Market Revenue Million Forecast, by Type 2020 & 2033
- Table 56: Global Impact Investing Market Volume Trillion Forecast, by Type 2020 & 2033
- Table 57: Global Impact Investing Market Revenue Million Forecast, by End User 2020 & 2033
- Table 58: Global Impact Investing Market Volume Trillion Forecast, by End User 2020 & 2033
- Table 59: Global Impact Investing Market Revenue Million Forecast, by Country 2020 & 2033
- Table 60: Global Impact Investing Market Volume Trillion Forecast, by Country 2020 & 2033
- Table 61: Turkey Impact Investing Market Revenue (Million) Forecast, by Application 2020 & 2033
- Table 62: Turkey Impact Investing Market Volume (Trillion) Forecast, by Application 2020 & 2033
- Table 63: Israel Impact Investing Market Revenue (Million) Forecast, by Application 2020 & 2033
- Table 64: Israel Impact Investing Market Volume (Trillion) Forecast, by Application 2020 & 2033
- Table 65: GCC Impact Investing Market Revenue (Million) Forecast, by Application 2020 & 2033
- Table 66: GCC Impact Investing Market Volume (Trillion) Forecast, by Application 2020 & 2033
- Table 67: North Africa Impact Investing Market Revenue (Million) Forecast, by Application 2020 & 2033
- Table 68: North Africa Impact Investing Market Volume (Trillion) Forecast, by Application 2020 & 2033
- Table 69: South Africa Impact Investing Market Revenue (Million) Forecast, by Application 2020 & 2033
- Table 70: South Africa Impact Investing Market Volume (Trillion) Forecast, by Application 2020 & 2033
- Table 71: Rest of Middle East & Africa Impact Investing Market Revenue (Million) Forecast, by Application 2020 & 2033
- Table 72: Rest of Middle East & Africa Impact Investing Market Volume (Trillion) Forecast, by Application 2020 & 2033
- Table 73: Global Impact Investing Market Revenue Million Forecast, by Type 2020 & 2033
- Table 74: Global Impact Investing Market Volume Trillion Forecast, by Type 2020 & 2033
- Table 75: Global Impact Investing Market Revenue Million Forecast, by End User 2020 & 2033
- Table 76: Global Impact Investing Market Volume Trillion Forecast, by End User 2020 & 2033
- Table 77: Global Impact Investing Market Revenue Million Forecast, by Country 2020 & 2033
- Table 78: Global Impact Investing Market Volume Trillion Forecast, by Country 2020 & 2033
- Table 79: China Impact Investing Market Revenue (Million) Forecast, by Application 2020 & 2033
- Table 80: China Impact Investing Market Volume (Trillion) Forecast, by Application 2020 & 2033
- Table 81: India Impact Investing Market Revenue (Million) Forecast, by Application 2020 & 2033
- Table 82: India Impact Investing Market Volume (Trillion) Forecast, by Application 2020 & 2033
- Table 83: Japan Impact Investing Market Revenue (Million) Forecast, by Application 2020 & 2033
- Table 84: Japan Impact Investing Market Volume (Trillion) Forecast, by Application 2020 & 2033
- Table 85: South Korea Impact Investing Market Revenue (Million) Forecast, by Application 2020 & 2033
- Table 86: South Korea Impact Investing Market Volume (Trillion) Forecast, by Application 2020 & 2033
- Table 87: ASEAN Impact Investing Market Revenue (Million) Forecast, by Application 2020 & 2033
- Table 88: ASEAN Impact Investing Market Volume (Trillion) Forecast, by Application 2020 & 2033
- Table 89: Oceania Impact Investing Market Revenue (Million) Forecast, by Application 2020 & 2033
- Table 90: Oceania Impact Investing Market Volume (Trillion) Forecast, by Application 2020 & 2033
- Table 91: Rest of Asia Pacific Impact Investing Market Revenue (Million) Forecast, by Application 2020 & 2033
- Table 92: Rest of Asia Pacific Impact Investing Market Volume (Trillion) Forecast, by Application 2020 & 2033
Frequently Asked Questions
1. What is the projected Compound Annual Growth Rate (CAGR) of the Impact Investing Market?
The projected CAGR is approximately 7.17%.
2. Which companies are prominent players in the Impact Investing Market?
Key companies in the market include Vital Capital, BlueOrchard Finance Ltd, BlackRock Inc, Goldman Sachs, Bain Capital LP, Morgan Stanley, Prudential Financial Inc, Manulife Investment Management Holdings (Canada) Inc, Leapfrog Investments, Community Investment Management LLC**List Not Exhaustive.
3. What are the main segments of the Impact Investing Market?
The market segments include Type, End User.
4. Can you provide details about the market size?
The market size is estimated to be USD 1.33 Million as of 2022.
5. What are some drivers contributing to market growth?
Growing Awareness of Environmental and Social Issues is Fueling the Desire for Impact Investment; Rising Interest from Traditional Not-for-Profit Fund Managers.
6. What are the notable trends driving market growth?
Rising Investments from Institutional Investors.
7. Are there any restraints impacting market growth?
Growing Awareness of Environmental and Social Issues is Fueling the Desire for Impact Investment; Rising Interest from Traditional Not-for-Profit Fund Managers.
8. Can you provide examples of recent developments in the market?
January 2024: BlackRock Inc. and Global Infrastructure Partners (GIP), a prominent independent manager of infrastructure funds, jointly announced an agreement. As per this agreement, BlackRock would acquire GIP for a total value of USD 3 billion in cash and roughly 12 million shares of BlackRock's common stock.
9. What pricing options are available for accessing the report?
Pricing options include single-user, multi-user, and enterprise licenses priced at USD 3800, USD 4500, and USD 5800 respectively.
10. Is the market size provided in terms of value or volume?
The market size is provided in terms of value, measured in Million and volume, measured in Trillion.
11. Are there any specific market keywords associated with the report?
Yes, the market keyword associated with the report is "Impact Investing Market," which aids in identifying and referencing the specific market segment covered.
12. How do I determine which pricing option suits my needs best?
The pricing options vary based on user requirements and access needs. Individual users may opt for single-user licenses, while businesses requiring broader access may choose multi-user or enterprise licenses for cost-effective access to the report.
13. Are there any additional resources or data provided in the Impact Investing Market report?
While the report offers comprehensive insights, it's advisable to review the specific contents or supplementary materials provided to ascertain if additional resources or data are available.
14. How can I stay updated on further developments or reports in the Impact Investing Market?
To stay informed about further developments, trends, and reports in the Impact Investing Market, consider subscribing to industry newsletters, following relevant companies and organizations, or regularly checking reputable industry news sources and publications.
Methodology
Step 1 - Identification of Relevant Samples Size from Population Database


Step 2 - Approaches for Defining Global Market Size (Value, Volume* & Price*)

Note*: In applicable scenarios
Step 3 - Data Sources
Primary Research
- Web Analytics
- Survey Reports
- Research Institute
- Latest Research Reports
- Opinion Leaders
Secondary Research
- Annual Reports
- White Paper
- Latest Press Release
- Industry Association
- Paid Database
- Investor Presentations

Step 4 - Data Triangulation
Involves using different sources of information in order to increase the validity of a study
These sources are likely to be stakeholders in a program - participants, other researchers, program staff, other community members, and so on.
Then we put all data in single framework & apply various statistical tools to find out the dynamic on the market.
During the analysis stage, feedback from the stakeholder groups would be compared to determine areas of agreement as well as areas of divergence