

Key Insights
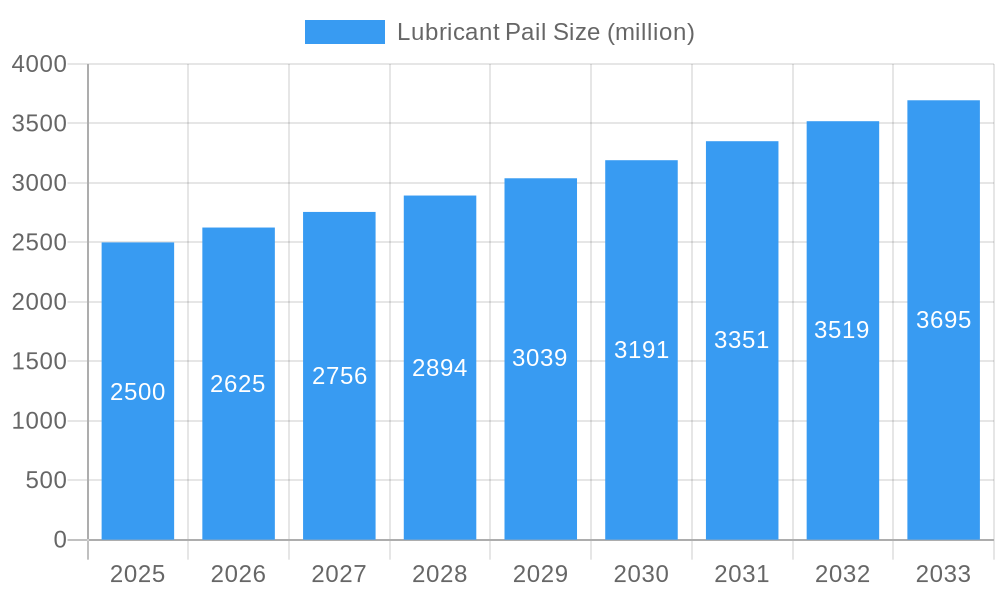
The global lubricant pail market is projected to expand significantly, driven by escalating demand across automotive, manufacturing, and construction sectors. Key growth catalysts include burgeoning industrialization in emerging economies, a rise in vehicle production and aftermarket services, and the adoption of advanced lubrication technologies to optimize equipment performance and longevity. Despite potential volatility in crude oil prices, the enduring need for efficient and dependable lubricant packaging ensures robust market expansion. The market is segmented by material (plastic, metal), size, and end-use industry. Leading manufacturers such as EP Container, Greif, and Jokey Plastics are actively pursuing innovation and strategic expansion, reinforcing a competitive market environment. The increasing preference for lightweight, durable, and recyclable plastic pails is a notable growth driver, particularly among environmentally conscious consumers and industrial clients. The estimated market size in 2025 is $2.28 billion, with a projected Compound Annual Growth Rate (CAGR) of 4.7% from 2025 to 2033, indicating substantial growth opportunities.
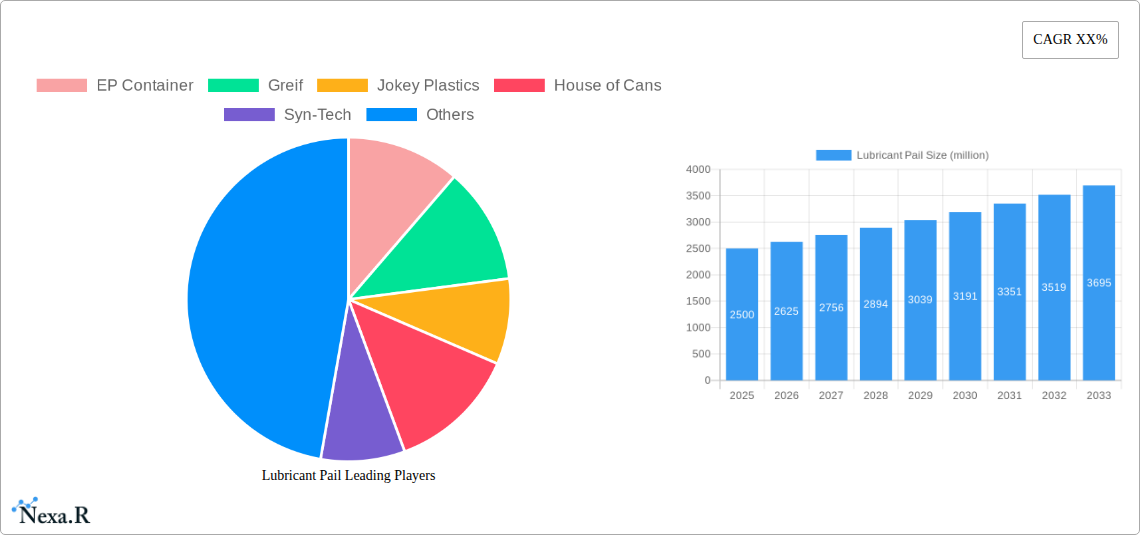
Lubricant Pail Market Size (In Billion)
Advancements in pail manufacturing technologies, including automated production and the utilization of innovative, leak-resistant materials, are enhancing efficiency and cost-effectiveness. Regional growth will vary, with developing nations expected to lead expansion due to rapid industrialization and infrastructure development. Evolving regulations on material usage and environmental considerations will shape future production and packaging methodologies. The competitive landscape features both established corporations and emerging entities. Strategic collaborations, mergers, and acquisitions are anticipated to continue influencing market dynamics. Overall, the lubricant pail market offers a compelling investment prospect with considerable growth potential throughout the forecast period.
Lubricant Pail Company Market Share
Lubricant Pail Market Report: 2019-2033
This comprehensive report provides an in-depth analysis of the global lubricant pail market, encompassing market dynamics, growth trends, regional performance, key players, and future outlook. The study period covers 2019-2033, with 2025 as the base and estimated year. The forecast period spans 2025-2033, and the historical period encompasses 2019-2024. This report is crucial for industry professionals, investors, and strategists seeking to navigate this dynamic market. The report analyzes the parent market of industrial packaging and the child market of lubricant packaging.
Lubricant Pail Market Dynamics & Structure
The lubricant pail market is characterized by moderate concentration, with several major players holding significant market share. Technological innovations, primarily in material science and manufacturing processes, are key drivers. Stringent regulatory frameworks concerning material safety and recyclability influence product design and manufacturing. Competitive substitutes, such as drums and bulk containers, pose challenges. End-user demographics, dominated by automotive, industrial, and agricultural sectors, shape demand patterns. The market has witnessed a moderate level of M&A activity in recent years, with consolidation among manufacturers expected to continue.
- Market Concentration: Moderately concentrated, with top 5 players holding approximately xx% market share (2025).
- Technological Innovation: Focus on lightweighting, improved barrier properties, and sustainable materials.
- Regulatory Landscape: Stringent regulations on material safety and recyclability in various regions.
- Competitive Substitutes: Drums, bulk containers, and flexible packaging represent key alternatives.
- End-User Demographics: Automotive, industrial, and agricultural sectors dominate demand.
- M&A Activity: xx major M&A deals recorded between 2019 and 2024.
Lubricant Pail Growth Trends & Insights
The global lubricant pail market experienced steady growth during the historical period (2019-2024), driven by increasing lubricant consumption across various end-use industries. The market size reached xx million units in 2024, exhibiting a CAGR of xx% during this period. Technological advancements in pail design and material science have enhanced product performance, leading to increased adoption rates. Shifting consumer preferences towards eco-friendly and sustainable packaging solutions are influencing market dynamics. The forecast period (2025-2033) anticipates continued growth, with a projected CAGR of xx%, driven by expanding industrial activity and increasing demand for lubricants in emerging economies. Market penetration is expected to increase from xx% in 2024 to xx% by 2033. Disruptions stemming from raw material price fluctuations and supply chain constraints are expected to influence growth trajectories.
Dominant Regions, Countries, or Segments in Lubricant Pail
North America currently dominates the lubricant pail market, driven by strong demand from the automotive and industrial sectors. This region benefits from established infrastructure and robust economic growth. Asia-Pacific is projected to experience the fastest growth rate during the forecast period, fueled by rapid industrialization and urbanization in countries like China and India. Europe holds a significant market share, but growth may be constrained by stringent environmental regulations. The automotive segment is the largest end-use sector globally, while the industrial segment shows high growth potential.
- North America: Strong automotive and industrial sectors; well-established infrastructure.
- Asia-Pacific: Fastest-growing region; driven by industrialization and urbanization in China and India.
- Europe: Significant market share; growth potentially constrained by environmental regulations.
- Automotive Segment: Largest end-use sector globally.
- Industrial Segment: High growth potential.
Lubricant Pail Product Landscape
The lubricant pail market offers a diverse range of products, including plastic pails (HDPE, PP), metal pails, and composite pails. Innovations focus on improved barrier properties to prevent lubricant leakage and degradation, enhanced stackability for efficient logistics, and lightweighting for reduced transportation costs. Unique selling propositions include customizable designs, tamper-evident closures, and integrated dispensing systems. Technological advancements are driving the adoption of lighter, more durable, and recyclable materials.
Key Drivers, Barriers & Challenges in Lubricant Pail
Key Drivers:
- Increasing lubricant consumption across various sectors.
- Growing demand for convenient and efficient packaging solutions.
- Technological advancements in pail design and manufacturing.
Key Challenges & Restraints:
- Fluctuations in raw material prices (e.g., resin costs).
- Stringent environmental regulations concerning recyclability and material safety.
- Intense competition among manufacturers. This leads to a xx% price pressure in the market.
Emerging Opportunities in Lubricant Pail
- Growing demand for sustainable and eco-friendly packaging solutions (bio-based plastics, recycled content).
- Expanding adoption of smart packaging technologies (e.g., RFID tagging for traceability).
- Untapped market potential in emerging economies with rising lubricant consumption.
Growth Accelerators in the Lubricant Pail Industry
Technological breakthroughs in material science, particularly in the development of lightweight and high-barrier materials, are expected to drive long-term growth. Strategic partnerships between pail manufacturers and lubricant producers are fostering innovation and improving supply chain efficiency. Expansion into emerging markets, especially in Asia-Pacific, presents significant growth opportunities.
Key Players Shaping the Lubricant Pail Market
- EP Container
- Greif
- Jokey Plastics
- House of Cans
- Syn-Tech
- PlasticTecnic
- Feldman Industries
- Air Sea Containers
- 3W Plastics
- AK Plastomet
- Martin Lubricants
- Japan Pail Corporation
Notable Milestones in Lubricant Pail Sector
- 2020, Q4: Greif announced a new sustainable pail line using recycled content.
- 2022, Q2: Jokey Plastics launched a new lightweight pail design, reducing material usage by xx%.
- 2023, Q1: EP Container acquired a smaller pail manufacturer, expanding its market share.
In-Depth Lubricant Pail Market Outlook
The lubricant pail market is poised for continued growth, driven by robust demand from various end-use sectors and ongoing technological advancements. Strategic investments in sustainable packaging solutions and expansion into emerging markets will be crucial for success. Companies with innovative product offerings, strong supply chain management, and a focus on environmental sustainability are expected to gain a competitive advantage. The market is expected to reach xx million units by 2033, presenting significant opportunities for growth and investment.
Lubricant Pail Segmentation
-
1. Application
- 1.1. Lubricant
- 1.2. Industrial Chemicals
- 1.3. Paints
- 1.4. Other
-
2. Types
- 2.1. Metal
- 2.2. Plastic
Lubricant Pail Segmentation By Geography
-
1. North America
- 1.1. United States
- 1.2. Canada
- 1.3. Mexico
-
2. South America
- 2.1. Brazil
- 2.2. Argentina
- 2.3. Rest of South America
-
3. Europe
- 3.1. United Kingdom
- 3.2. Germany
- 3.3. France
- 3.4. Italy
- 3.5. Spain
- 3.6. Russia
- 3.7. Benelux
- 3.8. Nordics
- 3.9. Rest of Europe
-
4. Middle East & Africa
- 4.1. Turkey
- 4.2. Israel
- 4.3. GCC
- 4.4. North Africa
- 4.5. South Africa
- 4.6. Rest of Middle East & Africa
-
5. Asia Pacific
- 5.1. China
- 5.2. India
- 5.3. Japan
- 5.4. South Korea
- 5.5. ASEAN
- 5.6. Oceania
- 5.7. Rest of Asia Pacific
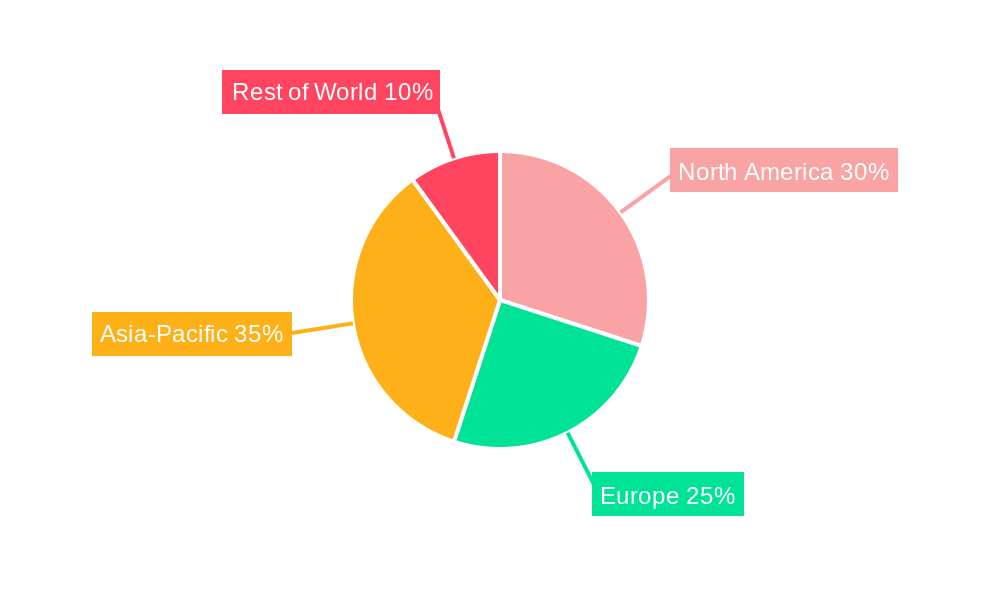
Lubricant Pail Regional Market Share
Geographic Coverage of Lubricant Pail
Lubricant Pail REPORT HIGHLIGHTS
| Aspects | Details |
|---|---|
| Study Period | 2020-2034 |
| Base Year | 2025 |
| Estimated Year | 2026 |
| Forecast Period | 2026-2034 |
| Historical Period | 2020-2025 |
| Growth Rate | CAGR of 4.7% from 2020-2034 |
| Segmentation |
|
Table of Contents
- 1. Introduction
- 1.1. Research Scope
- 1.2. Market Segmentation
- 1.3. Research Objective
- 1.4. Definitions and Assumptions
- 2. Executive Summary
- 2.1. Market Snapshot
- 3. Market Dynamics
- 3.1. Market Drivers
- 3.2. Market Restrains
- 3.3. Market Trends
- 3.4. Market Opportunities
- 4. Market Factor Analysis
- 4.1. Porters Five Forces
- 4.1.1. Bargaining Power of Suppliers
- 4.1.2. Bargaining Power of Buyers
- 4.1.3. Threat of New Entrants
- 4.1.4. Threat of Substitutes
- 4.1.5. Competitive Rivalry
- 4.2. PESTEL analysis
- 4.3. BCG Analysis
- 4.3.1. Stars (High Growth, High Market Share)
- 4.3.2. Cash Cows (Low Growth, High Market Share)
- 4.3.3. Question Mark (High Growth, Low Market Share)
- 4.3.4. Dogs (Low Growth, Low Market Share)
- 4.4. Ansoff Matrix Analysis
- 4.5. Supply Chain Analysis
- 4.6. Regulatory Landscape
- 4.7. Current Market Potential and Opportunity Assessment (TAM–SAM–SOM Framework)
- 4.8. NRP Analyst Note
- 4.1. Porters Five Forces
- 5. Market Analysis, Insights and Forecast 2021-2033
- 5.1. Market Analysis, Insights and Forecast - by Application
- 5.1.1. Lubricant
- 5.1.2. Industrial Chemicals
- 5.1.3. Paints
- 5.1.4. Other
- 5.2. Market Analysis, Insights and Forecast - by Types
- 5.2.1. Metal
- 5.2.2. Plastic
- 5.3. Market Analysis, Insights and Forecast - by Region
- 5.3.1. North America
- 5.3.2. South America
- 5.3.3. Europe
- 5.3.4. Middle East & Africa
- 5.3.5. Asia Pacific
- 5.1. Market Analysis, Insights and Forecast - by Application
- 6. Global Lubricant Pail Analysis, Insights and Forecast, 2021-2033
- 6.1. Market Analysis, Insights and Forecast - by Application
- 6.1.1. Lubricant
- 6.1.2. Industrial Chemicals
- 6.1.3. Paints
- 6.1.4. Other
- 6.2. Market Analysis, Insights and Forecast - by Types
- 6.2.1. Metal
- 6.2.2. Plastic
- 6.1. Market Analysis, Insights and Forecast - by Application
- 7. North America Lubricant Pail Analysis, Insights and Forecast, 2020-2032
- 7.1. Market Analysis, Insights and Forecast - by Application
- 7.1.1. Lubricant
- 7.1.2. Industrial Chemicals
- 7.1.3. Paints
- 7.1.4. Other
- 7.2. Market Analysis, Insights and Forecast - by Types
- 7.2.1. Metal
- 7.2.2. Plastic
- 7.1. Market Analysis, Insights and Forecast - by Application
- 8. South America Lubricant Pail Analysis, Insights and Forecast, 2020-2032
- 8.1. Market Analysis, Insights and Forecast - by Application
- 8.1.1. Lubricant
- 8.1.2. Industrial Chemicals
- 8.1.3. Paints
- 8.1.4. Other
- 8.2. Market Analysis, Insights and Forecast - by Types
- 8.2.1. Metal
- 8.2.2. Plastic
- 8.1. Market Analysis, Insights and Forecast - by Application
- 9. Europe Lubricant Pail Analysis, Insights and Forecast, 2020-2032
- 9.1. Market Analysis, Insights and Forecast - by Application
- 9.1.1. Lubricant
- 9.1.2. Industrial Chemicals
- 9.1.3. Paints
- 9.1.4. Other
- 9.2. Market Analysis, Insights and Forecast - by Types
- 9.2.1. Metal
- 9.2.2. Plastic
- 9.1. Market Analysis, Insights and Forecast - by Application
- 10. Middle East & Africa Lubricant Pail Analysis, Insights and Forecast, 2020-2032
- 10.1. Market Analysis, Insights and Forecast - by Application
- 10.1.1. Lubricant
- 10.1.2. Industrial Chemicals
- 10.1.3. Paints
- 10.1.4. Other
- 10.2. Market Analysis, Insights and Forecast - by Types
- 10.2.1. Metal
- 10.2.2. Plastic
- 10.1. Market Analysis, Insights and Forecast - by Application
- 11. Asia Pacific Lubricant Pail Analysis, Insights and Forecast, 2020-2032
- 11.1. Market Analysis, Insights and Forecast - by Application
- 11.1.1. Lubricant
- 11.1.2. Industrial Chemicals
- 11.1.3. Paints
- 11.1.4. Other
- 11.2. Market Analysis, Insights and Forecast - by Types
- 11.2.1. Metal
- 11.2.2. Plastic
- 11.1. Market Analysis, Insights and Forecast - by Application
- 12. Competitive Analysis
- 12.1. Company Profiles
- 12.1.1 EP Container
- 12.1.1.1. Company Overview
- 12.1.1.2. Products
- 12.1.1.3. Company Financials
- 12.1.1.4. SWOT Analysis
- 12.1.2 Greif
- 12.1.2.1. Company Overview
- 12.1.2.2. Products
- 12.1.2.3. Company Financials
- 12.1.2.4. SWOT Analysis
- 12.1.3 Jokey Plastics
- 12.1.3.1. Company Overview
- 12.1.3.2. Products
- 12.1.3.3. Company Financials
- 12.1.3.4. SWOT Analysis
- 12.1.4 House of Cans
- 12.1.4.1. Company Overview
- 12.1.4.2. Products
- 12.1.4.3. Company Financials
- 12.1.4.4. SWOT Analysis
- 12.1.5 Syn-Tech
- 12.1.5.1. Company Overview
- 12.1.5.2. Products
- 12.1.5.3. Company Financials
- 12.1.5.4. SWOT Analysis
- 12.1.6 PlasticTecnic
- 12.1.6.1. Company Overview
- 12.1.6.2. Products
- 12.1.6.3. Company Financials
- 12.1.6.4. SWOT Analysis
- 12.1.7 Feldman Industries
- 12.1.7.1. Company Overview
- 12.1.7.2. Products
- 12.1.7.3. Company Financials
- 12.1.7.4. SWOT Analysis
- 12.1.8 Air Sea Containers
- 12.1.8.1. Company Overview
- 12.1.8.2. Products
- 12.1.8.3. Company Financials
- 12.1.8.4. SWOT Analysis
- 12.1.9 3W Plastics
- 12.1.9.1. Company Overview
- 12.1.9.2. Products
- 12.1.9.3. Company Financials
- 12.1.9.4. SWOT Analysis
- 12.1.10 AK Plastomet
- 12.1.10.1. Company Overview
- 12.1.10.2. Products
- 12.1.10.3. Company Financials
- 12.1.10.4. SWOT Analysis
- 12.1.11 Martin Lubricants
- 12.1.11.1. Company Overview
- 12.1.11.2. Products
- 12.1.11.3. Company Financials
- 12.1.11.4. SWOT Analysis
- 12.1.12 Japan Pail Corporation
- 12.1.12.1. Company Overview
- 12.1.12.2. Products
- 12.1.12.3. Company Financials
- 12.1.12.4. SWOT Analysis
- 12.1.1 EP Container
- 12.2. Market Entropy
- 12.2.1 Company's Key Areas Served
- 12.2.2 Recent Developments
- 12.3. Company Market Share Analysis 2025
- 12.3.1 Top 5 Companies Market Share Analysis
- 12.3.2 Top 3 Companies Market Share Analysis
- 12.4. List of Potential Customers
- 13. Research Methodology
List of Figures
- Figure 1: Global Lubricant Pail Revenue Breakdown (billion, %) by Region 2025 & 2033
- Figure 2: Global Lubricant Pail Volume Breakdown (K, %) by Region 2025 & 2033
- Figure 3: North America Lubricant Pail Revenue (billion), by Application 2025 & 2033
- Figure 4: North America Lubricant Pail Volume (K), by Application 2025 & 2033
- Figure 5: North America Lubricant Pail Revenue Share (%), by Application 2025 & 2033
- Figure 6: North America Lubricant Pail Volume Share (%), by Application 2025 & 2033
- Figure 7: North America Lubricant Pail Revenue (billion), by Types 2025 & 2033
- Figure 8: North America Lubricant Pail Volume (K), by Types 2025 & 2033
- Figure 9: North America Lubricant Pail Revenue Share (%), by Types 2025 & 2033
- Figure 10: North America Lubricant Pail Volume Share (%), by Types 2025 & 2033
- Figure 11: North America Lubricant Pail Revenue (billion), by Country 2025 & 2033
- Figure 12: North America Lubricant Pail Volume (K), by Country 2025 & 2033
- Figure 13: North America Lubricant Pail Revenue Share (%), by Country 2025 & 2033
- Figure 14: North America Lubricant Pail Volume Share (%), by Country 2025 & 2033
- Figure 15: South America Lubricant Pail Revenue (billion), by Application 2025 & 2033
- Figure 16: South America Lubricant Pail Volume (K), by Application 2025 & 2033
- Figure 17: South America Lubricant Pail Revenue Share (%), by Application 2025 & 2033
- Figure 18: South America Lubricant Pail Volume Share (%), by Application 2025 & 2033
- Figure 19: South America Lubricant Pail Revenue (billion), by Types 2025 & 2033
- Figure 20: South America Lubricant Pail Volume (K), by Types 2025 & 2033
- Figure 21: South America Lubricant Pail Revenue Share (%), by Types 2025 & 2033
- Figure 22: South America Lubricant Pail Volume Share (%), by Types 2025 & 2033
- Figure 23: South America Lubricant Pail Revenue (billion), by Country 2025 & 2033
- Figure 24: South America Lubricant Pail Volume (K), by Country 2025 & 2033
- Figure 25: South America Lubricant Pail Revenue Share (%), by Country 2025 & 2033
- Figure 26: South America Lubricant Pail Volume Share (%), by Country 2025 & 2033
- Figure 27: Europe Lubricant Pail Revenue (billion), by Application 2025 & 2033
- Figure 28: Europe Lubricant Pail Volume (K), by Application 2025 & 2033
- Figure 29: Europe Lubricant Pail Revenue Share (%), by Application 2025 & 2033
- Figure 30: Europe Lubricant Pail Volume Share (%), by Application 2025 & 2033
- Figure 31: Europe Lubricant Pail Revenue (billion), by Types 2025 & 2033
- Figure 32: Europe Lubricant Pail Volume (K), by Types 2025 & 2033
- Figure 33: Europe Lubricant Pail Revenue Share (%), by Types 2025 & 2033
- Figure 34: Europe Lubricant Pail Volume Share (%), by Types 2025 & 2033
- Figure 35: Europe Lubricant Pail Revenue (billion), by Country 2025 & 2033
- Figure 36: Europe Lubricant Pail Volume (K), by Country 2025 & 2033
- Figure 37: Europe Lubricant Pail Revenue Share (%), by Country 2025 & 2033
- Figure 38: Europe Lubricant Pail Volume Share (%), by Country 2025 & 2033
- Figure 39: Middle East & Africa Lubricant Pail Revenue (billion), by Application 2025 & 2033
- Figure 40: Middle East & Africa Lubricant Pail Volume (K), by Application 2025 & 2033
- Figure 41: Middle East & Africa Lubricant Pail Revenue Share (%), by Application 2025 & 2033
- Figure 42: Middle East & Africa Lubricant Pail Volume Share (%), by Application 2025 & 2033
- Figure 43: Middle East & Africa Lubricant Pail Revenue (billion), by Types 2025 & 2033
- Figure 44: Middle East & Africa Lubricant Pail Volume (K), by Types 2025 & 2033
- Figure 45: Middle East & Africa Lubricant Pail Revenue Share (%), by Types 2025 & 2033
- Figure 46: Middle East & Africa Lubricant Pail Volume Share (%), by Types 2025 & 2033
- Figure 47: Middle East & Africa Lubricant Pail Revenue (billion), by Country 2025 & 2033
- Figure 48: Middle East & Africa Lubricant Pail Volume (K), by Country 2025 & 2033
- Figure 49: Middle East & Africa Lubricant Pail Revenue Share (%), by Country 2025 & 2033
- Figure 50: Middle East & Africa Lubricant Pail Volume Share (%), by Country 2025 & 2033
- Figure 51: Asia Pacific Lubricant Pail Revenue (billion), by Application 2025 & 2033
- Figure 52: Asia Pacific Lubricant Pail Volume (K), by Application 2025 & 2033
- Figure 53: Asia Pacific Lubricant Pail Revenue Share (%), by Application 2025 & 2033
- Figure 54: Asia Pacific Lubricant Pail Volume Share (%), by Application 2025 & 2033
- Figure 55: Asia Pacific Lubricant Pail Revenue (billion), by Types 2025 & 2033
- Figure 56: Asia Pacific Lubricant Pail Volume (K), by Types 2025 & 2033
- Figure 57: Asia Pacific Lubricant Pail Revenue Share (%), by Types 2025 & 2033
- Figure 58: Asia Pacific Lubricant Pail Volume Share (%), by Types 2025 & 2033
- Figure 59: Asia Pacific Lubricant Pail Revenue (billion), by Country 2025 & 2033
- Figure 60: Asia Pacific Lubricant Pail Volume (K), by Country 2025 & 2033
- Figure 61: Asia Pacific Lubricant Pail Revenue Share (%), by Country 2025 & 2033
- Figure 62: Asia Pacific Lubricant Pail Volume Share (%), by Country 2025 & 2033
List of Tables
- Table 1: Global Lubricant Pail Revenue billion Forecast, by Application 2020 & 2033
- Table 2: Global Lubricant Pail Volume K Forecast, by Application 2020 & 2033
- Table 3: Global Lubricant Pail Revenue billion Forecast, by Types 2020 & 2033
- Table 4: Global Lubricant Pail Volume K Forecast, by Types 2020 & 2033
- Table 5: Global Lubricant Pail Revenue billion Forecast, by Region 2020 & 2033
- Table 6: Global Lubricant Pail Volume K Forecast, by Region 2020 & 2033
- Table 7: Global Lubricant Pail Revenue billion Forecast, by Application 2020 & 2033
- Table 8: Global Lubricant Pail Volume K Forecast, by Application 2020 & 2033
- Table 9: Global Lubricant Pail Revenue billion Forecast, by Types 2020 & 2033
- Table 10: Global Lubricant Pail Volume K Forecast, by Types 2020 & 2033
- Table 11: Global Lubricant Pail Revenue billion Forecast, by Country 2020 & 2033
- Table 12: Global Lubricant Pail Volume K Forecast, by Country 2020 & 2033
- Table 13: United States Lubricant Pail Revenue (billion) Forecast, by Application 2020 & 2033
- Table 14: United States Lubricant Pail Volume (K) Forecast, by Application 2020 & 2033
- Table 15: Canada Lubricant Pail Revenue (billion) Forecast, by Application 2020 & 2033
- Table 16: Canada Lubricant Pail Volume (K) Forecast, by Application 2020 & 2033
- Table 17: Mexico Lubricant Pail Revenue (billion) Forecast, by Application 2020 & 2033
- Table 18: Mexico Lubricant Pail Volume (K) Forecast, by Application 2020 & 2033
- Table 19: Global Lubricant Pail Revenue billion Forecast, by Application 2020 & 2033
- Table 20: Global Lubricant Pail Volume K Forecast, by Application 2020 & 2033
- Table 21: Global Lubricant Pail Revenue billion Forecast, by Types 2020 & 2033
- Table 22: Global Lubricant Pail Volume K Forecast, by Types 2020 & 2033
- Table 23: Global Lubricant Pail Revenue billion Forecast, by Country 2020 & 2033
- Table 24: Global Lubricant Pail Volume K Forecast, by Country 2020 & 2033
- Table 25: Brazil Lubricant Pail Revenue (billion) Forecast, by Application 2020 & 2033
- Table 26: Brazil Lubricant Pail Volume (K) Forecast, by Application 2020 & 2033
- Table 27: Argentina Lubricant Pail Revenue (billion) Forecast, by Application 2020 & 2033
- Table 28: Argentina Lubricant Pail Volume (K) Forecast, by Application 2020 & 2033
- Table 29: Rest of South America Lubricant Pail Revenue (billion) Forecast, by Application 2020 & 2033
- Table 30: Rest of South America Lubricant Pail Volume (K) Forecast, by Application 2020 & 2033
- Table 31: Global Lubricant Pail Revenue billion Forecast, by Application 2020 & 2033
- Table 32: Global Lubricant Pail Volume K Forecast, by Application 2020 & 2033
- Table 33: Global Lubricant Pail Revenue billion Forecast, by Types 2020 & 2033
- Table 34: Global Lubricant Pail Volume K Forecast, by Types 2020 & 2033
- Table 35: Global Lubricant Pail Revenue billion Forecast, by Country 2020 & 2033
- Table 36: Global Lubricant Pail Volume K Forecast, by Country 2020 & 2033
- Table 37: United Kingdom Lubricant Pail Revenue (billion) Forecast, by Application 2020 & 2033
- Table 38: United Kingdom Lubricant Pail Volume (K) Forecast, by Application 2020 & 2033
- Table 39: Germany Lubricant Pail Revenue (billion) Forecast, by Application 2020 & 2033
- Table 40: Germany Lubricant Pail Volume (K) Forecast, by Application 2020 & 2033
- Table 41: France Lubricant Pail Revenue (billion) Forecast, by Application 2020 & 2033
- Table 42: France Lubricant Pail Volume (K) Forecast, by Application 2020 & 2033
- Table 43: Italy Lubricant Pail Revenue (billion) Forecast, by Application 2020 & 2033
- Table 44: Italy Lubricant Pail Volume (K) Forecast, by Application 2020 & 2033
- Table 45: Spain Lubricant Pail Revenue (billion) Forecast, by Application 2020 & 2033
- Table 46: Spain Lubricant Pail Volume (K) Forecast, by Application 2020 & 2033
- Table 47: Russia Lubricant Pail Revenue (billion) Forecast, by Application 2020 & 2033
- Table 48: Russia Lubricant Pail Volume (K) Forecast, by Application 2020 & 2033
- Table 49: Benelux Lubricant Pail Revenue (billion) Forecast, by Application 2020 & 2033
- Table 50: Benelux Lubricant Pail Volume (K) Forecast, by Application 2020 & 2033
- Table 51: Nordics Lubricant Pail Revenue (billion) Forecast, by Application 2020 & 2033
- Table 52: Nordics Lubricant Pail Volume (K) Forecast, by Application 2020 & 2033
- Table 53: Rest of Europe Lubricant Pail Revenue (billion) Forecast, by Application 2020 & 2033
- Table 54: Rest of Europe Lubricant Pail Volume (K) Forecast, by Application 2020 & 2033
- Table 55: Global Lubricant Pail Revenue billion Forecast, by Application 2020 & 2033
- Table 56: Global Lubricant Pail Volume K Forecast, by Application 2020 & 2033
- Table 57: Global Lubricant Pail Revenue billion Forecast, by Types 2020 & 2033
- Table 58: Global Lubricant Pail Volume K Forecast, by Types 2020 & 2033
- Table 59: Global Lubricant Pail Revenue billion Forecast, by Country 2020 & 2033
- Table 60: Global Lubricant Pail Volume K Forecast, by Country 2020 & 2033
- Table 61: Turkey Lubricant Pail Revenue (billion) Forecast, by Application 2020 & 2033
- Table 62: Turkey Lubricant Pail Volume (K) Forecast, by Application 2020 & 2033
- Table 63: Israel Lubricant Pail Revenue (billion) Forecast, by Application 2020 & 2033
- Table 64: Israel Lubricant Pail Volume (K) Forecast, by Application 2020 & 2033
- Table 65: GCC Lubricant Pail Revenue (billion) Forecast, by Application 2020 & 2033
- Table 66: GCC Lubricant Pail Volume (K) Forecast, by Application 2020 & 2033
- Table 67: North Africa Lubricant Pail Revenue (billion) Forecast, by Application 2020 & 2033
- Table 68: North Africa Lubricant Pail Volume (K) Forecast, by Application 2020 & 2033
- Table 69: South Africa Lubricant Pail Revenue (billion) Forecast, by Application 2020 & 2033
- Table 70: South Africa Lubricant Pail Volume (K) Forecast, by Application 2020 & 2033
- Table 71: Rest of Middle East & Africa Lubricant Pail Revenue (billion) Forecast, by Application 2020 & 2033
- Table 72: Rest of Middle East & Africa Lubricant Pail Volume (K) Forecast, by Application 2020 & 2033
- Table 73: Global Lubricant Pail Revenue billion Forecast, by Application 2020 & 2033
- Table 74: Global Lubricant Pail Volume K Forecast, by Application 2020 & 2033
- Table 75: Global Lubricant Pail Revenue billion Forecast, by Types 2020 & 2033
- Table 76: Global Lubricant Pail Volume K Forecast, by Types 2020 & 2033
- Table 77: Global Lubricant Pail Revenue billion Forecast, by Country 2020 & 2033
- Table 78: Global Lubricant Pail Volume K Forecast, by Country 2020 & 2033
- Table 79: China Lubricant Pail Revenue (billion) Forecast, by Application 2020 & 2033
- Table 80: China Lubricant Pail Volume (K) Forecast, by Application 2020 & 2033
- Table 81: India Lubricant Pail Revenue (billion) Forecast, by Application 2020 & 2033
- Table 82: India Lubricant Pail Volume (K) Forecast, by Application 2020 & 2033
- Table 83: Japan Lubricant Pail Revenue (billion) Forecast, by Application 2020 & 2033
- Table 84: Japan Lubricant Pail Volume (K) Forecast, by Application 2020 & 2033
- Table 85: South Korea Lubricant Pail Revenue (billion) Forecast, by Application 2020 & 2033
- Table 86: South Korea Lubricant Pail Volume (K) Forecast, by Application 2020 & 2033
- Table 87: ASEAN Lubricant Pail Revenue (billion) Forecast, by Application 2020 & 2033
- Table 88: ASEAN Lubricant Pail Volume (K) Forecast, by Application 2020 & 2033
- Table 89: Oceania Lubricant Pail Revenue (billion) Forecast, by Application 2020 & 2033
- Table 90: Oceania Lubricant Pail Volume (K) Forecast, by Application 2020 & 2033
- Table 91: Rest of Asia Pacific Lubricant Pail Revenue (billion) Forecast, by Application 2020 & 2033
- Table 92: Rest of Asia Pacific Lubricant Pail Volume (K) Forecast, by Application 2020 & 2033
Frequently Asked Questions
1. What is the projected Compound Annual Growth Rate (CAGR) of the Lubricant Pail?
The projected CAGR is approximately 4.7%.
2. Which companies are prominent players in the Lubricant Pail?
Key companies in the market include EP Container, Greif, Jokey Plastics, House of Cans, Syn-Tech, PlasticTecnic, Feldman Industries, Air Sea Containers, 3W Plastics, AK Plastomet, Martin Lubricants, Japan Pail Corporation.
3. What are the main segments of the Lubricant Pail?
The market segments include Application, Types.
4. Can you provide details about the market size?
The market size is estimated to be USD 2.28 billion as of 2022.
5. What are some drivers contributing to market growth?
N/A
6. What are the notable trends driving market growth?
N/A
7. Are there any restraints impacting market growth?
N/A
8. Can you provide examples of recent developments in the market?
N/A
9. What pricing options are available for accessing the report?
Pricing options include single-user, multi-user, and enterprise licenses priced at USD 3950.00, USD 5925.00, and USD 7900.00 respectively.
10. Is the market size provided in terms of value or volume?
The market size is provided in terms of value, measured in billion and volume, measured in K.
11. Are there any specific market keywords associated with the report?
Yes, the market keyword associated with the report is "Lubricant Pail," which aids in identifying and referencing the specific market segment covered.
12. How do I determine which pricing option suits my needs best?
The pricing options vary based on user requirements and access needs. Individual users may opt for single-user licenses, while businesses requiring broader access may choose multi-user or enterprise licenses for cost-effective access to the report.
13. Are there any additional resources or data provided in the Lubricant Pail report?
While the report offers comprehensive insights, it's advisable to review the specific contents or supplementary materials provided to ascertain if additional resources or data are available.
14. How can I stay updated on further developments or reports in the Lubricant Pail?
To stay informed about further developments, trends, and reports in the Lubricant Pail, consider subscribing to industry newsletters, following relevant companies and organizations, or regularly checking reputable industry news sources and publications.
Methodology
Step 1 - Identification of Relevant Samples Size from Population Database


Step 2 - Approaches for Defining Global Market Size (Value, Volume* & Price*)

Note*: In applicable scenarios
Step 3 - Data Sources
Primary Research
- Web Analytics
- Survey Reports
- Research Institute
- Latest Research Reports
- Opinion Leaders
Secondary Research
- Annual Reports
- White Paper
- Latest Press Release
- Industry Association
- Paid Database
- Investor Presentations

Step 4 - Data Triangulation
Involves using different sources of information in order to increase the validity of a study
These sources are likely to be stakeholders in a program - participants, other researchers, program staff, other community members, and so on.
Then we put all data in single framework & apply various statistical tools to find out the dynamic on the market.
During the analysis stage, feedback from the stakeholder groups would be compared to determine areas of agreement as well as areas of divergence