

Key Insights
The Modified Atmosphere Packaging (MAP) industry is experiencing robust growth, driven by increasing consumer demand for extended shelf life and improved food quality. A CAGR of 5.30% from 2019-2033 indicates a significant market expansion. The European market, encompassing key regions like the United Kingdom, Germany, France, and Italy, currently holds a substantial share, fueled by advanced packaging technologies and stringent food safety regulations. Growth is propelled by the rising popularity of ready-to-eat meals and convenience foods, particularly within the poultry, seafood, meat, fruits, and vegetables sectors. Nitrogen, as a packaging gas, dominates due to its inert properties, preserving product freshness. Polypropylene (PP) and other materials are widely used in packaging due to their barrier properties and cost-effectiveness. However, market restraints include the relatively high initial investment costs associated with MAP technology and fluctuating raw material prices. Furthermore, the increasing adoption of sustainable packaging solutions, like biodegradable materials, presents both a challenge and an opportunity for industry players. Future growth will be significantly influenced by the adoption of innovative packaging designs and the exploration of new gas blends to enhance product preservation and extend shelf life.
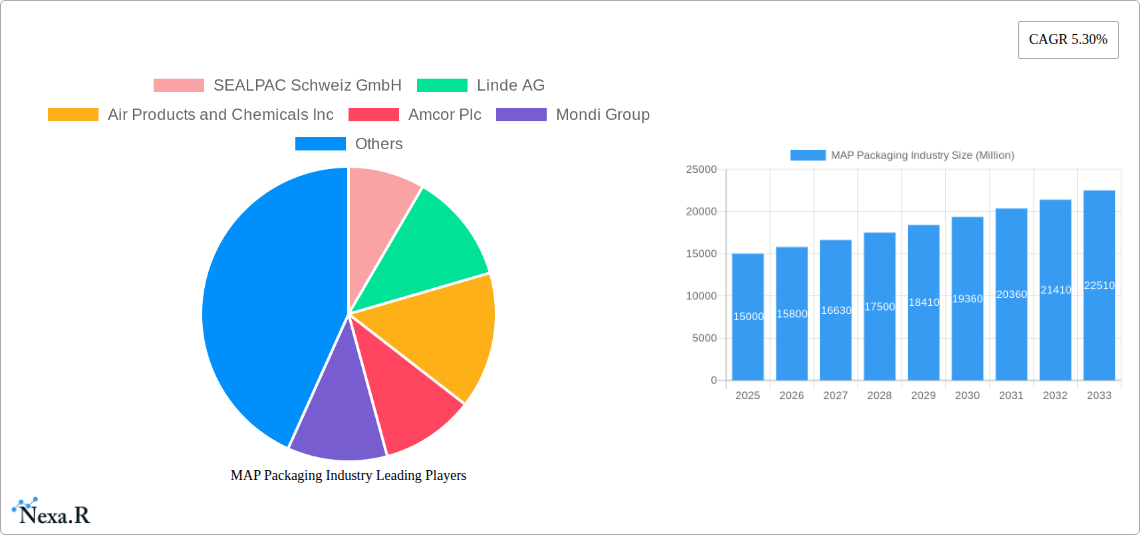
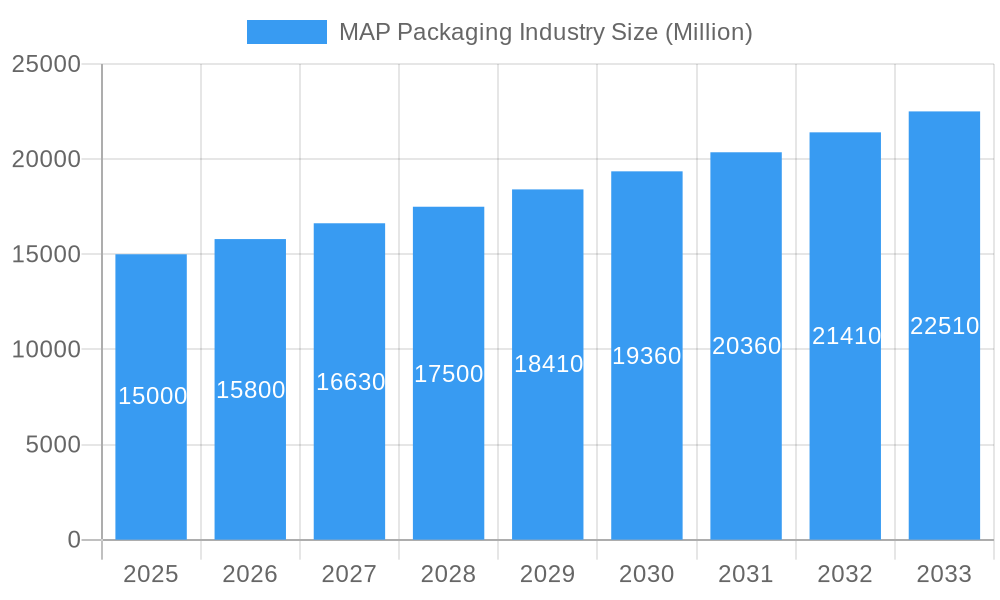
MAP Packaging Industry Market Size (In Billion)
The competitive landscape is relatively concentrated, with major players like SEALPAC Schweiz GmbH, Linde AG, Air Products and Chemicals Inc., and Amcor Plc driving innovation and market penetration. These companies are actively investing in research and development to improve packaging materials, gas mixtures, and automation technologies. The Asia-Pacific region is anticipated to exhibit substantial growth potential in the coming years, driven by rising disposable incomes and changing consumer preferences. The ongoing trend towards e-commerce and online grocery deliveries further supports the demand for extended shelf-life packaging solutions like MAP. Companies are also focusing on creating environmentally friendly and sustainable solutions to meet the growing consumer demand for eco-conscious packaging alternatives. Successful navigation of these market dynamics hinges on the ability of industry players to balance cost-effectiveness, sustainability, and technological advancements.
MAP Packaging Industry Company Market Share
The Comprehensive MAP Packaging Industry Report: 2019-2033
This in-depth report provides a comprehensive analysis of the Modified Atmosphere Packaging (MAP) industry, offering invaluable insights for industry professionals, investors, and strategic decision-makers. The report covers the period 2019-2033, with a focus on the forecast period 2025-2033 and a base year of 2025. It delves into market dynamics, growth trends, regional performance, key players, and future opportunities within this dynamic sector. The market is segmented by country (United Kingdom, Germany, France, Italy, Rest of Europe), packaging gas type (Oxygen, Nitrogen, Carbon Dioxide, Other Gases), type of packaging material (Polypropylene (PP), Polyvinylchloride (PVC), Low-Density Polyethylene (LDPE), Other Materials), and application (Poultry, Seafood, & Meat Products, Fruits & Vegetables, Bakery & Confectionery, Other Applications). The report projects a total market size of xx Million units by 2033.
MAP Packaging Industry Market Dynamics & Structure
This section analyzes the competitive landscape of the MAP packaging market, examining market concentration, technological advancements, regulatory influences, and the impact of mergers and acquisitions (M&A). The report quantifies market share amongst key players and assesses the influence of substitute products.
- Market Concentration: The market is moderately concentrated, with a few large players holding significant shares. The top 5 players account for approximately xx% of the market share in 2025. Further details on market share distribution among these players and small businesses are presented in the detailed report.
- Technological Innovation: Continuous innovation in packaging materials, gas mixtures, and packaging machinery drives market growth. Key innovations include improved barrier films, active and intelligent packaging solutions, and automated packaging lines.
- Regulatory Framework: Government regulations regarding food safety and environmental sustainability significantly influence the adoption of MAP packaging technologies. Compliance costs and potential regulations on single-use plastics are key factors affecting market dynamics.
- Competitive Product Substitutes: Traditional packaging methods, such as vacuum packaging and freezing, pose competition, while emerging technologies like edible films offer alternative solutions. The report analyzes the market share of each packaging type compared to MAP packaging.
- End-User Demographics: Growing consumer demand for extended shelf-life products and fresh food drives the growth of MAP packaging, particularly in developed economies with high disposable incomes.
- M&A Trends: The MAP packaging market has witnessed several strategic mergers and acquisitions in recent years, primarily aimed at expanding product portfolios, geographical reach, and technological capabilities. xx M&A deals were recorded between 2019 and 2024.
MAP Packaging Industry Growth Trends & Insights
This section provides a detailed analysis of the market's growth trajectory, examining factors such as market size evolution, adoption rates, technological disruptions, and shifting consumer behavior. The analysis leverages extensive market data to provide quantitative insights including CAGR and market penetration. The detailed report will provide a year-by-year breakdown of market size from 2019 to 2033. It identifies that the market is driven by factors such as increasing consumer demand for extended shelf life products, the growing food and beverage industry, as well as the increasing adoption of MAP technology in various applications such as processed foods, fruits, and vegetables. Furthermore, the development of sustainable and eco-friendly packaging materials has positively impacted the growth. The projected CAGR for the period 2025-2033 is expected to be xx%.
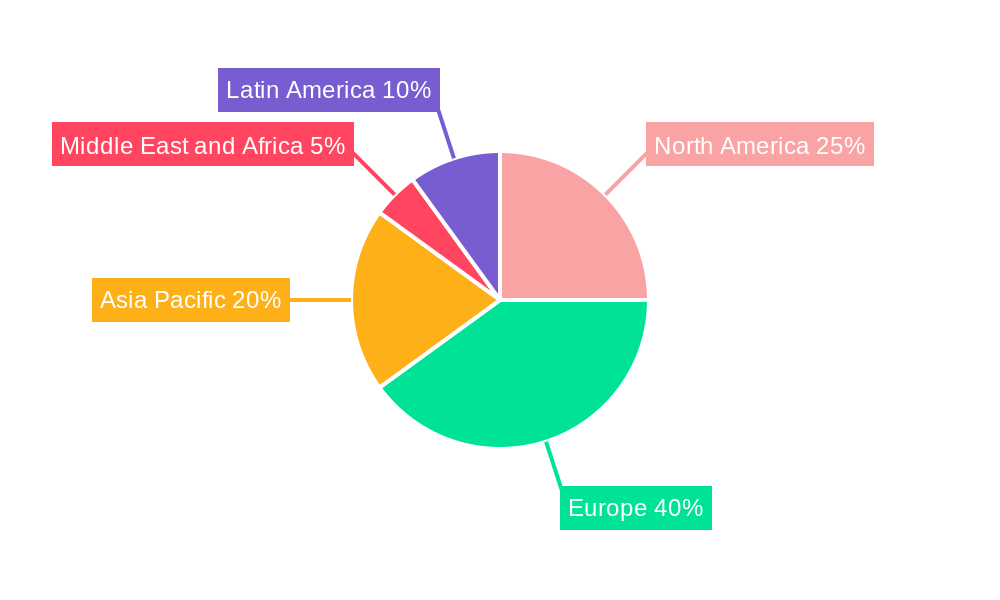
Dominant Regions, Countries, or Segments in MAP Packaging Industry
This section identifies the leading regions, countries, and segments driving market growth, analyzing their respective market shares and growth potential.
- Leading Region: Western Europe is the dominant region in the MAP packaging market.
- Leading Countries: Germany, followed by the United Kingdom and France, are the leading countries, accounting for xx% of the total market share in 2025. The high adoption rate in these nations can be attributed to factors such as advanced technological infrastructure, and strong food processing industry.
- Leading Segments: Nitrogen is the most prevalent gas type used in MAP packaging, due to its inert nature, holding approximately xx% market share. Polypropylene (PP) is the leading packaging material in 2025 with a market share of xx% due to its low cost, flexibility, and good barrier properties. The Poultry, Seafood, & Meat Products segment exhibits the highest demand, driven by stringent requirements for food safety and freshness.
Key Drivers: The growth in each region and segment is influenced by various economic policies and infrastructural developments specific to that region. Detailed analysis is included in the report.
MAP Packaging Industry Product Landscape
The MAP packaging market features diverse product offerings, including various packaging materials, gas blends, and packaging machinery. Recent innovations focus on improving barrier properties, extending shelf life, and enhancing the overall consumer experience. These innovations include sustainable packaging materials, active packaging that extends shelf-life, and intelligent packaging that provides information on product freshness and storage conditions.
Key Drivers, Barriers & Challenges in MAP Packaging Industry
Key Drivers:
- Increased demand for fresh and convenient food products.
- Growing food processing and retail sectors.
- Advancements in packaging materials and technologies.
- Stringent food safety regulations.
Key Challenges and Restraints:
- High initial investment costs for MAP packaging systems.
- Potential challenges in maintaining proper gas mixtures.
- Concerns regarding the environmental impact of packaging materials.
- Competition from alternative packaging technologies.
Emerging Opportunities in MAP Packaging Industry
Emerging opportunities lie in the development of sustainable and biodegradable MAP packaging materials, expanding into new applications such as ready-to-eat meals and pharmaceuticals, and leveraging digital technologies for improved supply chain management and consumer engagement.
Growth Accelerators in the MAP Packaging Industry
Technological advancements, strategic partnerships between packaging material suppliers, and the expansion into new and emerging markets are key growth accelerators for the MAP packaging industry. This includes the development of active and intelligent packaging systems, providing real-time product information and enhanced shelf-life management.
Key Players Shaping the MAP Packaging Industry Market
- SEALPAC Schweiz GmbH
- Linde AG
- Air Products and Chemicals Inc
- Amcor Plc
- Mondi Group
- Syntegon Technology GmbH
- Barry-Wehmiller Companies
- ULMA Packaging
- CV-Tek
- Sealed Air Corporation
Notable Milestones in MAP Packaging Industry Sector
- 2020: Sealed Air Corporation launched a new range of sustainable MAP packaging films.
- 2021: Amcor Plc acquired a smaller packaging company specializing in biodegradable films.
- 2022: Linde AG invested in new technology to improve gas purity for MAP packaging. (Further milestones will be detailed in the full report)
In-Depth MAP Packaging Industry Market Outlook
The MAP packaging market is poised for robust growth over the next decade, driven by the increasing demand for fresh, convenient food products, advancements in sustainable and eco-friendly packaging solutions, and expansion into new applications across diverse industries. Strategic partnerships and technological innovations will further propel market expansion. The report concludes with a comprehensive outlook detailing strategic opportunities and potential future market scenarios.
MAP Packaging Industry Segmentation
-
1. Packaging Gas Type
- 1.1. Oxygen
- 1.2. Nitrogen
- 1.3. Carbon Dioxide
- 1.4. Other Gases
-
2. Type of Packaging Material
- 2.1. Polypropylene (PP)
- 2.2. Polyvinylchloride (PVC)
- 2.3. Low-Density Polyethylene (LDPE)
- 2.4. Other Materials
-
3. Application
- 3.1. Poultry, Seafood, & Meat Products
- 3.2. Fruits & Vegetables
- 3.3. Bakery & Confectionery
- 3.4. Other Applications
MAP Packaging Industry Segmentation By Geography
-
1. North America
- 1.1. United States
- 1.2. Canada
- 1.3. Mexico
-
2. South America
- 2.1. Brazil
- 2.2. Argentina
- 2.3. Rest of South America
-
3. Europe
- 3.1. United Kingdom
- 3.2. Germany
- 3.3. France
- 3.4. Italy
- 3.5. Spain
- 3.6. Russia
- 3.7. Benelux
- 3.8. Nordics
- 3.9. Rest of Europe
-
4. Middle East & Africa
- 4.1. Turkey
- 4.2. Israel
- 4.3. GCC
- 4.4. North Africa
- 4.5. South Africa
- 4.6. Rest of Middle East & Africa
-
5. Asia Pacific
- 5.1. China
- 5.2. India
- 5.3. Japan
- 5.4. South Korea
- 5.5. ASEAN
- 5.6. Oceania
- 5.7. Rest of Asia Pacific
MAP Packaging Industry Regional Market Share
Geographic Coverage of MAP Packaging Industry
MAP Packaging Industry REPORT HIGHLIGHTS
| Aspects | Details |
|---|---|
| Study Period | 2020-2034 |
| Base Year | 2025 |
| Estimated Year | 2026 |
| Forecast Period | 2026-2034 |
| Historical Period | 2020-2025 |
| Growth Rate | CAGR of 5.30% from 2020-2034 |
| Segmentation |
|
Table of Contents
- 1. Introduction
- 1.1. Research Scope
- 1.2. Market Segmentation
- 1.3. Research Objective
- 1.4. Definitions and Assumptions
- 2. Executive Summary
- 2.1. Market Snapshot
- 3. Market Dynamics
- 3.1. Market Drivers
- 3.2. Market Restrains
- 3.3. Market Trends
- 3.4. Market Opportunities
- 4. Market Factor Analysis
- 4.1. Porters Five Forces
- 4.1.1. Bargaining Power of Suppliers
- 4.1.2. Bargaining Power of Buyers
- 4.1.3. Threat of New Entrants
- 4.1.4. Threat of Substitutes
- 4.1.5. Competitive Rivalry
- 4.2. PESTEL analysis
- 4.3. BCG Analysis
- 4.3.1. Stars (High Growth, High Market Share)
- 4.3.2. Cash Cows (Low Growth, High Market Share)
- 4.3.3. Question Mark (High Growth, Low Market Share)
- 4.3.4. Dogs (Low Growth, Low Market Share)
- 4.4. Ansoff Matrix Analysis
- 4.5. Supply Chain Analysis
- 4.6. Regulatory Landscape
- 4.7. Current Market Potential and Opportunity Assessment (TAM–SAM–SOM Framework)
- 4.8. NRP Analyst Note
- 4.1. Porters Five Forces
- 5. Market Analysis, Insights and Forecast 2021-2033
- 5.1. Market Analysis, Insights and Forecast - by Packaging Gas Type
- 5.1.1. Oxygen
- 5.1.2. Nitrogen
- 5.1.3. Carbon Dioxide
- 5.1.4. Other Gases
- 5.2. Market Analysis, Insights and Forecast - by Type of Packaging Material
- 5.2.1. Polypropylene (PP)
- 5.2.2. Polyvinylchloride (PVC)
- 5.2.3. Low-Density Polyethylene (LDPE)
- 5.2.4. Other Materials
- 5.3. Market Analysis, Insights and Forecast - by Application
- 5.3.1. Poultry, Seafood, & Meat Products
- 5.3.2. Fruits & Vegetables
- 5.3.3. Bakery & Confectionery
- 5.3.4. Other Applications
- 5.4. Market Analysis, Insights and Forecast - by Region
- 5.4.1. North America
- 5.4.2. South America
- 5.4.3. Europe
- 5.4.4. Middle East & Africa
- 5.4.5. Asia Pacific
- 5.1. Market Analysis, Insights and Forecast - by Packaging Gas Type
- 6. Global MAP Packaging Industry Analysis, Insights and Forecast, 2021-2033
- 6.1. Market Analysis, Insights and Forecast - by Packaging Gas Type
- 6.1.1. Oxygen
- 6.1.2. Nitrogen
- 6.1.3. Carbon Dioxide
- 6.1.4. Other Gases
- 6.2. Market Analysis, Insights and Forecast - by Type of Packaging Material
- 6.2.1. Polypropylene (PP)
- 6.2.2. Polyvinylchloride (PVC)
- 6.2.3. Low-Density Polyethylene (LDPE)
- 6.2.4. Other Materials
- 6.3. Market Analysis, Insights and Forecast - by Application
- 6.3.1. Poultry, Seafood, & Meat Products
- 6.3.2. Fruits & Vegetables
- 6.3.3. Bakery & Confectionery
- 6.3.4. Other Applications
- 6.1. Market Analysis, Insights and Forecast - by Packaging Gas Type
- 7. North America MAP Packaging Industry Analysis, Insights and Forecast, 2020-2032
- 7.1. Market Analysis, Insights and Forecast - by Packaging Gas Type
- 7.1.1. Oxygen
- 7.1.2. Nitrogen
- 7.1.3. Carbon Dioxide
- 7.1.4. Other Gases
- 7.2. Market Analysis, Insights and Forecast - by Type of Packaging Material
- 7.2.1. Polypropylene (PP)
- 7.2.2. Polyvinylchloride (PVC)
- 7.2.3. Low-Density Polyethylene (LDPE)
- 7.2.4. Other Materials
- 7.3. Market Analysis, Insights and Forecast - by Application
- 7.3.1. Poultry, Seafood, & Meat Products
- 7.3.2. Fruits & Vegetables
- 7.3.3. Bakery & Confectionery
- 7.3.4. Other Applications
- 7.1. Market Analysis, Insights and Forecast - by Packaging Gas Type
- 8. South America MAP Packaging Industry Analysis, Insights and Forecast, 2020-2032
- 8.1. Market Analysis, Insights and Forecast - by Packaging Gas Type
- 8.1.1. Oxygen
- 8.1.2. Nitrogen
- 8.1.3. Carbon Dioxide
- 8.1.4. Other Gases
- 8.2. Market Analysis, Insights and Forecast - by Type of Packaging Material
- 8.2.1. Polypropylene (PP)
- 8.2.2. Polyvinylchloride (PVC)
- 8.2.3. Low-Density Polyethylene (LDPE)
- 8.2.4. Other Materials
- 8.3. Market Analysis, Insights and Forecast - by Application
- 8.3.1. Poultry, Seafood, & Meat Products
- 8.3.2. Fruits & Vegetables
- 8.3.3. Bakery & Confectionery
- 8.3.4. Other Applications
- 8.1. Market Analysis, Insights and Forecast - by Packaging Gas Type
- 9. Europe MAP Packaging Industry Analysis, Insights and Forecast, 2020-2032
- 9.1. Market Analysis, Insights and Forecast - by Packaging Gas Type
- 9.1.1. Oxygen
- 9.1.2. Nitrogen
- 9.1.3. Carbon Dioxide
- 9.1.4. Other Gases
- 9.2. Market Analysis, Insights and Forecast - by Type of Packaging Material
- 9.2.1. Polypropylene (PP)
- 9.2.2. Polyvinylchloride (PVC)
- 9.2.3. Low-Density Polyethylene (LDPE)
- 9.2.4. Other Materials
- 9.3. Market Analysis, Insights and Forecast - by Application
- 9.3.1. Poultry, Seafood, & Meat Products
- 9.3.2. Fruits & Vegetables
- 9.3.3. Bakery & Confectionery
- 9.3.4. Other Applications
- 9.1. Market Analysis, Insights and Forecast - by Packaging Gas Type
- 10. Middle East & Africa MAP Packaging Industry Analysis, Insights and Forecast, 2020-2032
- 10.1. Market Analysis, Insights and Forecast - by Packaging Gas Type
- 10.1.1. Oxygen
- 10.1.2. Nitrogen
- 10.1.3. Carbon Dioxide
- 10.1.4. Other Gases
- 10.2. Market Analysis, Insights and Forecast - by Type of Packaging Material
- 10.2.1. Polypropylene (PP)
- 10.2.2. Polyvinylchloride (PVC)
- 10.2.3. Low-Density Polyethylene (LDPE)
- 10.2.4. Other Materials
- 10.3. Market Analysis, Insights and Forecast - by Application
- 10.3.1. Poultry, Seafood, & Meat Products
- 10.3.2. Fruits & Vegetables
- 10.3.3. Bakery & Confectionery
- 10.3.4. Other Applications
- 10.1. Market Analysis, Insights and Forecast - by Packaging Gas Type
- 11. Asia Pacific MAP Packaging Industry Analysis, Insights and Forecast, 2020-2032
- 11.1. Market Analysis, Insights and Forecast - by Packaging Gas Type
- 11.1.1. Oxygen
- 11.1.2. Nitrogen
- 11.1.3. Carbon Dioxide
- 11.1.4. Other Gases
- 11.2. Market Analysis, Insights and Forecast - by Type of Packaging Material
- 11.2.1. Polypropylene (PP)
- 11.2.2. Polyvinylchloride (PVC)
- 11.2.3. Low-Density Polyethylene (LDPE)
- 11.2.4. Other Materials
- 11.3. Market Analysis, Insights and Forecast - by Application
- 11.3.1. Poultry, Seafood, & Meat Products
- 11.3.2. Fruits & Vegetables
- 11.3.3. Bakery & Confectionery
- 11.3.4. Other Applications
- 11.1. Market Analysis, Insights and Forecast - by Packaging Gas Type
- 12. Competitive Analysis
- 12.1. Company Profiles
- 12.1.1 SEALPAC Schweiz GmbH
- 12.1.1.1. Company Overview
- 12.1.1.2. Products
- 12.1.1.3. Company Financials
- 12.1.1.4. SWOT Analysis
- 12.1.2 Linde AG
- 12.1.2.1. Company Overview
- 12.1.2.2. Products
- 12.1.2.3. Company Financials
- 12.1.2.4. SWOT Analysis
- 12.1.3 Air Products and Chemicals Inc
- 12.1.3.1. Company Overview
- 12.1.3.2. Products
- 12.1.3.3. Company Financials
- 12.1.3.4. SWOT Analysis
- 12.1.4 Amcor Plc
- 12.1.4.1. Company Overview
- 12.1.4.2. Products
- 12.1.4.3. Company Financials
- 12.1.4.4. SWOT Analysis
- 12.1.5 Mondi Group
- 12.1.5.1. Company Overview
- 12.1.5.2. Products
- 12.1.5.3. Company Financials
- 12.1.5.4. SWOT Analysis
- 12.1.6 Syntegon Technology GmbH*List Not Exhaustive
- 12.1.6.1. Company Overview
- 12.1.6.2. Products
- 12.1.6.3. Company Financials
- 12.1.6.4. SWOT Analysis
- 12.1.7 Barry-Wehmiller Companies
- 12.1.7.1. Company Overview
- 12.1.7.2. Products
- 12.1.7.3. Company Financials
- 12.1.7.4. SWOT Analysis
- 12.1.8 ULMA Packaging
- 12.1.8.1. Company Overview
- 12.1.8.2. Products
- 12.1.8.3. Company Financials
- 12.1.8.4. SWOT Analysis
- 12.1.9 CV-Tek
- 12.1.9.1. Company Overview
- 12.1.9.2. Products
- 12.1.9.3. Company Financials
- 12.1.9.4. SWOT Analysis
- 12.1.10 Sealed Air Corporation
- 12.1.10.1. Company Overview
- 12.1.10.2. Products
- 12.1.10.3. Company Financials
- 12.1.10.4. SWOT Analysis
- 12.1.1 SEALPAC Schweiz GmbH
- 12.2. Market Entropy
- 12.2.1 Company's Key Areas Served
- 12.2.2 Recent Developments
- 12.3. Company Market Share Analysis 2025
- 12.3.1 Top 5 Companies Market Share Analysis
- 12.3.2 Top 3 Companies Market Share Analysis
- 12.4. List of Potential Customers
- 13. Research Methodology
List of Figures
- Figure 1: Global MAP Packaging Industry Revenue Breakdown (Million, %) by Region 2025 & 2033
- Figure 2: North America MAP Packaging Industry Revenue (Million), by Packaging Gas Type 2025 & 2033
- Figure 3: North America MAP Packaging Industry Revenue Share (%), by Packaging Gas Type 2025 & 2033
- Figure 4: North America MAP Packaging Industry Revenue (Million), by Type of Packaging Material 2025 & 2033
- Figure 5: North America MAP Packaging Industry Revenue Share (%), by Type of Packaging Material 2025 & 2033
- Figure 6: North America MAP Packaging Industry Revenue (Million), by Application 2025 & 2033
- Figure 7: North America MAP Packaging Industry Revenue Share (%), by Application 2025 & 2033
- Figure 8: North America MAP Packaging Industry Revenue (Million), by Country 2025 & 2033
- Figure 9: North America MAP Packaging Industry Revenue Share (%), by Country 2025 & 2033
- Figure 10: South America MAP Packaging Industry Revenue (Million), by Packaging Gas Type 2025 & 2033
- Figure 11: South America MAP Packaging Industry Revenue Share (%), by Packaging Gas Type 2025 & 2033
- Figure 12: South America MAP Packaging Industry Revenue (Million), by Type of Packaging Material 2025 & 2033
- Figure 13: South America MAP Packaging Industry Revenue Share (%), by Type of Packaging Material 2025 & 2033
- Figure 14: South America MAP Packaging Industry Revenue (Million), by Application 2025 & 2033
- Figure 15: South America MAP Packaging Industry Revenue Share (%), by Application 2025 & 2033
- Figure 16: South America MAP Packaging Industry Revenue (Million), by Country 2025 & 2033
- Figure 17: South America MAP Packaging Industry Revenue Share (%), by Country 2025 & 2033
- Figure 18: Europe MAP Packaging Industry Revenue (Million), by Packaging Gas Type 2025 & 2033
- Figure 19: Europe MAP Packaging Industry Revenue Share (%), by Packaging Gas Type 2025 & 2033
- Figure 20: Europe MAP Packaging Industry Revenue (Million), by Type of Packaging Material 2025 & 2033
- Figure 21: Europe MAP Packaging Industry Revenue Share (%), by Type of Packaging Material 2025 & 2033
- Figure 22: Europe MAP Packaging Industry Revenue (Million), by Application 2025 & 2033
- Figure 23: Europe MAP Packaging Industry Revenue Share (%), by Application 2025 & 2033
- Figure 24: Europe MAP Packaging Industry Revenue (Million), by Country 2025 & 2033
- Figure 25: Europe MAP Packaging Industry Revenue Share (%), by Country 2025 & 2033
- Figure 26: Middle East & Africa MAP Packaging Industry Revenue (Million), by Packaging Gas Type 2025 & 2033
- Figure 27: Middle East & Africa MAP Packaging Industry Revenue Share (%), by Packaging Gas Type 2025 & 2033
- Figure 28: Middle East & Africa MAP Packaging Industry Revenue (Million), by Type of Packaging Material 2025 & 2033
- Figure 29: Middle East & Africa MAP Packaging Industry Revenue Share (%), by Type of Packaging Material 2025 & 2033
- Figure 30: Middle East & Africa MAP Packaging Industry Revenue (Million), by Application 2025 & 2033
- Figure 31: Middle East & Africa MAP Packaging Industry Revenue Share (%), by Application 2025 & 2033
- Figure 32: Middle East & Africa MAP Packaging Industry Revenue (Million), by Country 2025 & 2033
- Figure 33: Middle East & Africa MAP Packaging Industry Revenue Share (%), by Country 2025 & 2033
- Figure 34: Asia Pacific MAP Packaging Industry Revenue (Million), by Packaging Gas Type 2025 & 2033
- Figure 35: Asia Pacific MAP Packaging Industry Revenue Share (%), by Packaging Gas Type 2025 & 2033
- Figure 36: Asia Pacific MAP Packaging Industry Revenue (Million), by Type of Packaging Material 2025 & 2033
- Figure 37: Asia Pacific MAP Packaging Industry Revenue Share (%), by Type of Packaging Material 2025 & 2033
- Figure 38: Asia Pacific MAP Packaging Industry Revenue (Million), by Application 2025 & 2033
- Figure 39: Asia Pacific MAP Packaging Industry Revenue Share (%), by Application 2025 & 2033
- Figure 40: Asia Pacific MAP Packaging Industry Revenue (Million), by Country 2025 & 2033
- Figure 41: Asia Pacific MAP Packaging Industry Revenue Share (%), by Country 2025 & 2033
List of Tables
- Table 1: Global MAP Packaging Industry Revenue Million Forecast, by Packaging Gas Type 2020 & 2033
- Table 2: Global MAP Packaging Industry Revenue Million Forecast, by Type of Packaging Material 2020 & 2033
- Table 3: Global MAP Packaging Industry Revenue Million Forecast, by Application 2020 & 2033
- Table 4: Global MAP Packaging Industry Revenue Million Forecast, by Region 2020 & 2033
- Table 5: Global MAP Packaging Industry Revenue Million Forecast, by Packaging Gas Type 2020 & 2033
- Table 6: Global MAP Packaging Industry Revenue Million Forecast, by Type of Packaging Material 2020 & 2033
- Table 7: Global MAP Packaging Industry Revenue Million Forecast, by Application 2020 & 2033
- Table 8: Global MAP Packaging Industry Revenue Million Forecast, by Country 2020 & 2033
- Table 9: United States MAP Packaging Industry Revenue (Million) Forecast, by Application 2020 & 2033
- Table 10: Canada MAP Packaging Industry Revenue (Million) Forecast, by Application 2020 & 2033
- Table 11: Mexico MAP Packaging Industry Revenue (Million) Forecast, by Application 2020 & 2033
- Table 12: Global MAP Packaging Industry Revenue Million Forecast, by Packaging Gas Type 2020 & 2033
- Table 13: Global MAP Packaging Industry Revenue Million Forecast, by Type of Packaging Material 2020 & 2033
- Table 14: Global MAP Packaging Industry Revenue Million Forecast, by Application 2020 & 2033
- Table 15: Global MAP Packaging Industry Revenue Million Forecast, by Country 2020 & 2033
- Table 16: Brazil MAP Packaging Industry Revenue (Million) Forecast, by Application 2020 & 2033
- Table 17: Argentina MAP Packaging Industry Revenue (Million) Forecast, by Application 2020 & 2033
- Table 18: Rest of South America MAP Packaging Industry Revenue (Million) Forecast, by Application 2020 & 2033
- Table 19: Global MAP Packaging Industry Revenue Million Forecast, by Packaging Gas Type 2020 & 2033
- Table 20: Global MAP Packaging Industry Revenue Million Forecast, by Type of Packaging Material 2020 & 2033
- Table 21: Global MAP Packaging Industry Revenue Million Forecast, by Application 2020 & 2033
- Table 22: Global MAP Packaging Industry Revenue Million Forecast, by Country 2020 & 2033
- Table 23: United Kingdom MAP Packaging Industry Revenue (Million) Forecast, by Application 2020 & 2033
- Table 24: Germany MAP Packaging Industry Revenue (Million) Forecast, by Application 2020 & 2033
- Table 25: France MAP Packaging Industry Revenue (Million) Forecast, by Application 2020 & 2033
- Table 26: Italy MAP Packaging Industry Revenue (Million) Forecast, by Application 2020 & 2033
- Table 27: Spain MAP Packaging Industry Revenue (Million) Forecast, by Application 2020 & 2033
- Table 28: Russia MAP Packaging Industry Revenue (Million) Forecast, by Application 2020 & 2033
- Table 29: Benelux MAP Packaging Industry Revenue (Million) Forecast, by Application 2020 & 2033
- Table 30: Nordics MAP Packaging Industry Revenue (Million) Forecast, by Application 2020 & 2033
- Table 31: Rest of Europe MAP Packaging Industry Revenue (Million) Forecast, by Application 2020 & 2033
- Table 32: Global MAP Packaging Industry Revenue Million Forecast, by Packaging Gas Type 2020 & 2033
- Table 33: Global MAP Packaging Industry Revenue Million Forecast, by Type of Packaging Material 2020 & 2033
- Table 34: Global MAP Packaging Industry Revenue Million Forecast, by Application 2020 & 2033
- Table 35: Global MAP Packaging Industry Revenue Million Forecast, by Country 2020 & 2033
- Table 36: Turkey MAP Packaging Industry Revenue (Million) Forecast, by Application 2020 & 2033
- Table 37: Israel MAP Packaging Industry Revenue (Million) Forecast, by Application 2020 & 2033
- Table 38: GCC MAP Packaging Industry Revenue (Million) Forecast, by Application 2020 & 2033
- Table 39: North Africa MAP Packaging Industry Revenue (Million) Forecast, by Application 2020 & 2033
- Table 40: South Africa MAP Packaging Industry Revenue (Million) Forecast, by Application 2020 & 2033
- Table 41: Rest of Middle East & Africa MAP Packaging Industry Revenue (Million) Forecast, by Application 2020 & 2033
- Table 42: Global MAP Packaging Industry Revenue Million Forecast, by Packaging Gas Type 2020 & 2033
- Table 43: Global MAP Packaging Industry Revenue Million Forecast, by Type of Packaging Material 2020 & 2033
- Table 44: Global MAP Packaging Industry Revenue Million Forecast, by Application 2020 & 2033
- Table 45: Global MAP Packaging Industry Revenue Million Forecast, by Country 2020 & 2033
- Table 46: China MAP Packaging Industry Revenue (Million) Forecast, by Application 2020 & 2033
- Table 47: India MAP Packaging Industry Revenue (Million) Forecast, by Application 2020 & 2033
- Table 48: Japan MAP Packaging Industry Revenue (Million) Forecast, by Application 2020 & 2033
- Table 49: South Korea MAP Packaging Industry Revenue (Million) Forecast, by Application 2020 & 2033
- Table 50: ASEAN MAP Packaging Industry Revenue (Million) Forecast, by Application 2020 & 2033
- Table 51: Oceania MAP Packaging Industry Revenue (Million) Forecast, by Application 2020 & 2033
- Table 52: Rest of Asia Pacific MAP Packaging Industry Revenue (Million) Forecast, by Application 2020 & 2033
Frequently Asked Questions
1. What is the projected Compound Annual Growth Rate (CAGR) of the MAP Packaging Industry?
The projected CAGR is approximately 5.30%.
2. Which companies are prominent players in the MAP Packaging Industry?
Key companies in the market include SEALPAC Schweiz GmbH, Linde AG, Air Products and Chemicals Inc, Amcor Plc, Mondi Group, Syntegon Technology GmbH*List Not Exhaustive, Barry-Wehmiller Companies, ULMA Packaging, CV-Tek, Sealed Air Corporation.
3. What are the main segments of the MAP Packaging Industry?
The market segments include Packaging Gas Type, Type of Packaging Material, Application.
4. Can you provide details about the market size?
The market size is estimated to be USD XX Million as of 2022.
5. What are some drivers contributing to market growth?
; Increasing demand for longer shelf life; Rising demand for ready to eat food products in European countries.
6. What are the notable trends driving market growth?
Poultry. Seafood & Meat Products are Expected to Hold a Significant Share in the European Market.
7. Are there any restraints impacting market growth?
; Significantly higher cost of MAP related equipments.
8. Can you provide examples of recent developments in the market?
N/A
9. What pricing options are available for accessing the report?
Pricing options include single-user, multi-user, and enterprise licenses priced at USD 4750, USD 4950, and USD 6800 respectively.
10. Is the market size provided in terms of value or volume?
The market size is provided in terms of value, measured in Million.
11. Are there any specific market keywords associated with the report?
Yes, the market keyword associated with the report is "MAP Packaging Industry," which aids in identifying and referencing the specific market segment covered.
12. How do I determine which pricing option suits my needs best?
The pricing options vary based on user requirements and access needs. Individual users may opt for single-user licenses, while businesses requiring broader access may choose multi-user or enterprise licenses for cost-effective access to the report.
13. Are there any additional resources or data provided in the MAP Packaging Industry report?
While the report offers comprehensive insights, it's advisable to review the specific contents or supplementary materials provided to ascertain if additional resources or data are available.
14. How can I stay updated on further developments or reports in the MAP Packaging Industry?
To stay informed about further developments, trends, and reports in the MAP Packaging Industry, consider subscribing to industry newsletters, following relevant companies and organizations, or regularly checking reputable industry news sources and publications.
Methodology
Step 1 - Identification of Relevant Samples Size from Population Database


Step 2 - Approaches for Defining Global Market Size (Value, Volume* & Price*)

Note*: In applicable scenarios
Step 3 - Data Sources
Primary Research
- Web Analytics
- Survey Reports
- Research Institute
- Latest Research Reports
- Opinion Leaders
Secondary Research
- Annual Reports
- White Paper
- Latest Press Release
- Industry Association
- Paid Database
- Investor Presentations

Step 4 - Data Triangulation
Involves using different sources of information in order to increase the validity of a study
These sources are likely to be stakeholders in a program - participants, other researchers, program staff, other community members, and so on.
Then we put all data in single framework & apply various statistical tools to find out the dynamic on the market.
During the analysis stage, feedback from the stakeholder groups would be compared to determine areas of agreement as well as areas of divergence