

Key Insights
The global microbial alternative protein market is experiencing significant expansion, driven by heightened consumer preference for sustainable and ethical food options. Key growth catalysts include a burgeoning global population and growing awareness of traditional animal agriculture's environmental footprint. The market is projected to reach $1.33 billion by 2025, with an estimated Compound Annual Growth Rate (CAGR) of 14.19%. Advancements in fermentation technology are enhancing production efficiency and cost-effectiveness, further fueling this growth. Supportive government policies and investments in sustainable food solutions also contribute to the sector's positive outlook. Consumer acceptance is steadily increasing as awareness of the health and environmental advantages of microbial proteins rises.
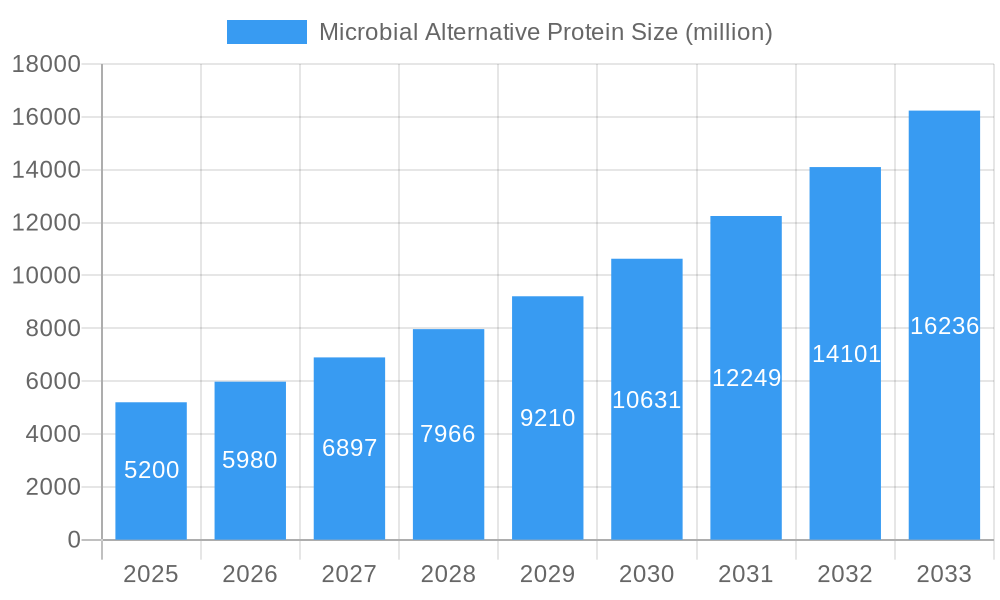
Microbial Alternative Protein Market Size (In Billion)
Prominent market segments include single-cell proteins (SCP) derived from fungi, bacteria, and algae, each offering distinct nutritional profiles and production methodologies. Applications span meat and dairy alternatives, as well as diverse food ingredients. Key challenges to widespread adoption include achieving cost competitiveness with conventional protein sources, necessitating ongoing innovation. Regulatory frameworks and consumer perception require strategic attention. Leading companies are actively investing in research and development to address these challenges and secure substantial market share in this dynamic industry.
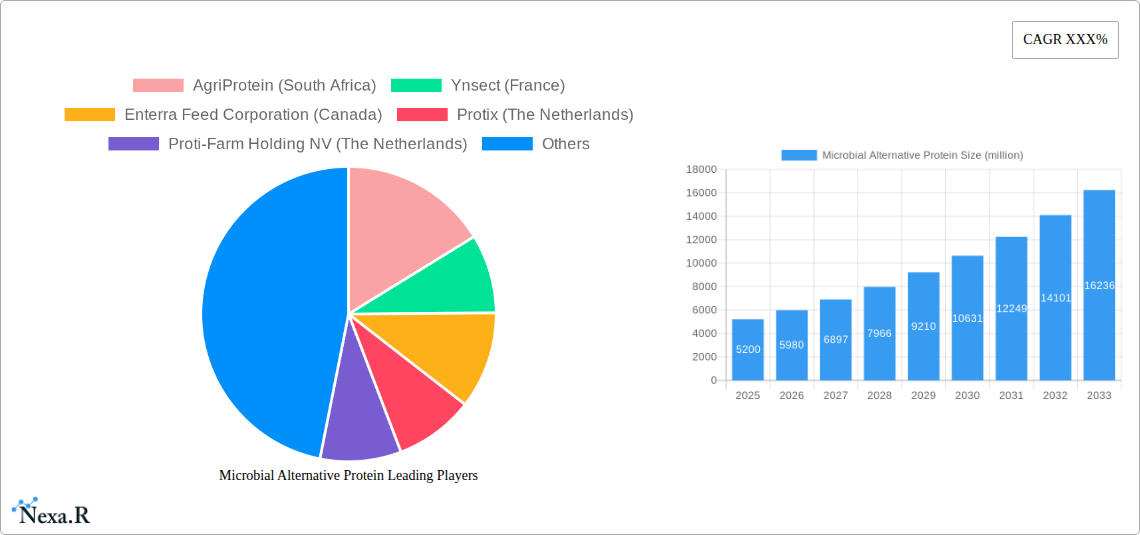
Microbial Alternative Protein Company Market Share
Microbial Alternative Protein Market Report: 2019-2033
This comprehensive report provides an in-depth analysis of the Microbial Alternative Protein market, encompassing market dynamics, growth trends, regional analysis, product landscape, key players, and future outlook. The study period covers 2019-2033, with a base year of 2025 and a forecast period of 2025-2033. The report utilizes data from the historical period (2019-2024) to project future market trends. This report is invaluable for investors, industry professionals, and researchers seeking to understand and capitalize on the burgeoning opportunities within this rapidly expanding sector of the alternative protein market. The parent market is the broader alternative protein market (valued at xx million in 2025), while the child market is microbial-based alternative proteins, specifically.
Microbial Alternative Protein Market Dynamics & Structure
This section analyzes the competitive landscape, technological advancements, regulatory landscape, and market trends influencing the microbial alternative protein market. The market is currently characterized by moderate concentration, with key players actively engaged in M&A activities to expand their market share.
- Market Concentration: The market is moderately concentrated, with the top 5 players holding an estimated xx% market share in 2025.
- Technological Innovation: Significant advancements in fermentation technology and strain engineering are driving innovation, leading to cost reductions and improved product quality.
- Regulatory Framework: Regulatory approvals and guidelines vary across regions, impacting market entry and product development. Harmonization of regulations is expected to accelerate market growth.
- Competitive Substitutes: Plant-based and cell-based proteins pose competition, but microbial proteins offer unique advantages in terms of scalability, sustainability, and nutritional profile.
- End-User Demographics: Growing consumer demand for sustainable and ethical food sources, coupled with increasing awareness of environmental concerns, fuels the adoption of microbial alternative proteins.
- M&A Trends: The past five years have witnessed xx M&A deals in the microbial alternative protein sector, indicating consolidation and investment interest. Deal values are estimated to average xx million per transaction. Innovation barriers include high R&D costs and scaling up production to meet consumer demand.
Microbial Alternative Protein Growth Trends & Insights
Leveraging extensive market research and data analysis, this section details the evolution of the microbial alternative protein market. The market is experiencing robust growth, driven by technological advancements, changing consumer preferences, and increased investments.
The global microbial alternative protein market size was valued at xx million in 2025 and is projected to reach xx million by 2033, exhibiting a CAGR of xx% during the forecast period. This growth reflects increasing consumer adoption, driven by factors such as health consciousness, environmental awareness, and the desire for novel protein sources. Technological disruptions, such as improved fermentation techniques and precision fermentation, are enhancing production efficiency and lowering costs, further fueling market expansion. Market penetration is expected to increase from xx% in 2025 to xx% by 2033.
Dominant Regions, Countries, or Segments in Microbial Alternative Protein
North America and Europe currently dominate the microbial alternative protein market, driven by strong consumer demand, established regulatory frameworks, and substantial investments in research and development. However, Asia-Pacific is expected to witness significant growth in the coming years, due to rising disposable incomes and increasing awareness of the benefits of sustainable food sources.
- North America: Strong consumer demand for sustainable protein sources and a robust venture capital ecosystem.
- Europe: Well-established regulatory framework and high consumer awareness regarding environmental sustainability.
- Asia-Pacific: Rapidly expanding consumer base and significant growth potential, driven by rising disposable incomes and increasing demand for alternative protein solutions. Key drivers include supportive government policies and developing infrastructure.
Microbial Alternative Protein Product Landscape
The microbial alternative protein market offers a diverse range of products, including single-cell proteins (SCP), mycoproteins, and other microbial-derived ingredients. These products find applications in various food and beverage categories, such as meat alternatives, dairy alternatives, and protein supplements. Ongoing innovations focus on enhancing product texture, taste, and nutritional profiles to meet consumer expectations and expand market applications. Recent advancements include the use of precision fermentation for producing specific proteins with desired functional characteristics, improving the scalability and cost-effectiveness of production.
Key Drivers, Barriers & Challenges in Microbial Alternative Protein
Key Drivers:
- Growing consumer demand for sustainable and ethical food: The increasing awareness of climate change and its impact on food production is driving consumer preference towards sustainable alternatives.
- Technological advancements in fermentation and genetic engineering: Improvements in these technologies have made microbial protein production more efficient and cost-effective.
- Government support and incentives for alternative protein development: Various countries are implementing policies to support the development and adoption of alternative proteins, including microbial-based alternatives.
Challenges:
- High initial investment costs for establishing production facilities: Scaling up production of microbial protein requires significant investment, limiting entry into the market for smaller companies.
- Regulatory hurdles and varying standards across regions: The lack of harmonized regulations can hinder market growth and increase the costs associated with product development.
- Consumer perception and acceptance: Overcoming consumer skepticism and ensuring that microbial proteins are perceived as safe and appealing is crucial for market penetration.
Emerging Opportunities in Microbial Alternative Protein
Emerging opportunities include the development of novel microbial-based ingredients for use in various food and non-food applications (e.g., animal feed, cosmetics). Untapped markets in developing countries offer significant growth potential as consumer awareness of sustainable protein increases. The exploration of new microbial strains with enhanced nutritional profiles and functional properties can lead to innovative product offerings. Personalized nutrition and customized protein products tailored to specific dietary needs also present significant opportunities.
Growth Accelerators in the Microbial Alternative Protein Industry
Technological advancements continue to be a major growth driver. Strategic partnerships between research institutions, food companies, and technology providers accelerate innovation and speed up market entry. Expansion into new geographical markets, especially in Asia and Africa, is crucial for long-term growth. Government support and regulatory clarity facilitate industry development and investment.
Key Players Shaping the Microbial Alternative Protein Market
- AgriProtein (South Africa)
- Ynsect (France)
- Enterra Feed Corporation (Canada)
- Protix (The Netherlands)
- Proti-Farm Holding NV (The Netherlands)
- Entomo Farms (Canada)
- Global Bugs Asia Co.,Ltd. (Thailand)
- Aspire Food Group (U.S.)
- Tiny Farms (U.S.)
Notable Milestones in Microbial Alternative Protein Sector
- 2020: Several companies secured significant funding rounds for expansion of microbial protein production facilities.
- 2021: First commercial-scale production facility for a novel microbial protein source opened.
- 2022: Key regulatory approvals granted for several microbial-based food products in major markets.
- 2023: Several major partnerships formed between microbial protein producers and food companies for product development and distribution.
- 2024: Successful launch of several new microbial protein-based food products in major retail chains.
In-Depth Microbial Alternative Protein Market Outlook
The microbial alternative protein market is poised for substantial growth in the coming years, driven by a confluence of factors including technological advancements, increasing consumer demand for sustainable food, and supportive regulatory frameworks. Strategic opportunities exist in product diversification, geographic expansion, and the development of innovative applications across various sectors. Further investment in research and development, coupled with collaborative efforts across the industry value chain, will be essential in ensuring the sustainable growth of this rapidly evolving market.
Microbial Alternative Protein Segmentation
-
1. Application
- 1.1. Food
- 1.2. Feed
- 1.3. Others
-
2. Type
- 2.1. Yeast Protein
- 2.2. Microalgae Protein
- 2.3. Bacterial Protein
- 2.4. Other
Microbial Alternative Protein Segmentation By Geography
-
1. North America
- 1.1. United States
- 1.2. Canada
- 1.3. Mexico
-
2. South America
- 2.1. Brazil
- 2.2. Argentina
- 2.3. Rest of South America
-
3. Europe
- 3.1. United Kingdom
- 3.2. Germany
- 3.3. France
- 3.4. Italy
- 3.5. Spain
- 3.6. Russia
- 3.7. Benelux
- 3.8. Nordics
- 3.9. Rest of Europe
-
4. Middle East & Africa
- 4.1. Turkey
- 4.2. Israel
- 4.3. GCC
- 4.4. North Africa
- 4.5. South Africa
- 4.6. Rest of Middle East & Africa
-
5. Asia Pacific
- 5.1. China
- 5.2. India
- 5.3. Japan
- 5.4. South Korea
- 5.5. ASEAN
- 5.6. Oceania
- 5.7. Rest of Asia Pacific

Microbial Alternative Protein Regional Market Share
Geographic Coverage of Microbial Alternative Protein
Microbial Alternative Protein REPORT HIGHLIGHTS
| Aspects | Details |
|---|---|
| Study Period | 2020-2034 |
| Base Year | 2025 |
| Estimated Year | 2026 |
| Forecast Period | 2026-2034 |
| Historical Period | 2020-2025 |
| Growth Rate | CAGR of 14.19% from 2020-2034 |
| Segmentation |
|
Table of Contents
- 1. Introduction
- 1.1. Research Scope
- 1.2. Market Segmentation
- 1.3. Research Methodology
- 1.4. Definitions and Assumptions
- 2. Executive Summary
- 2.1. Introduction
- 3. Market Dynamics
- 3.1. Introduction
- 3.2. Market Drivers
- 3.3. Market Restrains
- 3.4. Market Trends
- 4. Market Factor Analysis
- 4.1. Porters Five Forces
- 4.2. Supply/Value Chain
- 4.3. PESTEL analysis
- 4.4. Market Entropy
- 4.5. Patent/Trademark Analysis
- 5. Global Microbial Alternative Protein Analysis, Insights and Forecast, 2020-2032
- 5.1. Market Analysis, Insights and Forecast - by Application
- 5.1.1. Food
- 5.1.2. Feed
- 5.1.3. Others
- 5.2. Market Analysis, Insights and Forecast - by Type
- 5.2.1. Yeast Protein
- 5.2.2. Microalgae Protein
- 5.2.3. Bacterial Protein
- 5.2.4. Other
- 5.3. Market Analysis, Insights and Forecast - by Region
- 5.3.1. North America
- 5.3.2. South America
- 5.3.3. Europe
- 5.3.4. Middle East & Africa
- 5.3.5. Asia Pacific
- 5.1. Market Analysis, Insights and Forecast - by Application
- 6. North America Microbial Alternative Protein Analysis, Insights and Forecast, 2020-2032
- 6.1. Market Analysis, Insights and Forecast - by Application
- 6.1.1. Food
- 6.1.2. Feed
- 6.1.3. Others
- 6.2. Market Analysis, Insights and Forecast - by Type
- 6.2.1. Yeast Protein
- 6.2.2. Microalgae Protein
- 6.2.3. Bacterial Protein
- 6.2.4. Other
- 6.1. Market Analysis, Insights and Forecast - by Application
- 7. South America Microbial Alternative Protein Analysis, Insights and Forecast, 2020-2032
- 7.1. Market Analysis, Insights and Forecast - by Application
- 7.1.1. Food
- 7.1.2. Feed
- 7.1.3. Others
- 7.2. Market Analysis, Insights and Forecast - by Type
- 7.2.1. Yeast Protein
- 7.2.2. Microalgae Protein
- 7.2.3. Bacterial Protein
- 7.2.4. Other
- 7.1. Market Analysis, Insights and Forecast - by Application
- 8. Europe Microbial Alternative Protein Analysis, Insights and Forecast, 2020-2032
- 8.1. Market Analysis, Insights and Forecast - by Application
- 8.1.1. Food
- 8.1.2. Feed
- 8.1.3. Others
- 8.2. Market Analysis, Insights and Forecast - by Type
- 8.2.1. Yeast Protein
- 8.2.2. Microalgae Protein
- 8.2.3. Bacterial Protein
- 8.2.4. Other
- 8.1. Market Analysis, Insights and Forecast - by Application
- 9. Middle East & Africa Microbial Alternative Protein Analysis, Insights and Forecast, 2020-2032
- 9.1. Market Analysis, Insights and Forecast - by Application
- 9.1.1. Food
- 9.1.2. Feed
- 9.1.3. Others
- 9.2. Market Analysis, Insights and Forecast - by Type
- 9.2.1. Yeast Protein
- 9.2.2. Microalgae Protein
- 9.2.3. Bacterial Protein
- 9.2.4. Other
- 9.1. Market Analysis, Insights and Forecast - by Application
- 10. Asia Pacific Microbial Alternative Protein Analysis, Insights and Forecast, 2020-2032
- 10.1. Market Analysis, Insights and Forecast - by Application
- 10.1.1. Food
- 10.1.2. Feed
- 10.1.3. Others
- 10.2. Market Analysis, Insights and Forecast - by Type
- 10.2.1. Yeast Protein
- 10.2.2. Microalgae Protein
- 10.2.3. Bacterial Protein
- 10.2.4. Other
- 10.1. Market Analysis, Insights and Forecast - by Application
- 11. Competitive Analysis
- 11.1. Global Market Share Analysis 2025
- 11.2. Company Profiles
- 11.2.1 AgriProtein (South Africa)
- 11.2.1.1. Overview
- 11.2.1.2. Products
- 11.2.1.3. SWOT Analysis
- 11.2.1.4. Recent Developments
- 11.2.1.5. Financials (Based on Availability)
- 11.2.2 Ynsect (France)
- 11.2.2.1. Overview
- 11.2.2.2. Products
- 11.2.2.3. SWOT Analysis
- 11.2.2.4. Recent Developments
- 11.2.2.5. Financials (Based on Availability)
- 11.2.3 Enterra Feed Corporation (Canada)
- 11.2.3.1. Overview
- 11.2.3.2. Products
- 11.2.3.3. SWOT Analysis
- 11.2.3.4. Recent Developments
- 11.2.3.5. Financials (Based on Availability)
- 11.2.4 Protix (The Netherlands)
- 11.2.4.1. Overview
- 11.2.4.2. Products
- 11.2.4.3. SWOT Analysis
- 11.2.4.4. Recent Developments
- 11.2.4.5. Financials (Based on Availability)
- 11.2.5 Proti-Farm Holding NV (The Netherlands)
- 11.2.5.1. Overview
- 11.2.5.2. Products
- 11.2.5.3. SWOT Analysis
- 11.2.5.4. Recent Developments
- 11.2.5.5. Financials (Based on Availability)
- 11.2.6 Entomo Farms (Canada)
- 11.2.6.1. Overview
- 11.2.6.2. Products
- 11.2.6.3. SWOT Analysis
- 11.2.6.4. Recent Developments
- 11.2.6.5. Financials (Based on Availability)
- 11.2.7 Global Bugs Asia Co.
- 11.2.7.1. Overview
- 11.2.7.2. Products
- 11.2.7.3. SWOT Analysis
- 11.2.7.4. Recent Developments
- 11.2.7.5. Financials (Based on Availability)
- 11.2.8 Ltd. (Thailand)
- 11.2.8.1. Overview
- 11.2.8.2. Products
- 11.2.8.3. SWOT Analysis
- 11.2.8.4. Recent Developments
- 11.2.8.5. Financials (Based on Availability)
- 11.2.9 Aspire Food Group (U.S.)
- 11.2.9.1. Overview
- 11.2.9.2. Products
- 11.2.9.3. SWOT Analysis
- 11.2.9.4. Recent Developments
- 11.2.9.5. Financials (Based on Availability)
- 11.2.10 Tiny Farms (U.S.)
- 11.2.10.1. Overview
- 11.2.10.2. Products
- 11.2.10.3. SWOT Analysis
- 11.2.10.4. Recent Developments
- 11.2.10.5. Financials (Based on Availability)
- 11.2.1 AgriProtein (South Africa)
List of Figures
- Figure 1: Global Microbial Alternative Protein Revenue Breakdown (billion, %) by Region 2025 & 2033
- Figure 2: Global Microbial Alternative Protein Volume Breakdown (K, %) by Region 2025 & 2033
- Figure 3: North America Microbial Alternative Protein Revenue (billion), by Application 2025 & 2033
- Figure 4: North America Microbial Alternative Protein Volume (K), by Application 2025 & 2033
- Figure 5: North America Microbial Alternative Protein Revenue Share (%), by Application 2025 & 2033
- Figure 6: North America Microbial Alternative Protein Volume Share (%), by Application 2025 & 2033
- Figure 7: North America Microbial Alternative Protein Revenue (billion), by Type 2025 & 2033
- Figure 8: North America Microbial Alternative Protein Volume (K), by Type 2025 & 2033
- Figure 9: North America Microbial Alternative Protein Revenue Share (%), by Type 2025 & 2033
- Figure 10: North America Microbial Alternative Protein Volume Share (%), by Type 2025 & 2033
- Figure 11: North America Microbial Alternative Protein Revenue (billion), by Country 2025 & 2033
- Figure 12: North America Microbial Alternative Protein Volume (K), by Country 2025 & 2033
- Figure 13: North America Microbial Alternative Protein Revenue Share (%), by Country 2025 & 2033
- Figure 14: North America Microbial Alternative Protein Volume Share (%), by Country 2025 & 2033
- Figure 15: South America Microbial Alternative Protein Revenue (billion), by Application 2025 & 2033
- Figure 16: South America Microbial Alternative Protein Volume (K), by Application 2025 & 2033
- Figure 17: South America Microbial Alternative Protein Revenue Share (%), by Application 2025 & 2033
- Figure 18: South America Microbial Alternative Protein Volume Share (%), by Application 2025 & 2033
- Figure 19: South America Microbial Alternative Protein Revenue (billion), by Type 2025 & 2033
- Figure 20: South America Microbial Alternative Protein Volume (K), by Type 2025 & 2033
- Figure 21: South America Microbial Alternative Protein Revenue Share (%), by Type 2025 & 2033
- Figure 22: South America Microbial Alternative Protein Volume Share (%), by Type 2025 & 2033
- Figure 23: South America Microbial Alternative Protein Revenue (billion), by Country 2025 & 2033
- Figure 24: South America Microbial Alternative Protein Volume (K), by Country 2025 & 2033
- Figure 25: South America Microbial Alternative Protein Revenue Share (%), by Country 2025 & 2033
- Figure 26: South America Microbial Alternative Protein Volume Share (%), by Country 2025 & 2033
- Figure 27: Europe Microbial Alternative Protein Revenue (billion), by Application 2025 & 2033
- Figure 28: Europe Microbial Alternative Protein Volume (K), by Application 2025 & 2033
- Figure 29: Europe Microbial Alternative Protein Revenue Share (%), by Application 2025 & 2033
- Figure 30: Europe Microbial Alternative Protein Volume Share (%), by Application 2025 & 2033
- Figure 31: Europe Microbial Alternative Protein Revenue (billion), by Type 2025 & 2033
- Figure 32: Europe Microbial Alternative Protein Volume (K), by Type 2025 & 2033
- Figure 33: Europe Microbial Alternative Protein Revenue Share (%), by Type 2025 & 2033
- Figure 34: Europe Microbial Alternative Protein Volume Share (%), by Type 2025 & 2033
- Figure 35: Europe Microbial Alternative Protein Revenue (billion), by Country 2025 & 2033
- Figure 36: Europe Microbial Alternative Protein Volume (K), by Country 2025 & 2033
- Figure 37: Europe Microbial Alternative Protein Revenue Share (%), by Country 2025 & 2033
- Figure 38: Europe Microbial Alternative Protein Volume Share (%), by Country 2025 & 2033
- Figure 39: Middle East & Africa Microbial Alternative Protein Revenue (billion), by Application 2025 & 2033
- Figure 40: Middle East & Africa Microbial Alternative Protein Volume (K), by Application 2025 & 2033
- Figure 41: Middle East & Africa Microbial Alternative Protein Revenue Share (%), by Application 2025 & 2033
- Figure 42: Middle East & Africa Microbial Alternative Protein Volume Share (%), by Application 2025 & 2033
- Figure 43: Middle East & Africa Microbial Alternative Protein Revenue (billion), by Type 2025 & 2033
- Figure 44: Middle East & Africa Microbial Alternative Protein Volume (K), by Type 2025 & 2033
- Figure 45: Middle East & Africa Microbial Alternative Protein Revenue Share (%), by Type 2025 & 2033
- Figure 46: Middle East & Africa Microbial Alternative Protein Volume Share (%), by Type 2025 & 2033
- Figure 47: Middle East & Africa Microbial Alternative Protein Revenue (billion), by Country 2025 & 2033
- Figure 48: Middle East & Africa Microbial Alternative Protein Volume (K), by Country 2025 & 2033
- Figure 49: Middle East & Africa Microbial Alternative Protein Revenue Share (%), by Country 2025 & 2033
- Figure 50: Middle East & Africa Microbial Alternative Protein Volume Share (%), by Country 2025 & 2033
- Figure 51: Asia Pacific Microbial Alternative Protein Revenue (billion), by Application 2025 & 2033
- Figure 52: Asia Pacific Microbial Alternative Protein Volume (K), by Application 2025 & 2033
- Figure 53: Asia Pacific Microbial Alternative Protein Revenue Share (%), by Application 2025 & 2033
- Figure 54: Asia Pacific Microbial Alternative Protein Volume Share (%), by Application 2025 & 2033
- Figure 55: Asia Pacific Microbial Alternative Protein Revenue (billion), by Type 2025 & 2033
- Figure 56: Asia Pacific Microbial Alternative Protein Volume (K), by Type 2025 & 2033
- Figure 57: Asia Pacific Microbial Alternative Protein Revenue Share (%), by Type 2025 & 2033
- Figure 58: Asia Pacific Microbial Alternative Protein Volume Share (%), by Type 2025 & 2033
- Figure 59: Asia Pacific Microbial Alternative Protein Revenue (billion), by Country 2025 & 2033
- Figure 60: Asia Pacific Microbial Alternative Protein Volume (K), by Country 2025 & 2033
- Figure 61: Asia Pacific Microbial Alternative Protein Revenue Share (%), by Country 2025 & 2033
- Figure 62: Asia Pacific Microbial Alternative Protein Volume Share (%), by Country 2025 & 2033
List of Tables
- Table 1: Global Microbial Alternative Protein Revenue billion Forecast, by Application 2020 & 2033
- Table 2: Global Microbial Alternative Protein Volume K Forecast, by Application 2020 & 2033
- Table 3: Global Microbial Alternative Protein Revenue billion Forecast, by Type 2020 & 2033
- Table 4: Global Microbial Alternative Protein Volume K Forecast, by Type 2020 & 2033
- Table 5: Global Microbial Alternative Protein Revenue billion Forecast, by Region 2020 & 2033
- Table 6: Global Microbial Alternative Protein Volume K Forecast, by Region 2020 & 2033
- Table 7: Global Microbial Alternative Protein Revenue billion Forecast, by Application 2020 & 2033
- Table 8: Global Microbial Alternative Protein Volume K Forecast, by Application 2020 & 2033
- Table 9: Global Microbial Alternative Protein Revenue billion Forecast, by Type 2020 & 2033
- Table 10: Global Microbial Alternative Protein Volume K Forecast, by Type 2020 & 2033
- Table 11: Global Microbial Alternative Protein Revenue billion Forecast, by Country 2020 & 2033
- Table 12: Global Microbial Alternative Protein Volume K Forecast, by Country 2020 & 2033
- Table 13: United States Microbial Alternative Protein Revenue (billion) Forecast, by Application 2020 & 2033
- Table 14: United States Microbial Alternative Protein Volume (K) Forecast, by Application 2020 & 2033
- Table 15: Canada Microbial Alternative Protein Revenue (billion) Forecast, by Application 2020 & 2033
- Table 16: Canada Microbial Alternative Protein Volume (K) Forecast, by Application 2020 & 2033
- Table 17: Mexico Microbial Alternative Protein Revenue (billion) Forecast, by Application 2020 & 2033
- Table 18: Mexico Microbial Alternative Protein Volume (K) Forecast, by Application 2020 & 2033
- Table 19: Global Microbial Alternative Protein Revenue billion Forecast, by Application 2020 & 2033
- Table 20: Global Microbial Alternative Protein Volume K Forecast, by Application 2020 & 2033
- Table 21: Global Microbial Alternative Protein Revenue billion Forecast, by Type 2020 & 2033
- Table 22: Global Microbial Alternative Protein Volume K Forecast, by Type 2020 & 2033
- Table 23: Global Microbial Alternative Protein Revenue billion Forecast, by Country 2020 & 2033
- Table 24: Global Microbial Alternative Protein Volume K Forecast, by Country 2020 & 2033
- Table 25: Brazil Microbial Alternative Protein Revenue (billion) Forecast, by Application 2020 & 2033
- Table 26: Brazil Microbial Alternative Protein Volume (K) Forecast, by Application 2020 & 2033
- Table 27: Argentina Microbial Alternative Protein Revenue (billion) Forecast, by Application 2020 & 2033
- Table 28: Argentina Microbial Alternative Protein Volume (K) Forecast, by Application 2020 & 2033
- Table 29: Rest of South America Microbial Alternative Protein Revenue (billion) Forecast, by Application 2020 & 2033
- Table 30: Rest of South America Microbial Alternative Protein Volume (K) Forecast, by Application 2020 & 2033
- Table 31: Global Microbial Alternative Protein Revenue billion Forecast, by Application 2020 & 2033
- Table 32: Global Microbial Alternative Protein Volume K Forecast, by Application 2020 & 2033
- Table 33: Global Microbial Alternative Protein Revenue billion Forecast, by Type 2020 & 2033
- Table 34: Global Microbial Alternative Protein Volume K Forecast, by Type 2020 & 2033
- Table 35: Global Microbial Alternative Protein Revenue billion Forecast, by Country 2020 & 2033
- Table 36: Global Microbial Alternative Protein Volume K Forecast, by Country 2020 & 2033
- Table 37: United Kingdom Microbial Alternative Protein Revenue (billion) Forecast, by Application 2020 & 2033
- Table 38: United Kingdom Microbial Alternative Protein Volume (K) Forecast, by Application 2020 & 2033
- Table 39: Germany Microbial Alternative Protein Revenue (billion) Forecast, by Application 2020 & 2033
- Table 40: Germany Microbial Alternative Protein Volume (K) Forecast, by Application 2020 & 2033
- Table 41: France Microbial Alternative Protein Revenue (billion) Forecast, by Application 2020 & 2033
- Table 42: France Microbial Alternative Protein Volume (K) Forecast, by Application 2020 & 2033
- Table 43: Italy Microbial Alternative Protein Revenue (billion) Forecast, by Application 2020 & 2033
- Table 44: Italy Microbial Alternative Protein Volume (K) Forecast, by Application 2020 & 2033
- Table 45: Spain Microbial Alternative Protein Revenue (billion) Forecast, by Application 2020 & 2033
- Table 46: Spain Microbial Alternative Protein Volume (K) Forecast, by Application 2020 & 2033
- Table 47: Russia Microbial Alternative Protein Revenue (billion) Forecast, by Application 2020 & 2033
- Table 48: Russia Microbial Alternative Protein Volume (K) Forecast, by Application 2020 & 2033
- Table 49: Benelux Microbial Alternative Protein Revenue (billion) Forecast, by Application 2020 & 2033
- Table 50: Benelux Microbial Alternative Protein Volume (K) Forecast, by Application 2020 & 2033
- Table 51: Nordics Microbial Alternative Protein Revenue (billion) Forecast, by Application 2020 & 2033
- Table 52: Nordics Microbial Alternative Protein Volume (K) Forecast, by Application 2020 & 2033
- Table 53: Rest of Europe Microbial Alternative Protein Revenue (billion) Forecast, by Application 2020 & 2033
- Table 54: Rest of Europe Microbial Alternative Protein Volume (K) Forecast, by Application 2020 & 2033
- Table 55: Global Microbial Alternative Protein Revenue billion Forecast, by Application 2020 & 2033
- Table 56: Global Microbial Alternative Protein Volume K Forecast, by Application 2020 & 2033
- Table 57: Global Microbial Alternative Protein Revenue billion Forecast, by Type 2020 & 2033
- Table 58: Global Microbial Alternative Protein Volume K Forecast, by Type 2020 & 2033
- Table 59: Global Microbial Alternative Protein Revenue billion Forecast, by Country 2020 & 2033
- Table 60: Global Microbial Alternative Protein Volume K Forecast, by Country 2020 & 2033
- Table 61: Turkey Microbial Alternative Protein Revenue (billion) Forecast, by Application 2020 & 2033
- Table 62: Turkey Microbial Alternative Protein Volume (K) Forecast, by Application 2020 & 2033
- Table 63: Israel Microbial Alternative Protein Revenue (billion) Forecast, by Application 2020 & 2033
- Table 64: Israel Microbial Alternative Protein Volume (K) Forecast, by Application 2020 & 2033
- Table 65: GCC Microbial Alternative Protein Revenue (billion) Forecast, by Application 2020 & 2033
- Table 66: GCC Microbial Alternative Protein Volume (K) Forecast, by Application 2020 & 2033
- Table 67: North Africa Microbial Alternative Protein Revenue (billion) Forecast, by Application 2020 & 2033
- Table 68: North Africa Microbial Alternative Protein Volume (K) Forecast, by Application 2020 & 2033
- Table 69: South Africa Microbial Alternative Protein Revenue (billion) Forecast, by Application 2020 & 2033
- Table 70: South Africa Microbial Alternative Protein Volume (K) Forecast, by Application 2020 & 2033
- Table 71: Rest of Middle East & Africa Microbial Alternative Protein Revenue (billion) Forecast, by Application 2020 & 2033
- Table 72: Rest of Middle East & Africa Microbial Alternative Protein Volume (K) Forecast, by Application 2020 & 2033
- Table 73: Global Microbial Alternative Protein Revenue billion Forecast, by Application 2020 & 2033
- Table 74: Global Microbial Alternative Protein Volume K Forecast, by Application 2020 & 2033
- Table 75: Global Microbial Alternative Protein Revenue billion Forecast, by Type 2020 & 2033
- Table 76: Global Microbial Alternative Protein Volume K Forecast, by Type 2020 & 2033
- Table 77: Global Microbial Alternative Protein Revenue billion Forecast, by Country 2020 & 2033
- Table 78: Global Microbial Alternative Protein Volume K Forecast, by Country 2020 & 2033
- Table 79: China Microbial Alternative Protein Revenue (billion) Forecast, by Application 2020 & 2033
- Table 80: China Microbial Alternative Protein Volume (K) Forecast, by Application 2020 & 2033
- Table 81: India Microbial Alternative Protein Revenue (billion) Forecast, by Application 2020 & 2033
- Table 82: India Microbial Alternative Protein Volume (K) Forecast, by Application 2020 & 2033
- Table 83: Japan Microbial Alternative Protein Revenue (billion) Forecast, by Application 2020 & 2033
- Table 84: Japan Microbial Alternative Protein Volume (K) Forecast, by Application 2020 & 2033
- Table 85: South Korea Microbial Alternative Protein Revenue (billion) Forecast, by Application 2020 & 2033
- Table 86: South Korea Microbial Alternative Protein Volume (K) Forecast, by Application 2020 & 2033
- Table 87: ASEAN Microbial Alternative Protein Revenue (billion) Forecast, by Application 2020 & 2033
- Table 88: ASEAN Microbial Alternative Protein Volume (K) Forecast, by Application 2020 & 2033
- Table 89: Oceania Microbial Alternative Protein Revenue (billion) Forecast, by Application 2020 & 2033
- Table 90: Oceania Microbial Alternative Protein Volume (K) Forecast, by Application 2020 & 2033
- Table 91: Rest of Asia Pacific Microbial Alternative Protein Revenue (billion) Forecast, by Application 2020 & 2033
- Table 92: Rest of Asia Pacific Microbial Alternative Protein Volume (K) Forecast, by Application 2020 & 2033
Frequently Asked Questions
1. What is the projected Compound Annual Growth Rate (CAGR) of the Microbial Alternative Protein?
The projected CAGR is approximately 14.19%.
2. Which companies are prominent players in the Microbial Alternative Protein?
Key companies in the market include AgriProtein (South Africa), Ynsect (France), Enterra Feed Corporation (Canada), Protix (The Netherlands), Proti-Farm Holding NV (The Netherlands), Entomo Farms (Canada), Global Bugs Asia Co., Ltd. (Thailand), Aspire Food Group (U.S.), Tiny Farms (U.S.).
3. What are the main segments of the Microbial Alternative Protein?
The market segments include Application, Type.
4. Can you provide details about the market size?
The market size is estimated to be USD 1.33 billion as of 2022.
5. What are some drivers contributing to market growth?
N/A
6. What are the notable trends driving market growth?
N/A
7. Are there any restraints impacting market growth?
N/A
8. Can you provide examples of recent developments in the market?
N/A
9. What pricing options are available for accessing the report?
Pricing options include single-user, multi-user, and enterprise licenses priced at USD 3950.00, USD 5925.00, and USD 7900.00 respectively.
10. Is the market size provided in terms of value or volume?
The market size is provided in terms of value, measured in billion and volume, measured in K.
11. Are there any specific market keywords associated with the report?
Yes, the market keyword associated with the report is "Microbial Alternative Protein," which aids in identifying and referencing the specific market segment covered.
12. How do I determine which pricing option suits my needs best?
The pricing options vary based on user requirements and access needs. Individual users may opt for single-user licenses, while businesses requiring broader access may choose multi-user or enterprise licenses for cost-effective access to the report.
13. Are there any additional resources or data provided in the Microbial Alternative Protein report?
While the report offers comprehensive insights, it's advisable to review the specific contents or supplementary materials provided to ascertain if additional resources or data are available.
14. How can I stay updated on further developments or reports in the Microbial Alternative Protein?
To stay informed about further developments, trends, and reports in the Microbial Alternative Protein, consider subscribing to industry newsletters, following relevant companies and organizations, or regularly checking reputable industry news sources and publications.
Methodology
Step 1 - Identification of Relevant Samples Size from Population Database


Step 2 - Approaches for Defining Global Market Size (Value, Volume* & Price*)

Note*: In applicable scenarios
Step 3 - Data Sources
Primary Research
- Web Analytics
- Survey Reports
- Research Institute
- Latest Research Reports
- Opinion Leaders
Secondary Research
- Annual Reports
- White Paper
- Latest Press Release
- Industry Association
- Paid Database
- Investor Presentations

Step 4 - Data Triangulation
Involves using different sources of information in order to increase the validity of a study
These sources are likely to be stakeholders in a program - participants, other researchers, program staff, other community members, and so on.
Then we put all data in single framework & apply various statistical tools to find out the dynamic on the market.
During the analysis stage, feedback from the stakeholder groups would be compared to determine areas of agreement as well as areas of divergence