

Key Insights
The global medium-voltage (MV) cables and accessories market is experiencing significant expansion, propelled by escalating demand for robust and efficient power transmission and distribution infrastructure. The burgeoning renewable energy sector, especially solar and wind power initiatives, is a key driver, necessitating advanced MV cable solutions for seamless grid integration and optimal energy transfer. Concurrently, ongoing urbanization and industrialization in emerging economies are stimulating infrastructure development, thereby increasing the demand for MV cables and accessories. Technological innovations, including the adoption of high-temperature superconductors and advanced insulation materials, are enhancing cable performance and longevity, further contributing to market growth. Competitive strategies among leading players such as Prysmian Group, Nexans, and LS Cable & System Ltd. are influencing market dynamics. However, fluctuations in raw material costs and strict safety and performance regulations present potential market challenges.
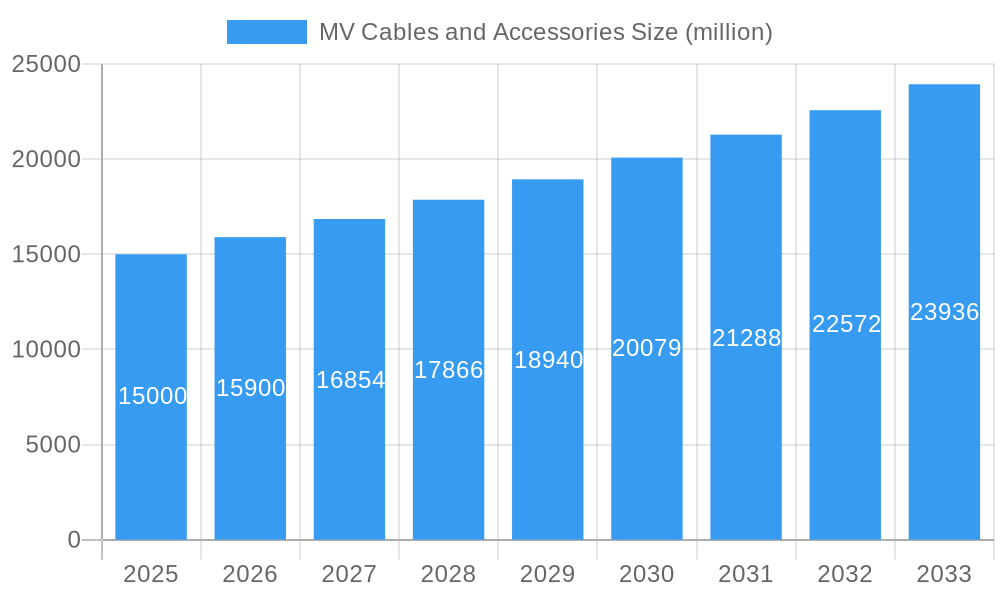
MV Cables and Accessories Market Size (In Billion)
The MV cables and accessories market is projected to reach a size of $33.66 billion by 2033, exhibiting a Compound Annual Growth Rate (CAGR) of 9.27% from a base year of 2025. Market segmentation is expected across diverse cable types (e.g., XLPE, EPR), accessory types (e.g., connectors, terminations), and applications (e.g., power grids, industrial installations). Asia-Pacific and other developing regions are anticipated to lead growth due to their ongoing infrastructure development. Continued investment in smart grids and digitalization further bolsters the long-term market outlook. Companies are prioritizing innovative product development, strategic alliances, and international expansion to leverage growth opportunities.
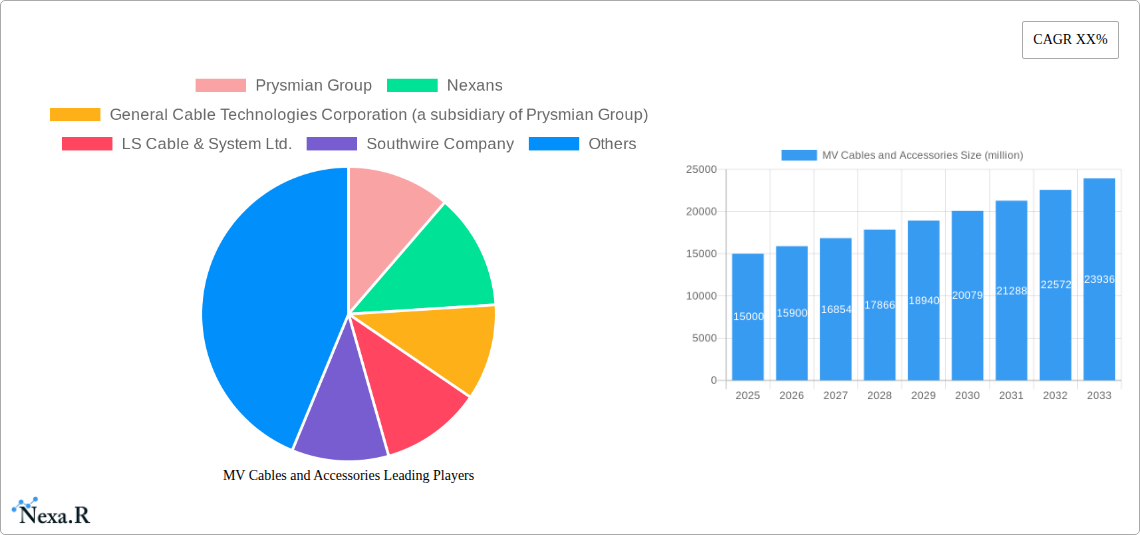
MV Cables and Accessories Company Market Share
MV Cables and Accessories Market Report: 2019-2033
This comprehensive report provides an in-depth analysis of the global MV (Medium Voltage) Cables and Accessories market, offering valuable insights for industry professionals, investors, and strategic decision-makers. The study covers the period from 2019 to 2033, with 2025 serving as the base year and estimated year. The report meticulously examines market dynamics, growth trends, regional dominance, product innovation, and key players, equipping readers with a holistic understanding of this vital sector. The market size is projected in million units.
MV Cables and Accessories Market Dynamics & Structure
This section analyzes the competitive landscape, technological advancements, regulatory influences, and market trends within the MV Cables and Accessories sector. The analysis encompasses market concentration, M&A activities, and the impact of substitute products.
Market Concentration: The MV Cables and Accessories market exhibits a moderately concentrated structure, with several major players holding significant market share. Prysmian Group, Nexans, and ABB Ltd. are among the leading companies. The combined market share of the top five players is estimated at xx% in 2025.
Technological Innovation Drivers: Technological advancements such as the increasing adoption of smart grids, renewable energy integration, and the development of high-performance cable materials are key drivers of market growth. Innovation in areas like cross-linked polyethylene (XLPE) and enhanced insulation technologies is shaping market dynamics.
Regulatory Frameworks: Stringent safety and environmental regulations influence product design and manufacturing processes. Compliance with international standards is crucial for market access.
Competitive Product Substitutes: While limited, alternative technologies like optical fiber cables compete in specific niche applications.
End-User Demographics: The primary end-users are the power and utility sectors, industrial facilities, and building construction industries. Expanding infrastructure projects drive considerable demand.
M&A Trends: The MV Cables and Accessories market has witnessed a moderate level of M&A activity in recent years, with strategic acquisitions aimed at expanding product portfolios and market reach. The total deal volume from 2019-2024 is estimated at xx deals.
- Market share of top 5 players in 2025: xx%
- Number of M&A deals (2019-2024): xx
- Key innovation barriers: High R&D costs, stringent regulatory approvals
MV Cables and Accessories Growth Trends & Insights
This section delves into the market size evolution, adoption rates, technological disruptions, and shifting consumer behavior patterns within the MV Cables and Accessories market. Utilizing extensive market research data, we project a Compound Annual Growth Rate (CAGR) of xx% during the forecast period (2025-2033). Market penetration is expected to reach xx% by 2033. The growth is fueled by increasing demand for reliable power transmission and distribution infrastructure across various end-use sectors, coupled with the rising adoption of smart grid technologies and the expansion of renewable energy integration into national grids. Technological advancements in insulation materials, high-voltage cable design, and increased energy efficiency standards have played a vital role in driving this growth.
Dominant Regions, Countries, or Segments in MV Cables and Accessories
This section identifies the leading regions, countries, or segments contributing to the growth of the MV Cables and Accessories market. Analysis reveals that [Specific Region, e.g., Asia Pacific] is the dominant region, driven primarily by robust infrastructure development in countries like China and India. [Specific Country] exhibits strong growth potential due to government investment in renewable energy and smart grid projects.
- Key Drivers for [Specific Region]:
- Rapid industrialization and urbanization.
- Government initiatives promoting renewable energy integration.
- Expansion of power transmission and distribution networks.
- Dominance Factors: High infrastructure investments, growing energy demand, and supportive government policies.
- Growth Potential: The [Specific Region] is projected to maintain its leadership throughout the forecast period, with a CAGR of xx%.
MV Cables and Accessories Product Landscape
The MV Cables and Accessories market offers a diverse range of products, including XLPE cables, high-voltage cables, and various accessories like connectors, terminations, and joints. Recent innovations focus on improving insulation properties, enhancing thermal stability, and increasing cable lifespan. These advancements address issues of reliability, safety, and efficiency. Unique selling propositions often include superior performance under extreme conditions and compliance with the latest industry standards.
Key Drivers, Barriers & Challenges in MV Cables and Accessories
Key Drivers:
- Rising demand for electricity globally.
- Expansion of renewable energy sources (solar, wind).
- Investments in smart grid infrastructure.
- Stringent regulations for energy efficiency and safety.
Key Challenges & Restraints:
- Fluctuations in raw material prices (copper, aluminum).
- Complex supply chain logistics.
- Intense competition from established players.
- Regulatory compliance costs.
Emerging Opportunities in MV Cables and Accessories
- Growth in developing economies.
- Increasing adoption of smart grid technologies.
- Expansion into new applications (e.g., electric vehicle charging infrastructure).
- Development of eco-friendly cable materials.
Growth Accelerators in the MV Cables and Accessories Industry
Long-term growth will be spurred by ongoing technological advancements, strategic partnerships among manufacturers and utilities, and expansion into emerging markets with significant infrastructure needs. The adoption of innovative materials and manufacturing processes, coupled with the global push for sustainable energy solutions, will continue to shape the industry's trajectory.
Key Players Shaping the MV Cables and Accessories Market
- Prysmian Group
- Nexans
- General Cable Technologies Corporation (a subsidiary of Prysmian Group)
- LS Cable & System Ltd.
- Southwire Company, LLC
- ABB Ltd.
- Taihan Electric Wire Co., Ltd.
- Furukawa Electric Co., Ltd.
- NKT A/S
- Sumitomo Electric Industries, Ltd.
Notable Milestones in MV Cables and Accessories Sector
- 2020: Prysmian Group launched a new range of high-voltage XLPE cables.
- 2021: Nexans secured a major contract for smart grid upgrades in [Specific Region].
- 2022: ABB introduced innovative cable accessories enhancing installation efficiency.
- 2023: [Include relevant milestone]
- 2024: [Include relevant milestone]
In-Depth MV Cables and Accessories Market Outlook
The MV Cables and Accessories market is poised for robust growth over the next decade, driven by sustained infrastructure development, the increasing adoption of smart grid technologies, and a global focus on decarbonization. Strategic partnerships, technological innovation, and expansion into underserved markets will be key factors in shaping the market’s future trajectory. The market's potential for growth in renewable energy projects and the continued rise in global electricity consumption present significant opportunities for market players.
MV Cables and Accessories Segmentation
-
1. Application
- 1.1. Construction Industry
- 1.2. Petroleum and Natural Gas
- 1.3. Manufacturing
- 1.4. Other
-
2. Types
- 2.1. Medium Voltage Power Cable
- 2.2. Medium Voltage Distribution Cables
- 2.3. Medium Pressure Connector
- 2.4. Other
MV Cables and Accessories Segmentation By Geography
-
1. North America
- 1.1. United States
- 1.2. Canada
- 1.3. Mexico
-
2. South America
- 2.1. Brazil
- 2.2. Argentina
- 2.3. Rest of South America
-
3. Europe
- 3.1. United Kingdom
- 3.2. Germany
- 3.3. France
- 3.4. Italy
- 3.5. Spain
- 3.6. Russia
- 3.7. Benelux
- 3.8. Nordics
- 3.9. Rest of Europe
-
4. Middle East & Africa
- 4.1. Turkey
- 4.2. Israel
- 4.3. GCC
- 4.4. North Africa
- 4.5. South Africa
- 4.6. Rest of Middle East & Africa
-
5. Asia Pacific
- 5.1. China
- 5.2. India
- 5.3. Japan
- 5.4. South Korea
- 5.5. ASEAN
- 5.6. Oceania
- 5.7. Rest of Asia Pacific
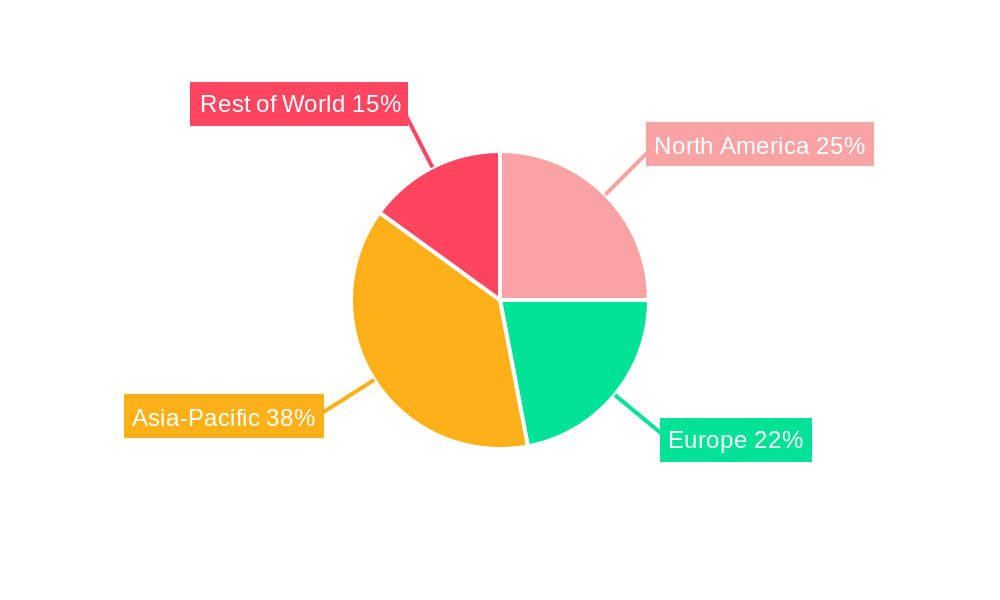
MV Cables and Accessories Regional Market Share
Geographic Coverage of MV Cables and Accessories
MV Cables and Accessories REPORT HIGHLIGHTS
| Aspects | Details |
|---|---|
| Study Period | 2020-2034 |
| Base Year | 2025 |
| Estimated Year | 2026 |
| Forecast Period | 2026-2034 |
| Historical Period | 2020-2025 |
| Growth Rate | CAGR of 9.27% from 2020-2034 |
| Segmentation |
|
Table of Contents
- 1. Introduction
- 1.1. Research Scope
- 1.2. Market Segmentation
- 1.3. Research Methodology
- 1.4. Definitions and Assumptions
- 2. Executive Summary
- 2.1. Introduction
- 3. Market Dynamics
- 3.1. Introduction
- 3.2. Market Drivers
- 3.3. Market Restrains
- 3.4. Market Trends
- 4. Market Factor Analysis
- 4.1. Porters Five Forces
- 4.2. Supply/Value Chain
- 4.3. PESTEL analysis
- 4.4. Market Entropy
- 4.5. Patent/Trademark Analysis
- 5. Global MV Cables and Accessories Analysis, Insights and Forecast, 2020-2032
- 5.1. Market Analysis, Insights and Forecast - by Application
- 5.1.1. Construction Industry
- 5.1.2. Petroleum and Natural Gas
- 5.1.3. Manufacturing
- 5.1.4. Other
- 5.2. Market Analysis, Insights and Forecast - by Types
- 5.2.1. Medium Voltage Power Cable
- 5.2.2. Medium Voltage Distribution Cables
- 5.2.3. Medium Pressure Connector
- 5.2.4. Other
- 5.3. Market Analysis, Insights and Forecast - by Region
- 5.3.1. North America
- 5.3.2. South America
- 5.3.3. Europe
- 5.3.4. Middle East & Africa
- 5.3.5. Asia Pacific
- 5.1. Market Analysis, Insights and Forecast - by Application
- 6. North America MV Cables and Accessories Analysis, Insights and Forecast, 2020-2032
- 6.1. Market Analysis, Insights and Forecast - by Application
- 6.1.1. Construction Industry
- 6.1.2. Petroleum and Natural Gas
- 6.1.3. Manufacturing
- 6.1.4. Other
- 6.2. Market Analysis, Insights and Forecast - by Types
- 6.2.1. Medium Voltage Power Cable
- 6.2.2. Medium Voltage Distribution Cables
- 6.2.3. Medium Pressure Connector
- 6.2.4. Other
- 6.1. Market Analysis, Insights and Forecast - by Application
- 7. South America MV Cables and Accessories Analysis, Insights and Forecast, 2020-2032
- 7.1. Market Analysis, Insights and Forecast - by Application
- 7.1.1. Construction Industry
- 7.1.2. Petroleum and Natural Gas
- 7.1.3. Manufacturing
- 7.1.4. Other
- 7.2. Market Analysis, Insights and Forecast - by Types
- 7.2.1. Medium Voltage Power Cable
- 7.2.2. Medium Voltage Distribution Cables
- 7.2.3. Medium Pressure Connector
- 7.2.4. Other
- 7.1. Market Analysis, Insights and Forecast - by Application
- 8. Europe MV Cables and Accessories Analysis, Insights and Forecast, 2020-2032
- 8.1. Market Analysis, Insights and Forecast - by Application
- 8.1.1. Construction Industry
- 8.1.2. Petroleum and Natural Gas
- 8.1.3. Manufacturing
- 8.1.4. Other
- 8.2. Market Analysis, Insights and Forecast - by Types
- 8.2.1. Medium Voltage Power Cable
- 8.2.2. Medium Voltage Distribution Cables
- 8.2.3. Medium Pressure Connector
- 8.2.4. Other
- 8.1. Market Analysis, Insights and Forecast - by Application
- 9. Middle East & Africa MV Cables and Accessories Analysis, Insights and Forecast, 2020-2032
- 9.1. Market Analysis, Insights and Forecast - by Application
- 9.1.1. Construction Industry
- 9.1.2. Petroleum and Natural Gas
- 9.1.3. Manufacturing
- 9.1.4. Other
- 9.2. Market Analysis, Insights and Forecast - by Types
- 9.2.1. Medium Voltage Power Cable
- 9.2.2. Medium Voltage Distribution Cables
- 9.2.3. Medium Pressure Connector
- 9.2.4. Other
- 9.1. Market Analysis, Insights and Forecast - by Application
- 10. Asia Pacific MV Cables and Accessories Analysis, Insights and Forecast, 2020-2032
- 10.1. Market Analysis, Insights and Forecast - by Application
- 10.1.1. Construction Industry
- 10.1.2. Petroleum and Natural Gas
- 10.1.3. Manufacturing
- 10.1.4. Other
- 10.2. Market Analysis, Insights and Forecast - by Types
- 10.2.1. Medium Voltage Power Cable
- 10.2.2. Medium Voltage Distribution Cables
- 10.2.3. Medium Pressure Connector
- 10.2.4. Other
- 10.1. Market Analysis, Insights and Forecast - by Application
- 11. Competitive Analysis
- 11.1. Global Market Share Analysis 2025
- 11.2. Company Profiles
- 11.2.1 Prysmian Group
- 11.2.1.1. Overview
- 11.2.1.2. Products
- 11.2.1.3. SWOT Analysis
- 11.2.1.4. Recent Developments
- 11.2.1.5. Financials (Based on Availability)
- 11.2.2 Nexans
- 11.2.2.1. Overview
- 11.2.2.2. Products
- 11.2.2.3. SWOT Analysis
- 11.2.2.4. Recent Developments
- 11.2.2.5. Financials (Based on Availability)
- 11.2.3 General Cable Technologies Corporation (a subsidiary of Prysmian Group)
- 11.2.3.1. Overview
- 11.2.3.2. Products
- 11.2.3.3. SWOT Analysis
- 11.2.3.4. Recent Developments
- 11.2.3.5. Financials (Based on Availability)
- 11.2.4 LS Cable & System Ltd.
- 11.2.4.1. Overview
- 11.2.4.2. Products
- 11.2.4.3. SWOT Analysis
- 11.2.4.4. Recent Developments
- 11.2.4.5. Financials (Based on Availability)
- 11.2.5 Southwire Company
- 11.2.5.1. Overview
- 11.2.5.2. Products
- 11.2.5.3. SWOT Analysis
- 11.2.5.4. Recent Developments
- 11.2.5.5. Financials (Based on Availability)
- 11.2.6 LLC
- 11.2.6.1. Overview
- 11.2.6.2. Products
- 11.2.6.3. SWOT Analysis
- 11.2.6.4. Recent Developments
- 11.2.6.5. Financials (Based on Availability)
- 11.2.7 ABB Ltd.
- 11.2.7.1. Overview
- 11.2.7.2. Products
- 11.2.7.3. SWOT Analysis
- 11.2.7.4. Recent Developments
- 11.2.7.5. Financials (Based on Availability)
- 11.2.8 Taihan Electric Wire Co.
- 11.2.8.1. Overview
- 11.2.8.2. Products
- 11.2.8.3. SWOT Analysis
- 11.2.8.4. Recent Developments
- 11.2.8.5. Financials (Based on Availability)
- 11.2.9 Ltd.
- 11.2.9.1. Overview
- 11.2.9.2. Products
- 11.2.9.3. SWOT Analysis
- 11.2.9.4. Recent Developments
- 11.2.9.5. Financials (Based on Availability)
- 11.2.10 Furukawa Electric Co.
- 11.2.10.1. Overview
- 11.2.10.2. Products
- 11.2.10.3. SWOT Analysis
- 11.2.10.4. Recent Developments
- 11.2.10.5. Financials (Based on Availability)
- 11.2.11 Ltd.
- 11.2.11.1. Overview
- 11.2.11.2. Products
- 11.2.11.3. SWOT Analysis
- 11.2.11.4. Recent Developments
- 11.2.11.5. Financials (Based on Availability)
- 11.2.12 NKT A/S
- 11.2.12.1. Overview
- 11.2.12.2. Products
- 11.2.12.3. SWOT Analysis
- 11.2.12.4. Recent Developments
- 11.2.12.5. Financials (Based on Availability)
- 11.2.13 Sumitomo Electric Industries
- 11.2.13.1. Overview
- 11.2.13.2. Products
- 11.2.13.3. SWOT Analysis
- 11.2.13.4. Recent Developments
- 11.2.13.5. Financials (Based on Availability)
- 11.2.14 Ltd.
- 11.2.14.1. Overview
- 11.2.14.2. Products
- 11.2.14.3. SWOT Analysis
- 11.2.14.4. Recent Developments
- 11.2.14.5. Financials (Based on Availability)
- 11.2.1 Prysmian Group
List of Figures
- Figure 1: Global MV Cables and Accessories Revenue Breakdown (billion, %) by Region 2025 & 2033
- Figure 2: North America MV Cables and Accessories Revenue (billion), by Application 2025 & 2033
- Figure 3: North America MV Cables and Accessories Revenue Share (%), by Application 2025 & 2033
- Figure 4: North America MV Cables and Accessories Revenue (billion), by Types 2025 & 2033
- Figure 5: North America MV Cables and Accessories Revenue Share (%), by Types 2025 & 2033
- Figure 6: North America MV Cables and Accessories Revenue (billion), by Country 2025 & 2033
- Figure 7: North America MV Cables and Accessories Revenue Share (%), by Country 2025 & 2033
- Figure 8: South America MV Cables and Accessories Revenue (billion), by Application 2025 & 2033
- Figure 9: South America MV Cables and Accessories Revenue Share (%), by Application 2025 & 2033
- Figure 10: South America MV Cables and Accessories Revenue (billion), by Types 2025 & 2033
- Figure 11: South America MV Cables and Accessories Revenue Share (%), by Types 2025 & 2033
- Figure 12: South America MV Cables and Accessories Revenue (billion), by Country 2025 & 2033
- Figure 13: South America MV Cables and Accessories Revenue Share (%), by Country 2025 & 2033
- Figure 14: Europe MV Cables and Accessories Revenue (billion), by Application 2025 & 2033
- Figure 15: Europe MV Cables and Accessories Revenue Share (%), by Application 2025 & 2033
- Figure 16: Europe MV Cables and Accessories Revenue (billion), by Types 2025 & 2033
- Figure 17: Europe MV Cables and Accessories Revenue Share (%), by Types 2025 & 2033
- Figure 18: Europe MV Cables and Accessories Revenue (billion), by Country 2025 & 2033
- Figure 19: Europe MV Cables and Accessories Revenue Share (%), by Country 2025 & 2033
- Figure 20: Middle East & Africa MV Cables and Accessories Revenue (billion), by Application 2025 & 2033
- Figure 21: Middle East & Africa MV Cables and Accessories Revenue Share (%), by Application 2025 & 2033
- Figure 22: Middle East & Africa MV Cables and Accessories Revenue (billion), by Types 2025 & 2033
- Figure 23: Middle East & Africa MV Cables and Accessories Revenue Share (%), by Types 2025 & 2033
- Figure 24: Middle East & Africa MV Cables and Accessories Revenue (billion), by Country 2025 & 2033
- Figure 25: Middle East & Africa MV Cables and Accessories Revenue Share (%), by Country 2025 & 2033
- Figure 26: Asia Pacific MV Cables and Accessories Revenue (billion), by Application 2025 & 2033
- Figure 27: Asia Pacific MV Cables and Accessories Revenue Share (%), by Application 2025 & 2033
- Figure 28: Asia Pacific MV Cables and Accessories Revenue (billion), by Types 2025 & 2033
- Figure 29: Asia Pacific MV Cables and Accessories Revenue Share (%), by Types 2025 & 2033
- Figure 30: Asia Pacific MV Cables and Accessories Revenue (billion), by Country 2025 & 2033
- Figure 31: Asia Pacific MV Cables and Accessories Revenue Share (%), by Country 2025 & 2033
List of Tables
- Table 1: Global MV Cables and Accessories Revenue billion Forecast, by Application 2020 & 2033
- Table 2: Global MV Cables and Accessories Revenue billion Forecast, by Types 2020 & 2033
- Table 3: Global MV Cables and Accessories Revenue billion Forecast, by Region 2020 & 2033
- Table 4: Global MV Cables and Accessories Revenue billion Forecast, by Application 2020 & 2033
- Table 5: Global MV Cables and Accessories Revenue billion Forecast, by Types 2020 & 2033
- Table 6: Global MV Cables and Accessories Revenue billion Forecast, by Country 2020 & 2033
- Table 7: United States MV Cables and Accessories Revenue (billion) Forecast, by Application 2020 & 2033
- Table 8: Canada MV Cables and Accessories Revenue (billion) Forecast, by Application 2020 & 2033
- Table 9: Mexico MV Cables and Accessories Revenue (billion) Forecast, by Application 2020 & 2033
- Table 10: Global MV Cables and Accessories Revenue billion Forecast, by Application 2020 & 2033
- Table 11: Global MV Cables and Accessories Revenue billion Forecast, by Types 2020 & 2033
- Table 12: Global MV Cables and Accessories Revenue billion Forecast, by Country 2020 & 2033
- Table 13: Brazil MV Cables and Accessories Revenue (billion) Forecast, by Application 2020 & 2033
- Table 14: Argentina MV Cables and Accessories Revenue (billion) Forecast, by Application 2020 & 2033
- Table 15: Rest of South America MV Cables and Accessories Revenue (billion) Forecast, by Application 2020 & 2033
- Table 16: Global MV Cables and Accessories Revenue billion Forecast, by Application 2020 & 2033
- Table 17: Global MV Cables and Accessories Revenue billion Forecast, by Types 2020 & 2033
- Table 18: Global MV Cables and Accessories Revenue billion Forecast, by Country 2020 & 2033
- Table 19: United Kingdom MV Cables and Accessories Revenue (billion) Forecast, by Application 2020 & 2033
- Table 20: Germany MV Cables and Accessories Revenue (billion) Forecast, by Application 2020 & 2033
- Table 21: France MV Cables and Accessories Revenue (billion) Forecast, by Application 2020 & 2033
- Table 22: Italy MV Cables and Accessories Revenue (billion) Forecast, by Application 2020 & 2033
- Table 23: Spain MV Cables and Accessories Revenue (billion) Forecast, by Application 2020 & 2033
- Table 24: Russia MV Cables and Accessories Revenue (billion) Forecast, by Application 2020 & 2033
- Table 25: Benelux MV Cables and Accessories Revenue (billion) Forecast, by Application 2020 & 2033
- Table 26: Nordics MV Cables and Accessories Revenue (billion) Forecast, by Application 2020 & 2033
- Table 27: Rest of Europe MV Cables and Accessories Revenue (billion) Forecast, by Application 2020 & 2033
- Table 28: Global MV Cables and Accessories Revenue billion Forecast, by Application 2020 & 2033
- Table 29: Global MV Cables and Accessories Revenue billion Forecast, by Types 2020 & 2033
- Table 30: Global MV Cables and Accessories Revenue billion Forecast, by Country 2020 & 2033
- Table 31: Turkey MV Cables and Accessories Revenue (billion) Forecast, by Application 2020 & 2033
- Table 32: Israel MV Cables and Accessories Revenue (billion) Forecast, by Application 2020 & 2033
- Table 33: GCC MV Cables and Accessories Revenue (billion) Forecast, by Application 2020 & 2033
- Table 34: North Africa MV Cables and Accessories Revenue (billion) Forecast, by Application 2020 & 2033
- Table 35: South Africa MV Cables and Accessories Revenue (billion) Forecast, by Application 2020 & 2033
- Table 36: Rest of Middle East & Africa MV Cables and Accessories Revenue (billion) Forecast, by Application 2020 & 2033
- Table 37: Global MV Cables and Accessories Revenue billion Forecast, by Application 2020 & 2033
- Table 38: Global MV Cables and Accessories Revenue billion Forecast, by Types 2020 & 2033
- Table 39: Global MV Cables and Accessories Revenue billion Forecast, by Country 2020 & 2033
- Table 40: China MV Cables and Accessories Revenue (billion) Forecast, by Application 2020 & 2033
- Table 41: India MV Cables and Accessories Revenue (billion) Forecast, by Application 2020 & 2033
- Table 42: Japan MV Cables and Accessories Revenue (billion) Forecast, by Application 2020 & 2033
- Table 43: South Korea MV Cables and Accessories Revenue (billion) Forecast, by Application 2020 & 2033
- Table 44: ASEAN MV Cables and Accessories Revenue (billion) Forecast, by Application 2020 & 2033
- Table 45: Oceania MV Cables and Accessories Revenue (billion) Forecast, by Application 2020 & 2033
- Table 46: Rest of Asia Pacific MV Cables and Accessories Revenue (billion) Forecast, by Application 2020 & 2033
Frequently Asked Questions
1. What is the projected Compound Annual Growth Rate (CAGR) of the MV Cables and Accessories?
The projected CAGR is approximately 9.27%.
2. Which companies are prominent players in the MV Cables and Accessories?
Key companies in the market include Prysmian Group, Nexans, General Cable Technologies Corporation (a subsidiary of Prysmian Group), LS Cable & System Ltd., Southwire Company, LLC, ABB Ltd., Taihan Electric Wire Co., Ltd., Furukawa Electric Co., Ltd., NKT A/S, Sumitomo Electric Industries, Ltd..
3. What are the main segments of the MV Cables and Accessories?
The market segments include Application, Types.
4. Can you provide details about the market size?
The market size is estimated to be USD 33.66 billion as of 2022.
5. What are some drivers contributing to market growth?
N/A
6. What are the notable trends driving market growth?
N/A
7. Are there any restraints impacting market growth?
N/A
8. Can you provide examples of recent developments in the market?
N/A
9. What pricing options are available for accessing the report?
Pricing options include single-user, multi-user, and enterprise licenses priced at USD 4350.00, USD 6525.00, and USD 8700.00 respectively.
10. Is the market size provided in terms of value or volume?
The market size is provided in terms of value, measured in billion.
11. Are there any specific market keywords associated with the report?
Yes, the market keyword associated with the report is "MV Cables and Accessories," which aids in identifying and referencing the specific market segment covered.
12. How do I determine which pricing option suits my needs best?
The pricing options vary based on user requirements and access needs. Individual users may opt for single-user licenses, while businesses requiring broader access may choose multi-user or enterprise licenses for cost-effective access to the report.
13. Are there any additional resources or data provided in the MV Cables and Accessories report?
While the report offers comprehensive insights, it's advisable to review the specific contents or supplementary materials provided to ascertain if additional resources or data are available.
14. How can I stay updated on further developments or reports in the MV Cables and Accessories?
To stay informed about further developments, trends, and reports in the MV Cables and Accessories, consider subscribing to industry newsletters, following relevant companies and organizations, or regularly checking reputable industry news sources and publications.
Methodology
Step 1 - Identification of Relevant Samples Size from Population Database


Step 2 - Approaches for Defining Global Market Size (Value, Volume* & Price*)

Note*: In applicable scenarios
Step 3 - Data Sources
Primary Research
- Web Analytics
- Survey Reports
- Research Institute
- Latest Research Reports
- Opinion Leaders
Secondary Research
- Annual Reports
- White Paper
- Latest Press Release
- Industry Association
- Paid Database
- Investor Presentations

Step 4 - Data Triangulation
Involves using different sources of information in order to increase the validity of a study
These sources are likely to be stakeholders in a program - participants, other researchers, program staff, other community members, and so on.
Then we put all data in single framework & apply various statistical tools to find out the dynamic on the market.
During the analysis stage, feedback from the stakeholder groups would be compared to determine areas of agreement as well as areas of divergence