

Key Insights
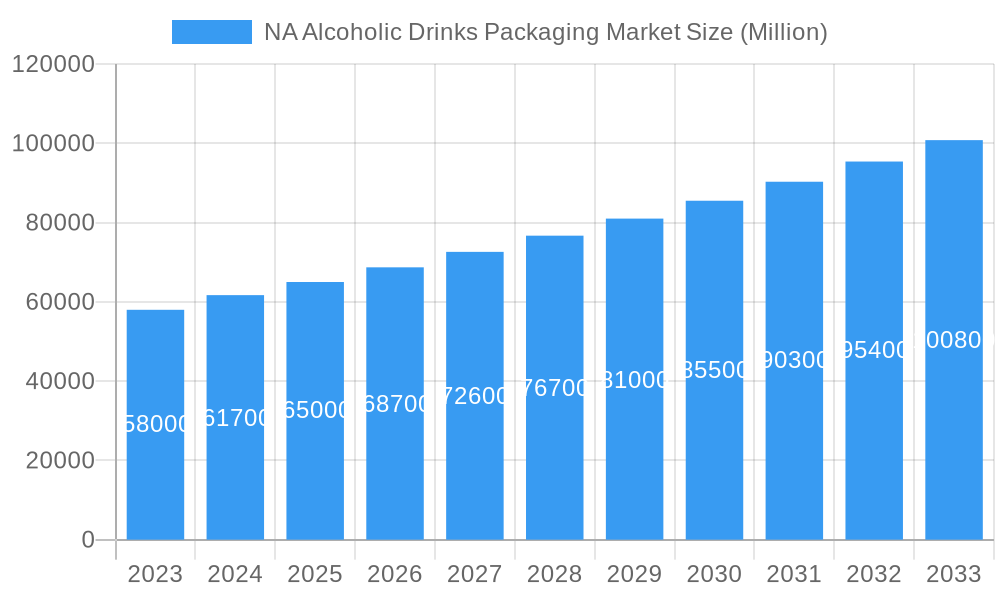
The North American alcoholic drinks packaging market is poised for robust expansion, projected to reach a substantial market size of approximately USD 65,000 million by 2025, growing at a Compound Annual Growth Rate (CAGR) of 5.50%. This sustained growth trajectory, expected to continue through 2033, is primarily fueled by evolving consumer preferences towards premium and convenient packaging solutions, coupled with an increasing demand for a diverse range of alcoholic beverages. The growing popularity of Ready-to-Drink (RTD) cocktails and craft beers, which often feature innovative and eye-catching packaging, is a significant driver. Furthermore, a heightened focus on sustainability is compelling manufacturers to explore eco-friendly materials like paper and advanced recyclable plastics, presenting both opportunities and challenges for the market. The influence of e-commerce and direct-to-consumer (DTC) sales models is also shaping packaging requirements, emphasizing durability, portability, and aesthetic appeal to capture consumer attention online and during delivery.
NA Alcoholic Drinks Packaging Market Market Size (In Billion)
The market segmentation reveals a dynamic landscape. Plastic bottles and metal cans are anticipated to dominate due to their cost-effectiveness, durability, and recyclability, aligning with sustainability trends. However, glass bottles continue to hold a strong presence, particularly for premium spirits and wines, where perceived quality is paramount. The alcoholic products segment is experiencing substantial growth in RTDs and spirits, necessitating packaging that maintains product integrity and enhances brand visibility. Major players like Ball Corporation, Crown Holdings, and Amcor Ltd are actively investing in research and development to innovate packaging technologies, focusing on lightweighting, enhanced barrier properties, and sustainable materials. While the market presents significant opportunities, potential restraints include fluctuating raw material costs, stringent regulatory requirements for food-grade packaging, and the capital investment needed for adopting new, sustainable packaging technologies.
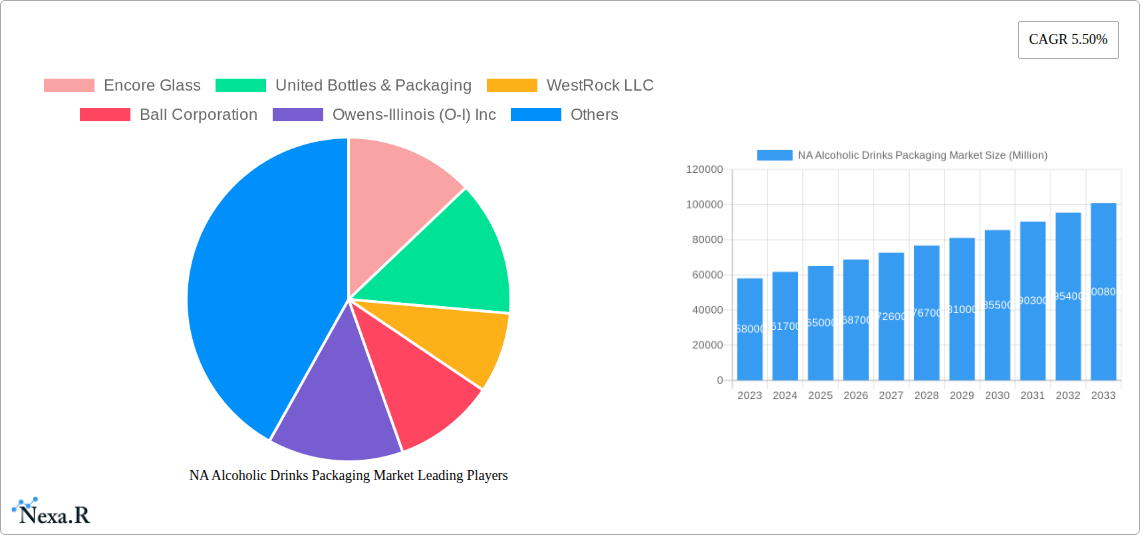
NA Alcoholic Drinks Packaging Market Company Market Share
This in-depth market research report provides a definitive analysis of the North America Alcoholic Drinks Packaging Market, delving into current trends, future projections, and key growth drivers. Covering a comprehensive study period from 2019 to 2033, with a base and estimated year of 2025, this report offers actionable insights for stakeholders seeking to understand the evolving landscape of alcoholic beverage packaging solutions across the region. Our analysis encompasses detailed segmentation by primary material (plastic, paper, metal, glass), alcoholic products (wine, spirits, beer, ready-to-drink (RTD), other types of alcoholic beverages), and product type (plastic bottles, glass bottles, metal cans, cartons, pouches, other product types). Discover how innovations in sustainable packaging, lightweighting, and convenience formats are reshaping consumer choices and driving market expansion. Gain a competitive edge with our forecast for CAGR (Compound Annual Growth Rate) and market penetration, informed by robust data and expert analysis. This report is essential for packaging manufacturers, alcoholic beverage producers, material suppliers, and industry investors navigating the dynamic North American spirits packaging market, beer bottle market, wine packaging trends, and RTD can market.
NA Alcoholic Drinks Packaging Market Market Dynamics & Structure
The North American alcoholic drinks packaging market exhibits a dynamic interplay of concentration, innovation, and regulatory influence. Market concentration is moderately fragmented, with key players like Ball Corporation, Crown Holdings Incorporated, and Amcor Ltd holding significant shares, particularly in metal cans and plastic bottles. However, the presence of specialized glass manufacturers such as Encore Glass and Owens-Illinois (O-I) Inc., alongside other established entities like United Bottles & Packaging, WestRock LLC, Ardagh Group SA, Berry Global Inc, IntraPac International LL, and Brick Packaging LLC, indicates robust competition across various material segments. Technological innovation is a primary driver, with a constant push towards lighter-weight materials, improved barrier properties, and aesthetically pleasing designs. Regulatory frameworks, particularly concerning sustainability and recyclability, are increasingly shaping material choices and product development. Competitive product substitutes are prevalent, especially between glass bottles and metal cans for beer and RTDs, and between various plastic bottle formats and pouches for other alcoholic beverages. End-user demographics are shifting, with a growing demand for convenience, smaller portion sizes, and premiumization, influencing packaging design and functionality. Mergers and acquisitions (M&A) are a recurring trend, as companies seek to expand their product portfolios, geographical reach, and technological capabilities. For instance, significant investments in sustainable glass production by Owens-Illinois (O-I), Inc. highlight the strategic importance of eco-friendly packaging.
- Market Concentration: Moderate fragmentation with leading players in metal cans, plastic bottles, and glass bottles.
- Technological Innovation Drivers: Lightweighting, enhanced barrier properties, aesthetic appeal, smart packaging, and sustainable solutions.
- Regulatory Frameworks: Growing emphasis on recyclability, plastic reduction mandates, and extended producer responsibility.
- Competitive Product Substitutes: Intense rivalry between glass, metal, plastic, and paper-based packaging solutions.
- End-User Demographics: Shifting preferences towards convenience, premiumization, sustainability, and single-serve options.
- M&A Trends: Strategic acquisitions to bolster product offerings, market access, and technological expertise.
NA Alcoholic Drinks Packaging Market Growth Trends & Insights
The North America Alcoholic Drinks Packaging Market is poised for substantial growth, driven by a confluence of evolving consumer preferences and advancements in packaging technology. The market size is projected to witness a healthy CAGR over the forecast period (2025–2033), fueled by increased consumption of alcoholic beverages, particularly beer, wine, and Ready-to-Drink (RTD) cocktails. Adoption rates for innovative and sustainable packaging formats are accelerating, as both manufacturers and consumers prioritize environmental responsibility. Technological disruptions, such as the development of advanced plastic bottles with improved barrier properties and the ongoing evolution of lightweight metal cans, are contributing significantly to market expansion. Consumer behavior shifts are playing a pivotal role, with a discernible trend towards convenience-oriented packaging, such as single-serve options and resealable closures, catering to on-the-go consumption. Furthermore, the demand for premium and artisanal alcoholic beverages is spurring the use of more sophisticated and aesthetically appealing packaging, including custom-designed glass bottles and decorative metal cans. The rise of the RTD segment is a particularly strong growth driver, with consumers increasingly opting for pre-mixed cocktails that offer convenience and a wide variety of flavors. This surge in RTD consumption directly translates into higher demand for efficient and attractive packaging solutions like sleek metal cans and specialized plastic bottles. The report quantures this growth with specific metrics, including an estimated market size evolution of approximately XX million units by 2025, with projected growth reaching XX million units by 2033. The market penetration of sustainable packaging solutions is expected to rise from XX% in 2025 to XX% by 2033, reflecting a significant shift in consumer and industry priorities.
Dominant Regions, Countries, or Segments in NA Alcoholic Drinks Packaging Market
The North America Alcoholic Drinks Packaging Market is characterized by distinct regional dominance and segment leadership, driven by economic policies, infrastructure, and consumer behavior. Within the primary material segment, Glass Bottles currently hold a dominant position, particularly for wine and premium spirits, due to their perceived quality, inertness, and recyclability. The United States stands out as the leading country, fueled by its vast consumer base and mature alcoholic beverage industry. This dominance is further amplified by strong growth in the beer and RTD segments, which are increasingly adopting lightweight metal cans.
- Dominant Primary Material: Glass, primarily for premium segments, with significant growth in Metal for RTDs and Beer.
- Glass: Favored for wine and spirits, offering a premium perception and inertness. The US and Canada are key markets.
- Metal Cans: Experiencing rapid adoption in the beer and RTD sectors due to their light weight, recyclability, and portability.
- Dominant Alcoholic Product: Beer continues to be a volume driver, but the Ready-to-Drink (RTD) segment is exhibiting the highest growth potential.
- Beer: Traditional stronghold, benefiting from innovations in can technology and multipack formats.
- Ready-to-Drink (RTD): Rapidly expanding market, driven by convenience, variety, and appeal to younger demographics, heavily reliant on metal cans and specialized plastic bottles.
- Dominant Product Type: Glass Bottles lead in value, while Metal Cans are experiencing the highest volume growth.
- Glass Bottles: Dominating the premium wine and spirits packaging.
- Metal Cans: Surging in popularity for beer and RTDs, driven by sustainability and convenience.
- Leading Country: The United States commands the largest market share due to its substantial population, high per capita consumption of alcoholic beverages, and robust beverage industry infrastructure.
- Economic Policies: Favorable trade agreements and investment incentives support manufacturing and distribution.
- Infrastructure: Well-developed logistics networks facilitate efficient supply chain management.
- Consumer Behavior: High disposable incomes and a sophisticated consumer base drive demand for diverse alcoholic offerings and premium packaging.
- Growth Potential: The RTD segment presents significant untapped potential, driven by evolving consumer lifestyles and a demand for convenient, ready-to-consume alcoholic beverages. This is expected to fuel further innovation in plastic bottles and metal cans.
NA Alcoholic Drinks Packaging Market Product Landscape
The North America Alcoholic Drinks Packaging Market product landscape is defined by continuous innovation aimed at enhancing consumer experience, sustainability, and product integrity. Glass bottles continue to be a benchmark for premium wine and spirits, with advancements in lighter-weight designs and decorative finishes. Metal cans are evolving beyond basic beverage containers, offering sophisticated printing capabilities and innovative opening mechanisms for beer and RTDs. The development of advanced plastic bottles with improved barrier properties and greater recyclability addresses the demand for convenience and eco-consciousness in segments like RTDs and certain spirits. The introduction of cartons and pouches, though smaller segments, caters to niche markets seeking novel formats and portability. Performance metrics are increasingly focused on material reduction, extended shelf life, and enhanced consumer engagement through unique designs and functionalities.
Key Drivers, Barriers & Challenges in NA Alcoholic Drinks Packaging Market
Key Drivers:
- Growing Demand for Convenience: The rising popularity of Ready-to-Drink (RTD) beverages and single-serve formats drives the demand for easily portable and accessible packaging like metal cans and specialized plastic bottles.
- Sustainability Initiatives: Increasing consumer and regulatory pressure for eco-friendly packaging solutions is boosting the adoption of recyclable and lightweight materials, favoring metal cans, glass bottles, and advanced plastic bottles.
- Premiumization Trend: The demand for premium and craft alcoholic beverages fuels innovation in packaging design, material quality, and decorative finishes for glass bottles and high-quality metal cans.
- Technological Advancements: Innovations in material science and manufacturing processes enable lighter-weight packaging, improved barrier properties, and enhanced aesthetic appeal, supporting growth across all segments.
Barriers & Challenges:
- Raw Material Price Volatility: Fluctuations in the prices of glass, metal, and plastic can impact manufacturing costs and profit margins.
- Regulatory Compliance: Stringent regulations regarding food-grade materials, recycling targets, and labeling can pose challenges for manufacturers.
- Supply Chain Disruptions: Global supply chain issues, including transportation and labor shortages, can affect the availability and cost of packaging materials.
- Competition from Substitutes: Intense competition between different packaging materials, such as glass vs. metal cans for beer, requires continuous innovation to maintain market share.
- Capital Investment: Significant capital expenditure is often required for upgrading manufacturing facilities to adopt new technologies and sustainable practices.
Emerging Opportunities in NA Alcoholic Drinks Packaging Market
Emerging opportunities in the North America Alcoholic Drinks Packaging Market are largely centered around innovation and evolving consumer preferences. The burgeoning RTD market presents a significant avenue for growth, with opportunities for novel plastic bottles and advanced metal cans designed for specific beverage profiles and consumer experiences. The increasing focus on health and wellness is also creating a niche for smaller, single-serve packaging formats, particularly for spirits and wine. Furthermore, the integration of smart packaging technologies, such as QR codes for traceability and augmented reality experiences, offers a pathway to enhance consumer engagement and brand loyalty. Opportunities also lie in developing highly sustainable packaging solutions that go beyond traditional recycling, exploring biodegradable or compostable materials for specific applications, particularly in the paper and plastic segments.
Growth Accelerators in the NA Alcoholic Drinks Packaging Market Industry
Long-term growth in the NA Alcoholic Drinks Packaging Market is being accelerated by several key factors. Technological breakthroughs in lightweighting glass bottles and high-strength metal cans are reducing material costs and environmental impact, making these options more attractive. Strategic partnerships between packaging manufacturers and alcoholic beverage producers are fostering collaborative innovation, leading to customized solutions that meet specific brand needs and consumer demands. Market expansion strategies, including targeting new geographical areas within North America and developing packaging for emerging beverage categories, are also significant growth accelerators. The continuous drive towards a circular economy and increased investment in recycling infrastructure are further bolstering the demand for sustainable packaging materials, creating a virtuous cycle of growth.
Key Players Shaping the NA Alcoholic Drinks Packaging Market Market
- Encore Glass
- United Bottles & Packaging
- WestRock LLC
- Ball Corporation
- Owens-Illinois (O-I) Inc.
- Ardagh Group SA
- Crown Holdings Incorporated
- Berry Global Inc.
- IntraPac International LL
- Brick Packaging LLC
- Amcor Ltd
Notable Milestones in NA Alcoholic Drinks Packaging Market Sector
- March 2021: Owens-Illinois (O-I), Inc., made a significant investment of approximately USD 75 million to support strong customer demand for highly sustainable glass packaging. An expansion at its Zipaquirá, Colombia facility, expected completion by the end of 2022, was projected to add nearly 2% capacity to the company's Americas segment and produce about 500 million bottles annually.
- June 2021: AB InBev developed the lightest longneck beer bottle for commercial production. The brewer reduced the weight of its standard longneck beer bottle from around 180 to 150 grams, cutting its CO2 emissions by 17% per bottle. This innovation, developed at their Global Innovation and Technology R&D Centre, GITEC, showcases a significant advancement in sustainable beer packaging while maintaining product integrity.
In-Depth NA Alcoholic Drinks Packaging Market Market Outlook
The NA Alcoholic Drinks Packaging Market outlook is exceptionally positive, driven by a robust combination of sustained consumer demand for alcoholic beverages and an accelerated shift towards sustainable and convenient packaging solutions. The RTD segment is a primary growth engine, propelling innovation in metal cans and specialized plastic bottles. Furthermore, the ongoing commitment to environmental responsibility is fostering continuous advancements in lightweighting and recyclability across all material types, particularly glass bottles and metal cans. Strategic investments in advanced manufacturing and collaborative product development between packaging suppliers and beverage brands will be critical in capitalizing on emerging market opportunities. The market is set to witness significant value creation through premiumization trends and the adoption of smart packaging technologies, enhancing both product appeal and consumer engagement.
NA Alcoholic Drinks Packaging Market Segmentation
-
1. Primary Material
- 1.1. Plastic
- 1.2. Paper
- 1.3. Metal
- 1.4. Glass
-
2. Alcoholic Products
- 2.1. Wine
- 2.2. Spirits
- 2.3. Beer
- 2.4. Ready to Drink (RTD)
- 2.5. Other Types of Alcoholic Beverages
-
3. Product Type
- 3.1. Plastic Bottles
- 3.2. Glass Bottles
- 3.3. Metal Cans
- 3.4. Cartons
- 3.5. Pouches
- 3.6. Other Product Types
NA Alcoholic Drinks Packaging Market Segmentation By Geography
-
1. North America
- 1.1. United States
- 1.2. Canada
- 1.3. Mexico
-
2. South America
- 2.1. Brazil
- 2.2. Argentina
- 2.3. Rest of South America
-
3. Europe
- 3.1. United Kingdom
- 3.2. Germany
- 3.3. France
- 3.4. Italy
- 3.5. Spain
- 3.6. Russia
- 3.7. Benelux
- 3.8. Nordics
- 3.9. Rest of Europe
-
4. Middle East & Africa
- 4.1. Turkey
- 4.2. Israel
- 4.3. GCC
- 4.4. North Africa
- 4.5. South Africa
- 4.6. Rest of Middle East & Africa
-
5. Asia Pacific
- 5.1. China
- 5.2. India
- 5.3. Japan
- 5.4. South Korea
- 5.5. ASEAN
- 5.6. Oceania
- 5.7. Rest of Asia Pacific
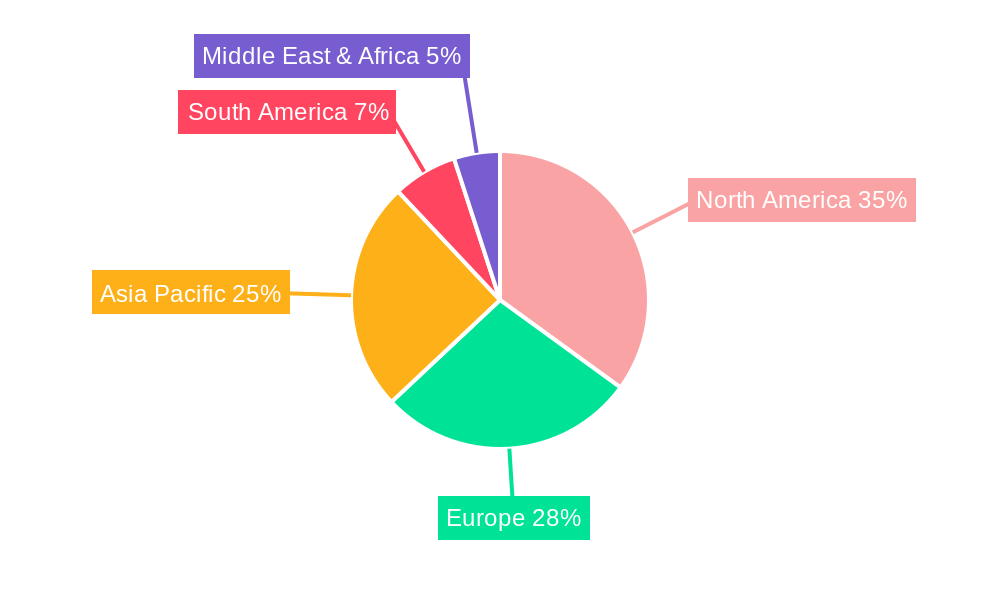
NA Alcoholic Drinks Packaging Market Regional Market Share
Geographic Coverage of NA Alcoholic Drinks Packaging Market
NA Alcoholic Drinks Packaging Market REPORT HIGHLIGHTS
| Aspects | Details |
|---|---|
| Study Period | 2020-2034 |
| Base Year | 2025 |
| Estimated Year | 2026 |
| Forecast Period | 2026-2034 |
| Historical Period | 2020-2025 |
| Growth Rate | CAGR of 5.2% from 2020-2034 |
| Segmentation |
|
Table of Contents
- 1. Introduction
- 1.1. Research Scope
- 1.2. Market Segmentation
- 1.3. Research Objective
- 1.4. Definitions and Assumptions
- 2. Executive Summary
- 2.1. Market Snapshot
- 3. Market Dynamics
- 3.1. Market Drivers
- 3.2. Market Restrains
- 3.3. Market Trends
- 3.4. Market Opportunities
- 4. Market Factor Analysis
- 4.1. Porters Five Forces
- 4.1.1. Bargaining Power of Suppliers
- 4.1.2. Bargaining Power of Buyers
- 4.1.3. Threat of New Entrants
- 4.1.4. Threat of Substitutes
- 4.1.5. Competitive Rivalry
- 4.2. PESTEL analysis
- 4.3. BCG Analysis
- 4.3.1. Stars (High Growth, High Market Share)
- 4.3.2. Cash Cows (Low Growth, High Market Share)
- 4.3.3. Question Mark (High Growth, Low Market Share)
- 4.3.4. Dogs (Low Growth, Low Market Share)
- 4.4. Ansoff Matrix Analysis
- 4.5. Supply Chain Analysis
- 4.6. Regulatory Landscape
- 4.7. Current Market Potential and Opportunity Assessment (TAM–SAM–SOM Framework)
- 4.8. NRP Analyst Note
- 4.1. Porters Five Forces
- 5. Market Analysis, Insights and Forecast 2021-2033
- 5.1. Market Analysis, Insights and Forecast - by Primary Material
- 5.1.1. Plastic
- 5.1.2. Paper
- 5.1.3. Metal
- 5.1.4. Glass
- 5.2. Market Analysis, Insights and Forecast - by Alcoholic Products
- 5.2.1. Wine
- 5.2.2. Spirits
- 5.2.3. Beer
- 5.2.4. Ready to Drink (RTD)
- 5.2.5. Other Types of Alcoholic Beverages
- 5.3. Market Analysis, Insights and Forecast - by Product Type
- 5.3.1. Plastic Bottles
- 5.3.2. Glass Bottles
- 5.3.3. Metal Cans
- 5.3.4. Cartons
- 5.3.5. Pouches
- 5.3.6. Other Product Types
- 5.4. Market Analysis, Insights and Forecast - by Region
- 5.4.1. North America
- 5.4.2. South America
- 5.4.3. Europe
- 5.4.4. Middle East & Africa
- 5.4.5. Asia Pacific
- 5.1. Market Analysis, Insights and Forecast - by Primary Material
- 6. Global NA Alcoholic Drinks Packaging Market Analysis, Insights and Forecast, 2021-2033
- 6.1. Market Analysis, Insights and Forecast - by Primary Material
- 6.1.1. Plastic
- 6.1.2. Paper
- 6.1.3. Metal
- 6.1.4. Glass
- 6.2. Market Analysis, Insights and Forecast - by Alcoholic Products
- 6.2.1. Wine
- 6.2.2. Spirits
- 6.2.3. Beer
- 6.2.4. Ready to Drink (RTD)
- 6.2.5. Other Types of Alcoholic Beverages
- 6.3. Market Analysis, Insights and Forecast - by Product Type
- 6.3.1. Plastic Bottles
- 6.3.2. Glass Bottles
- 6.3.3. Metal Cans
- 6.3.4. Cartons
- 6.3.5. Pouches
- 6.3.6. Other Product Types
- 6.1. Market Analysis, Insights and Forecast - by Primary Material
- 7. North America NA Alcoholic Drinks Packaging Market Analysis, Insights and Forecast, 2020-2032
- 7.1. Market Analysis, Insights and Forecast - by Primary Material
- 7.1.1. Plastic
- 7.1.2. Paper
- 7.1.3. Metal
- 7.1.4. Glass
- 7.2. Market Analysis, Insights and Forecast - by Alcoholic Products
- 7.2.1. Wine
- 7.2.2. Spirits
- 7.2.3. Beer
- 7.2.4. Ready to Drink (RTD)
- 7.2.5. Other Types of Alcoholic Beverages
- 7.3. Market Analysis, Insights and Forecast - by Product Type
- 7.3.1. Plastic Bottles
- 7.3.2. Glass Bottles
- 7.3.3. Metal Cans
- 7.3.4. Cartons
- 7.3.5. Pouches
- 7.3.6. Other Product Types
- 7.1. Market Analysis, Insights and Forecast - by Primary Material
- 8. South America NA Alcoholic Drinks Packaging Market Analysis, Insights and Forecast, 2020-2032
- 8.1. Market Analysis, Insights and Forecast - by Primary Material
- 8.1.1. Plastic
- 8.1.2. Paper
- 8.1.3. Metal
- 8.1.4. Glass
- 8.2. Market Analysis, Insights and Forecast - by Alcoholic Products
- 8.2.1. Wine
- 8.2.2. Spirits
- 8.2.3. Beer
- 8.2.4. Ready to Drink (RTD)
- 8.2.5. Other Types of Alcoholic Beverages
- 8.3. Market Analysis, Insights and Forecast - by Product Type
- 8.3.1. Plastic Bottles
- 8.3.2. Glass Bottles
- 8.3.3. Metal Cans
- 8.3.4. Cartons
- 8.3.5. Pouches
- 8.3.6. Other Product Types
- 8.1. Market Analysis, Insights and Forecast - by Primary Material
- 9. Europe NA Alcoholic Drinks Packaging Market Analysis, Insights and Forecast, 2020-2032
- 9.1. Market Analysis, Insights and Forecast - by Primary Material
- 9.1.1. Plastic
- 9.1.2. Paper
- 9.1.3. Metal
- 9.1.4. Glass
- 9.2. Market Analysis, Insights and Forecast - by Alcoholic Products
- 9.2.1. Wine
- 9.2.2. Spirits
- 9.2.3. Beer
- 9.2.4. Ready to Drink (RTD)
- 9.2.5. Other Types of Alcoholic Beverages
- 9.3. Market Analysis, Insights and Forecast - by Product Type
- 9.3.1. Plastic Bottles
- 9.3.2. Glass Bottles
- 9.3.3. Metal Cans
- 9.3.4. Cartons
- 9.3.5. Pouches
- 9.3.6. Other Product Types
- 9.1. Market Analysis, Insights and Forecast - by Primary Material
- 10. Middle East & Africa NA Alcoholic Drinks Packaging Market Analysis, Insights and Forecast, 2020-2032
- 10.1. Market Analysis, Insights and Forecast - by Primary Material
- 10.1.1. Plastic
- 10.1.2. Paper
- 10.1.3. Metal
- 10.1.4. Glass
- 10.2. Market Analysis, Insights and Forecast - by Alcoholic Products
- 10.2.1. Wine
- 10.2.2. Spirits
- 10.2.3. Beer
- 10.2.4. Ready to Drink (RTD)
- 10.2.5. Other Types of Alcoholic Beverages
- 10.3. Market Analysis, Insights and Forecast - by Product Type
- 10.3.1. Plastic Bottles
- 10.3.2. Glass Bottles
- 10.3.3. Metal Cans
- 10.3.4. Cartons
- 10.3.5. Pouches
- 10.3.6. Other Product Types
- 10.1. Market Analysis, Insights and Forecast - by Primary Material
- 11. Asia Pacific NA Alcoholic Drinks Packaging Market Analysis, Insights and Forecast, 2020-2032
- 11.1. Market Analysis, Insights and Forecast - by Primary Material
- 11.1.1. Plastic
- 11.1.2. Paper
- 11.1.3. Metal
- 11.1.4. Glass
- 11.2. Market Analysis, Insights and Forecast - by Alcoholic Products
- 11.2.1. Wine
- 11.2.2. Spirits
- 11.2.3. Beer
- 11.2.4. Ready to Drink (RTD)
- 11.2.5. Other Types of Alcoholic Beverages
- 11.3. Market Analysis, Insights and Forecast - by Product Type
- 11.3.1. Plastic Bottles
- 11.3.2. Glass Bottles
- 11.3.3. Metal Cans
- 11.3.4. Cartons
- 11.3.5. Pouches
- 11.3.6. Other Product Types
- 11.1. Market Analysis, Insights and Forecast - by Primary Material
- 12. Competitive Analysis
- 12.1. Company Profiles
- 12.1.1 Encore Glass
- 12.1.1.1. Company Overview
- 12.1.1.2. Products
- 12.1.1.3. Company Financials
- 12.1.1.4. SWOT Analysis
- 12.1.2 United Bottles & Packaging
- 12.1.2.1. Company Overview
- 12.1.2.2. Products
- 12.1.2.3. Company Financials
- 12.1.2.4. SWOT Analysis
- 12.1.3 WestRock LLC
- 12.1.3.1. Company Overview
- 12.1.3.2. Products
- 12.1.3.3. Company Financials
- 12.1.3.4. SWOT Analysis
- 12.1.4 Ball Corporation
- 12.1.4.1. Company Overview
- 12.1.4.2. Products
- 12.1.4.3. Company Financials
- 12.1.4.4. SWOT Analysis
- 12.1.5 Owens-Illinois (O-I) Inc
- 12.1.5.1. Company Overview
- 12.1.5.2. Products
- 12.1.5.3. Company Financials
- 12.1.5.4. SWOT Analysis
- 12.1.6 Ardagh Group SA
- 12.1.6.1. Company Overview
- 12.1.6.2. Products
- 12.1.6.3. Company Financials
- 12.1.6.4. SWOT Analysis
- 12.1.7 Crown Holdings Incorporated
- 12.1.7.1. Company Overview
- 12.1.7.2. Products
- 12.1.7.3. Company Financials
- 12.1.7.4. SWOT Analysis
- 12.1.8 Berry Global Inc
- 12.1.8.1. Company Overview
- 12.1.8.2. Products
- 12.1.8.3. Company Financials
- 12.1.8.4. SWOT Analysis
- 12.1.9 IntraPac International LL
- 12.1.9.1. Company Overview
- 12.1.9.2. Products
- 12.1.9.3. Company Financials
- 12.1.9.4. SWOT Analysis
- 12.1.10 Brick Packaging LLC
- 12.1.10.1. Company Overview
- 12.1.10.2. Products
- 12.1.10.3. Company Financials
- 12.1.10.4. SWOT Analysis
- 12.1.11 Amcor Ltd
- 12.1.11.1. Company Overview
- 12.1.11.2. Products
- 12.1.11.3. Company Financials
- 12.1.11.4. SWOT Analysis
- 12.1.1 Encore Glass
- 12.2. Market Entropy
- 12.2.1 Company's Key Areas Served
- 12.2.2 Recent Developments
- 12.3. Company Market Share Analysis 2025
- 12.3.1 Top 5 Companies Market Share Analysis
- 12.3.2 Top 3 Companies Market Share Analysis
- 12.4. List of Potential Customers
- 13. Research Methodology
List of Figures
- Figure 1: Global NA Alcoholic Drinks Packaging Market Revenue Breakdown (billion, %) by Region 2025 & 2033
- Figure 2: North America NA Alcoholic Drinks Packaging Market Revenue (billion), by Primary Material 2025 & 2033
- Figure 3: North America NA Alcoholic Drinks Packaging Market Revenue Share (%), by Primary Material 2025 & 2033
- Figure 4: North America NA Alcoholic Drinks Packaging Market Revenue (billion), by Alcoholic Products 2025 & 2033
- Figure 5: North America NA Alcoholic Drinks Packaging Market Revenue Share (%), by Alcoholic Products 2025 & 2033
- Figure 6: North America NA Alcoholic Drinks Packaging Market Revenue (billion), by Product Type 2025 & 2033
- Figure 7: North America NA Alcoholic Drinks Packaging Market Revenue Share (%), by Product Type 2025 & 2033
- Figure 8: North America NA Alcoholic Drinks Packaging Market Revenue (billion), by Country 2025 & 2033
- Figure 9: North America NA Alcoholic Drinks Packaging Market Revenue Share (%), by Country 2025 & 2033
- Figure 10: South America NA Alcoholic Drinks Packaging Market Revenue (billion), by Primary Material 2025 & 2033
- Figure 11: South America NA Alcoholic Drinks Packaging Market Revenue Share (%), by Primary Material 2025 & 2033
- Figure 12: South America NA Alcoholic Drinks Packaging Market Revenue (billion), by Alcoholic Products 2025 & 2033
- Figure 13: South America NA Alcoholic Drinks Packaging Market Revenue Share (%), by Alcoholic Products 2025 & 2033
- Figure 14: South America NA Alcoholic Drinks Packaging Market Revenue (billion), by Product Type 2025 & 2033
- Figure 15: South America NA Alcoholic Drinks Packaging Market Revenue Share (%), by Product Type 2025 & 2033
- Figure 16: South America NA Alcoholic Drinks Packaging Market Revenue (billion), by Country 2025 & 2033
- Figure 17: South America NA Alcoholic Drinks Packaging Market Revenue Share (%), by Country 2025 & 2033
- Figure 18: Europe NA Alcoholic Drinks Packaging Market Revenue (billion), by Primary Material 2025 & 2033
- Figure 19: Europe NA Alcoholic Drinks Packaging Market Revenue Share (%), by Primary Material 2025 & 2033
- Figure 20: Europe NA Alcoholic Drinks Packaging Market Revenue (billion), by Alcoholic Products 2025 & 2033
- Figure 21: Europe NA Alcoholic Drinks Packaging Market Revenue Share (%), by Alcoholic Products 2025 & 2033
- Figure 22: Europe NA Alcoholic Drinks Packaging Market Revenue (billion), by Product Type 2025 & 2033
- Figure 23: Europe NA Alcoholic Drinks Packaging Market Revenue Share (%), by Product Type 2025 & 2033
- Figure 24: Europe NA Alcoholic Drinks Packaging Market Revenue (billion), by Country 2025 & 2033
- Figure 25: Europe NA Alcoholic Drinks Packaging Market Revenue Share (%), by Country 2025 & 2033
- Figure 26: Middle East & Africa NA Alcoholic Drinks Packaging Market Revenue (billion), by Primary Material 2025 & 2033
- Figure 27: Middle East & Africa NA Alcoholic Drinks Packaging Market Revenue Share (%), by Primary Material 2025 & 2033
- Figure 28: Middle East & Africa NA Alcoholic Drinks Packaging Market Revenue (billion), by Alcoholic Products 2025 & 2033
- Figure 29: Middle East & Africa NA Alcoholic Drinks Packaging Market Revenue Share (%), by Alcoholic Products 2025 & 2033
- Figure 30: Middle East & Africa NA Alcoholic Drinks Packaging Market Revenue (billion), by Product Type 2025 & 2033
- Figure 31: Middle East & Africa NA Alcoholic Drinks Packaging Market Revenue Share (%), by Product Type 2025 & 2033
- Figure 32: Middle East & Africa NA Alcoholic Drinks Packaging Market Revenue (billion), by Country 2025 & 2033
- Figure 33: Middle East & Africa NA Alcoholic Drinks Packaging Market Revenue Share (%), by Country 2025 & 2033
- Figure 34: Asia Pacific NA Alcoholic Drinks Packaging Market Revenue (billion), by Primary Material 2025 & 2033
- Figure 35: Asia Pacific NA Alcoholic Drinks Packaging Market Revenue Share (%), by Primary Material 2025 & 2033
- Figure 36: Asia Pacific NA Alcoholic Drinks Packaging Market Revenue (billion), by Alcoholic Products 2025 & 2033
- Figure 37: Asia Pacific NA Alcoholic Drinks Packaging Market Revenue Share (%), by Alcoholic Products 2025 & 2033
- Figure 38: Asia Pacific NA Alcoholic Drinks Packaging Market Revenue (billion), by Product Type 2025 & 2033
- Figure 39: Asia Pacific NA Alcoholic Drinks Packaging Market Revenue Share (%), by Product Type 2025 & 2033
- Figure 40: Asia Pacific NA Alcoholic Drinks Packaging Market Revenue (billion), by Country 2025 & 2033
- Figure 41: Asia Pacific NA Alcoholic Drinks Packaging Market Revenue Share (%), by Country 2025 & 2033
List of Tables
- Table 1: Global NA Alcoholic Drinks Packaging Market Revenue billion Forecast, by Primary Material 2020 & 2033
- Table 2: Global NA Alcoholic Drinks Packaging Market Revenue billion Forecast, by Alcoholic Products 2020 & 2033
- Table 3: Global NA Alcoholic Drinks Packaging Market Revenue billion Forecast, by Product Type 2020 & 2033
- Table 4: Global NA Alcoholic Drinks Packaging Market Revenue billion Forecast, by Region 2020 & 2033
- Table 5: Global NA Alcoholic Drinks Packaging Market Revenue billion Forecast, by Primary Material 2020 & 2033
- Table 6: Global NA Alcoholic Drinks Packaging Market Revenue billion Forecast, by Alcoholic Products 2020 & 2033
- Table 7: Global NA Alcoholic Drinks Packaging Market Revenue billion Forecast, by Product Type 2020 & 2033
- Table 8: Global NA Alcoholic Drinks Packaging Market Revenue billion Forecast, by Country 2020 & 2033
- Table 9: United States NA Alcoholic Drinks Packaging Market Revenue (billion) Forecast, by Application 2020 & 2033
- Table 10: Canada NA Alcoholic Drinks Packaging Market Revenue (billion) Forecast, by Application 2020 & 2033
- Table 11: Mexico NA Alcoholic Drinks Packaging Market Revenue (billion) Forecast, by Application 2020 & 2033
- Table 12: Global NA Alcoholic Drinks Packaging Market Revenue billion Forecast, by Primary Material 2020 & 2033
- Table 13: Global NA Alcoholic Drinks Packaging Market Revenue billion Forecast, by Alcoholic Products 2020 & 2033
- Table 14: Global NA Alcoholic Drinks Packaging Market Revenue billion Forecast, by Product Type 2020 & 2033
- Table 15: Global NA Alcoholic Drinks Packaging Market Revenue billion Forecast, by Country 2020 & 2033
- Table 16: Brazil NA Alcoholic Drinks Packaging Market Revenue (billion) Forecast, by Application 2020 & 2033
- Table 17: Argentina NA Alcoholic Drinks Packaging Market Revenue (billion) Forecast, by Application 2020 & 2033
- Table 18: Rest of South America NA Alcoholic Drinks Packaging Market Revenue (billion) Forecast, by Application 2020 & 2033
- Table 19: Global NA Alcoholic Drinks Packaging Market Revenue billion Forecast, by Primary Material 2020 & 2033
- Table 20: Global NA Alcoholic Drinks Packaging Market Revenue billion Forecast, by Alcoholic Products 2020 & 2033
- Table 21: Global NA Alcoholic Drinks Packaging Market Revenue billion Forecast, by Product Type 2020 & 2033
- Table 22: Global NA Alcoholic Drinks Packaging Market Revenue billion Forecast, by Country 2020 & 2033
- Table 23: United Kingdom NA Alcoholic Drinks Packaging Market Revenue (billion) Forecast, by Application 2020 & 2033
- Table 24: Germany NA Alcoholic Drinks Packaging Market Revenue (billion) Forecast, by Application 2020 & 2033
- Table 25: France NA Alcoholic Drinks Packaging Market Revenue (billion) Forecast, by Application 2020 & 2033
- Table 26: Italy NA Alcoholic Drinks Packaging Market Revenue (billion) Forecast, by Application 2020 & 2033
- Table 27: Spain NA Alcoholic Drinks Packaging Market Revenue (billion) Forecast, by Application 2020 & 2033
- Table 28: Russia NA Alcoholic Drinks Packaging Market Revenue (billion) Forecast, by Application 2020 & 2033
- Table 29: Benelux NA Alcoholic Drinks Packaging Market Revenue (billion) Forecast, by Application 2020 & 2033
- Table 30: Nordics NA Alcoholic Drinks Packaging Market Revenue (billion) Forecast, by Application 2020 & 2033
- Table 31: Rest of Europe NA Alcoholic Drinks Packaging Market Revenue (billion) Forecast, by Application 2020 & 2033
- Table 32: Global NA Alcoholic Drinks Packaging Market Revenue billion Forecast, by Primary Material 2020 & 2033
- Table 33: Global NA Alcoholic Drinks Packaging Market Revenue billion Forecast, by Alcoholic Products 2020 & 2033
- Table 34: Global NA Alcoholic Drinks Packaging Market Revenue billion Forecast, by Product Type 2020 & 2033
- Table 35: Global NA Alcoholic Drinks Packaging Market Revenue billion Forecast, by Country 2020 & 2033
- Table 36: Turkey NA Alcoholic Drinks Packaging Market Revenue (billion) Forecast, by Application 2020 & 2033
- Table 37: Israel NA Alcoholic Drinks Packaging Market Revenue (billion) Forecast, by Application 2020 & 2033
- Table 38: GCC NA Alcoholic Drinks Packaging Market Revenue (billion) Forecast, by Application 2020 & 2033
- Table 39: North Africa NA Alcoholic Drinks Packaging Market Revenue (billion) Forecast, by Application 2020 & 2033
- Table 40: South Africa NA Alcoholic Drinks Packaging Market Revenue (billion) Forecast, by Application 2020 & 2033
- Table 41: Rest of Middle East & Africa NA Alcoholic Drinks Packaging Market Revenue (billion) Forecast, by Application 2020 & 2033
- Table 42: Global NA Alcoholic Drinks Packaging Market Revenue billion Forecast, by Primary Material 2020 & 2033
- Table 43: Global NA Alcoholic Drinks Packaging Market Revenue billion Forecast, by Alcoholic Products 2020 & 2033
- Table 44: Global NA Alcoholic Drinks Packaging Market Revenue billion Forecast, by Product Type 2020 & 2033
- Table 45: Global NA Alcoholic Drinks Packaging Market Revenue billion Forecast, by Country 2020 & 2033
- Table 46: China NA Alcoholic Drinks Packaging Market Revenue (billion) Forecast, by Application 2020 & 2033
- Table 47: India NA Alcoholic Drinks Packaging Market Revenue (billion) Forecast, by Application 2020 & 2033
- Table 48: Japan NA Alcoholic Drinks Packaging Market Revenue (billion) Forecast, by Application 2020 & 2033
- Table 49: South Korea NA Alcoholic Drinks Packaging Market Revenue (billion) Forecast, by Application 2020 & 2033
- Table 50: ASEAN NA Alcoholic Drinks Packaging Market Revenue (billion) Forecast, by Application 2020 & 2033
- Table 51: Oceania NA Alcoholic Drinks Packaging Market Revenue (billion) Forecast, by Application 2020 & 2033
- Table 52: Rest of Asia Pacific NA Alcoholic Drinks Packaging Market Revenue (billion) Forecast, by Application 2020 & 2033
Frequently Asked Questions
1. What is the projected Compound Annual Growth Rate (CAGR) of the NA Alcoholic Drinks Packaging Market?
The projected CAGR is approximately 5.2%.
2. Which companies are prominent players in the NA Alcoholic Drinks Packaging Market?
Key companies in the market include Encore Glass, United Bottles & Packaging, WestRock LLC, Ball Corporation, Owens-Illinois (O-I) Inc, Ardagh Group SA, Crown Holdings Incorporated, Berry Global Inc, IntraPac International LL, Brick Packaging LLC, Amcor Ltd.
3. What are the main segments of the NA Alcoholic Drinks Packaging Market?
The market segments include Primary Material, Alcoholic Products, Product Type.
4. Can you provide details about the market size?
The market size is estimated to be USD 157.28 billion as of 2022.
5. What are some drivers contributing to market growth?
High Purchasing Power of Consumers; Increasing Consumption of Alcoholic Drinks.
6. What are the notable trends driving market growth?
Wine Consumption is expected to Grow Significantly.
7. Are there any restraints impacting market growth?
Stringent Government Regulations Regarding Environmental Safety; Lack Of Improvement In Technology To Hinder The Growth.
8. Can you provide examples of recent developments in the market?
March 2021 - Owens-Illinois (O-I), Inc., made a significant investment to support strong customer demand for highly sustainable glass packaging. O-I will invest approximately USD 75 million in an expansion at its Zipaquirá, Colombia facility. Upon completion by the end of 2022, the project is expected to add nearly 2% capacity to the company's Americas segment and produce about 500 million bottles annually.
9. What pricing options are available for accessing the report?
Pricing options include single-user, multi-user, and enterprise licenses priced at USD 4750, USD 4950, and USD 6800 respectively.
10. Is the market size provided in terms of value or volume?
The market size is provided in terms of value, measured in billion.
11. Are there any specific market keywords associated with the report?
Yes, the market keyword associated with the report is "NA Alcoholic Drinks Packaging Market," which aids in identifying and referencing the specific market segment covered.
12. How do I determine which pricing option suits my needs best?
The pricing options vary based on user requirements and access needs. Individual users may opt for single-user licenses, while businesses requiring broader access may choose multi-user or enterprise licenses for cost-effective access to the report.
13. Are there any additional resources or data provided in the NA Alcoholic Drinks Packaging Market report?
While the report offers comprehensive insights, it's advisable to review the specific contents or supplementary materials provided to ascertain if additional resources or data are available.
14. How can I stay updated on further developments or reports in the NA Alcoholic Drinks Packaging Market?
To stay informed about further developments, trends, and reports in the NA Alcoholic Drinks Packaging Market, consider subscribing to industry newsletters, following relevant companies and organizations, or regularly checking reputable industry news sources and publications.
Methodology
Step 1 - Identification of Relevant Samples Size from Population Database


Step 2 - Approaches for Defining Global Market Size (Value, Volume* & Price*)

Note*: In applicable scenarios
Step 3 - Data Sources
Primary Research
- Web Analytics
- Survey Reports
- Research Institute
- Latest Research Reports
- Opinion Leaders
Secondary Research
- Annual Reports
- White Paper
- Latest Press Release
- Industry Association
- Paid Database
- Investor Presentations

Step 4 - Data Triangulation
Involves using different sources of information in order to increase the validity of a study
These sources are likely to be stakeholders in a program - participants, other researchers, program staff, other community members, and so on.
Then we put all data in single framework & apply various statistical tools to find out the dynamic on the market.
During the analysis stage, feedback from the stakeholder groups would be compared to determine areas of agreement as well as areas of divergence