

Key Insights
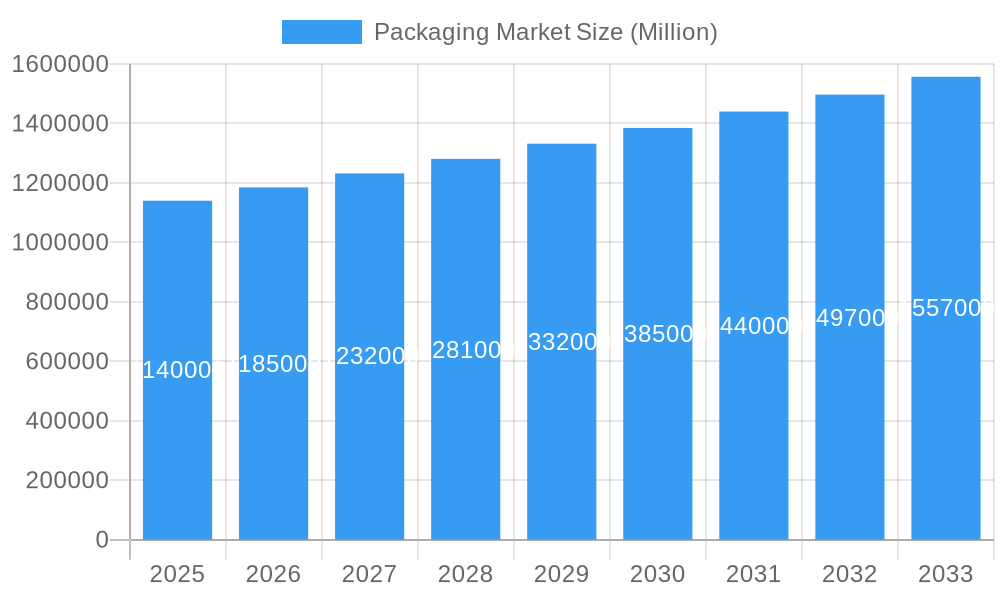
The global packaging market, valued at $1.14 trillion in 2025, is projected to experience robust growth, driven by a compound annual growth rate (CAGR) of 3.89% from 2025 to 2033. This expansion is fueled by several key factors. The e-commerce boom necessitates increased packaging for efficient and safe product delivery, stimulating demand across various packaging types. Furthermore, the growing focus on sustainability is driving innovation in eco-friendly packaging solutions, such as biodegradable and recyclable materials. This trend is influenced by stringent government regulations and increasing consumer awareness of environmental issues. Simultaneously, the food and beverage industry's continuous expansion, along with the rising demand for convenient and tamper-evident packaging, contributes significantly to market growth. The increasing adoption of advanced packaging technologies, including smart packaging and active packaging, further fuels market expansion. Competitive landscape analysis reveals key players such as International Paper, Mondi Group, and Smurfit Kappa are investing heavily in R&D and strategic acquisitions to maintain market leadership and capitalize on emerging opportunities.
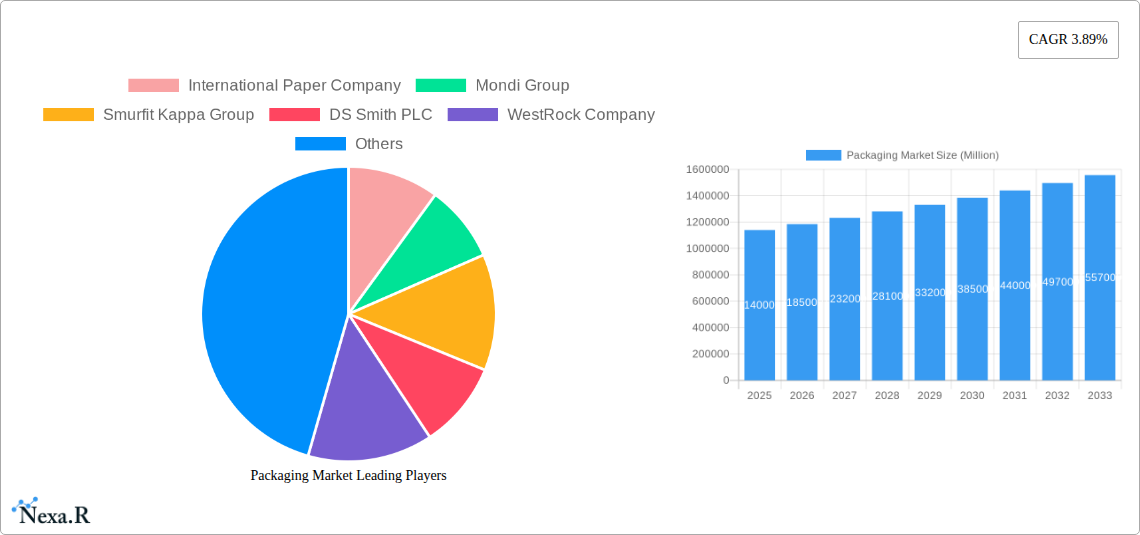
Packaging Market Market Size (In Million)
However, challenges remain. Fluctuations in raw material prices, particularly for plastics and paper, pose a significant threat to profitability. Furthermore, the complexity of managing global supply chains and adapting to fluctuating regional regulations can hinder market growth. Despite these challenges, the long-term outlook for the packaging market remains positive, with continued growth expected across diverse segments, including food and beverage, pharmaceuticals, and consumer goods. Market segmentation analysis reveals significant growth potential within sustainable packaging solutions, creating opportunities for companies focusing on environmentally responsible practices. Geographical variations in growth rates are anticipated, with developing economies experiencing faster growth due to rising disposable incomes and expanding consumer bases. This necessitates a regionally targeted approach for packaging companies aiming for market penetration and sustainable growth.
Packaging Market Company Market Share
Packaging Market: A Comprehensive Market Report (2019-2033)
This in-depth report provides a comprehensive analysis of the Packaging Market, encompassing market dynamics, growth trends, regional dominance, product landscape, key players, and future outlook. The report covers the period 2019-2033, with 2025 as the base year. The study includes detailed analysis of parent and child markets, delivering valuable insights for industry professionals, investors, and strategic decision-makers. The market size is projected to reach xx Million units by 2033.
Packaging Market Market Dynamics & Structure
The global packaging market is characterized by moderate concentration, with a few major players holding significant market share. However, the market also exhibits a fragmented landscape, particularly within niche segments and regional markets. Technological innovation, driven by factors like sustainability concerns and e-commerce growth, is a key market driver. Stringent regulatory frameworks concerning material usage and waste management are shaping packaging design and production. The rise of sustainable packaging solutions (e.g., biodegradable materials, recycled content) presents both opportunities and challenges. Competitive pressure from substitute materials and packaging types is also significant.
- Market Concentration: The top 5 players hold an estimated xx% market share in 2025.
- Technological Innovation: Focus on automation, lightweighting, and sustainable materials is driving innovation. Barriers include high R&D costs and regulatory compliance.
- Regulatory Frameworks: Growing emphasis on waste reduction and recyclability is influencing packaging design globally. Regional variations in regulations create complexity.
- M&A Activity: The packaging sector witnesses significant M&A activity, driven by consolidation, expansion into new markets, and acquisition of specialized technologies. Deal volume averaged xx deals annually during 2019-2024.
Packaging Market Growth Trends & Insights
The Packaging Market exhibits robust growth, driven by factors such as the expanding global population, rising disposable incomes, and the booming e-commerce sector. The market is witnessing a shift towards sustainable and eco-friendly packaging solutions, driven by increasing environmental awareness among consumers and stricter regulations. Technological advancements in packaging materials and printing techniques are also boosting market growth. The adoption rate of sustainable packaging solutions is increasing steadily, though penetration still varies across regions and product segments. The market is expected to experience a CAGR of xx% during the forecast period (2025-2033).
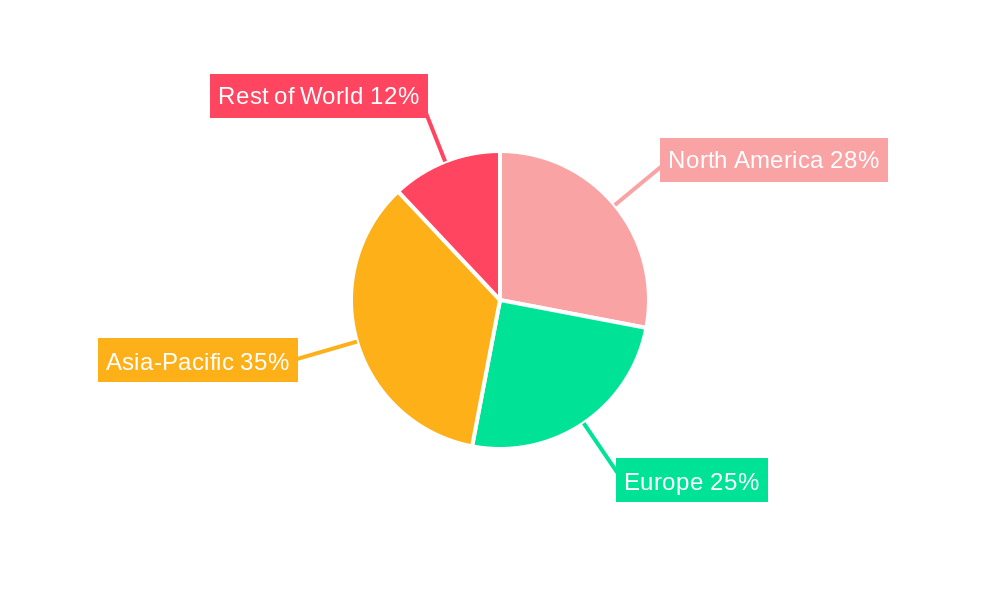
Dominant Regions, Countries, or Segments in Packaging Market
North America and Europe currently dominate the global Packaging Market, primarily driven by high consumer spending, robust industrial activity, and stringent environmental regulations. However, Asia-Pacific is poised for significant growth, fueled by rapidly expanding economies, rising urbanization, and increasing demand from various end-use sectors. The flexible packaging segment holds a significant market share due to its versatility and cost-effectiveness.
- North America: High per capita consumption, advanced packaging technologies, and established supply chains contribute to its dominance.
- Europe: Stringent environmental regulations are driving the adoption of sustainable packaging, fueling market growth.
- Asia-Pacific: Rapid economic growth, urbanization, and rising disposable incomes are key growth drivers.
- Market Share: North America holds approximately xx% of the market share in 2025, followed by Europe with xx% and Asia-Pacific with xx%.
Packaging Market Product Landscape
The packaging market offers a diverse range of products, including flexible packaging (films, pouches, bags), rigid packaging (bottles, cans, cartons), and protective packaging (foam, bubble wrap). Recent innovations include active and intelligent packaging, incorporating features like modified atmosphere packaging (MAP) and temperature indicators. These advancements enhance product shelf life, improve supply chain efficiency, and provide consumers with valuable information. The focus on sustainability has led to increased use of biodegradable, compostable, and recycled materials. Unique selling propositions often center around enhanced barrier properties, improved sustainability, and cost-effectiveness.
Key Drivers, Barriers & Challenges in Packaging Market
Key Drivers: The rising e-commerce sector, growing demand for convenient and ready-to-eat food products, and increased consumer awareness of product safety and freshness are major drivers. Technological advancements in packaging materials and machinery are boosting efficiency and reducing costs. Favorable government policies promoting sustainable packaging are also playing a significant role.
Key Challenges: Fluctuations in raw material prices, supply chain disruptions, and stringent environmental regulations pose significant challenges. Competition from substitute materials and the need to balance cost with sustainability are also crucial factors. The increasing complexity of regulations across different regions further adds to the challenge.
Emerging Opportunities in Packaging Market
Emerging opportunities lie in the development and adoption of eco-friendly and sustainable packaging solutions. The growing demand for customized packaging, particularly in the e-commerce sector, creates opportunities for innovation. Untapped markets in developing economies present significant growth potential. The integration of smart packaging technologies (e.g., RFID) for enhanced traceability and anti-counterfeiting measures is another area of significant opportunity.
Growth Accelerators in the Packaging Market Industry
Several factors are accelerating growth, including advancements in barrier technology (improving shelf-life), the development of lightweight packaging (reducing transportation costs), and the increasing demand for customized and personalized packaging. Strategic partnerships between packaging manufacturers and brand owners are fostering innovation and enhancing supply chain efficiency. Expansion into emerging markets and diversification into new product segments are further fueling growth.
Key Players Shaping the Packaging Market Market
- International Paper Company
- Mondi Group
- Smurfit Kappa Group
- DS Smith PLC
- WestRock Company
- UFlex Limited
- Huhtamaki Oyj
- Amcor plc
- Coveris Holding SA
- Sealed Air Corporation
- Greif Inc
- Sonoco Products Company
- Aptar Group Inc
- Berry Global Group Inc
- Alpla Group
- Owens-Illinois Inc
- Vidrala S A
- Verallia SA
- Gerresheimer AG
- Vitro S A B De C V
- Ball Corporation
- Crown Holdings Inc
- Ardagh Group S A
- Can Pack SA
- Silgan Holdings Inc
Notable Milestones in Packaging Market Sector
- June 2024: Sonoco Products Company's acquisition of Eviosys significantly expands its presence in the European food can market.
- May 2024: Mondi's investment in a recycled containerboard machine in Italy demonstrates a commitment to sustainable packaging solutions.
- April 2024: The UK's launch of CiPPPA highlights the growing focus on pharmaceutical packaging recycling.
- April 2024: Berry Global Group's capacity expansion underscores the increasing demand for healthcare packaging solutions.
In-Depth Packaging Market Market Outlook
The Packaging Market is poised for continued growth, driven by technological advancements, sustainable initiatives, and expanding end-use sectors. Strategic partnerships, focus on innovation, and market expansion into developing economies will further drive market expansion. The shift towards sustainable and eco-friendly solutions will continue to shape the industry, creating opportunities for companies that can effectively meet this growing demand. The potential for further consolidation through mergers and acquisitions remains significant.
Packaging Market Segmentation
- 1. Production Analysis
- 2. Consumption Analysis
- 3. Import Market Analysis (Value & Volume)
- 4. Export Market Analysis (Value & Volume)
- 5. Price Trend Analysis
Packaging Market Segmentation By Geography
-
1. North America
- 1.1. United States
- 1.2. Canada
- 1.3. Mexico
-
2. South America
- 2.1. Brazil
- 2.2. Argentina
- 2.3. Rest of South America
-
3. Europe
- 3.1. United Kingdom
- 3.2. Germany
- 3.3. France
- 3.4. Italy
- 3.5. Spain
- 3.6. Russia
- 3.7. Benelux
- 3.8. Nordics
- 3.9. Rest of Europe
-
4. Middle East & Africa
- 4.1. Turkey
- 4.2. Israel
- 4.3. GCC
- 4.4. North Africa
- 4.5. South Africa
- 4.6. Rest of Middle East & Africa
-
5. Asia Pacific
- 5.1. China
- 5.2. India
- 5.3. Japan
- 5.4. South Korea
- 5.5. ASEAN
- 5.6. Oceania
- 5.7. Rest of Asia Pacific
Packaging Market Regional Market Share
Geographic Coverage of Packaging Market
Packaging Market REPORT HIGHLIGHTS
| Aspects | Details |
|---|---|
| Study Period | 2020-2034 |
| Base Year | 2025 |
| Estimated Year | 2026 |
| Forecast Period | 2026-2034 |
| Historical Period | 2020-2025 |
| Growth Rate | CAGR of 3.89% from 2020-2034 |
| Segmentation |
|
Table of Contents
- 1. Introduction
- 1.1. Research Scope
- 1.2. Market Segmentation
- 1.3. Research Objective
- 1.4. Definitions and Assumptions
- 2. Executive Summary
- 2.1. Market Snapshot
- 3. Market Dynamics
- 3.1. Market Drivers
- 3.2. Market Restrains
- 3.3. Market Trends
- 3.4. Market Opportunities
- 4. Market Factor Analysis
- 4.1. Porters Five Forces
- 4.1.1. Bargaining Power of Suppliers
- 4.1.2. Bargaining Power of Buyers
- 4.1.3. Threat of New Entrants
- 4.1.4. Threat of Substitutes
- 4.1.5. Competitive Rivalry
- 4.2. PESTEL analysis
- 4.3. BCG Analysis
- 4.3.1. Stars (High Growth, High Market Share)
- 4.3.2. Cash Cows (Low Growth, High Market Share)
- 4.3.3. Question Mark (High Growth, Low Market Share)
- 4.3.4. Dogs (Low Growth, Low Market Share)
- 4.4. Ansoff Matrix Analysis
- 4.5. Supply Chain Analysis
- 4.6. Regulatory Landscape
- 4.7. Current Market Potential and Opportunity Assessment (TAM–SAM–SOM Framework)
- 4.8. NRP Analyst Note
- 4.1. Porters Five Forces
- 5. Market Analysis, Insights and Forecast 2021-2033
- 5.1. Market Analysis, Insights and Forecast - by Production Analysis
- 5.2. Market Analysis, Insights and Forecast - by Consumption Analysis
- 5.3. Market Analysis, Insights and Forecast - by Import Market Analysis (Value & Volume)
- 5.4. Market Analysis, Insights and Forecast - by Export Market Analysis (Value & Volume)
- 5.5. Market Analysis, Insights and Forecast - by Price Trend Analysis
- 5.6. Market Analysis, Insights and Forecast - by Region
- 5.6.1. North America
- 5.6.2. South America
- 5.6.3. Europe
- 5.6.4. Middle East & Africa
- 5.6.5. Asia Pacific
- 6. Global Packaging Market Analysis, Insights and Forecast, 2021-2033
- 6.1. Market Analysis, Insights and Forecast - by Production Analysis
- 6.2. Market Analysis, Insights and Forecast - by Consumption Analysis
- 6.3. Market Analysis, Insights and Forecast - by Import Market Analysis (Value & Volume)
- 6.4. Market Analysis, Insights and Forecast - by Export Market Analysis (Value & Volume)
- 6.5. Market Analysis, Insights and Forecast - by Price Trend Analysis
- 7. North America Packaging Market Analysis, Insights and Forecast, 2020-2032
- 7.1. Market Analysis, Insights and Forecast - by Production Analysis
- 7.2. Market Analysis, Insights and Forecast - by Consumption Analysis
- 7.3. Market Analysis, Insights and Forecast - by Import Market Analysis (Value & Volume)
- 7.4. Market Analysis, Insights and Forecast - by Export Market Analysis (Value & Volume)
- 7.5. Market Analysis, Insights and Forecast - by Price Trend Analysis
- 8. South America Packaging Market Analysis, Insights and Forecast, 2020-2032
- 8.1. Market Analysis, Insights and Forecast - by Production Analysis
- 8.2. Market Analysis, Insights and Forecast - by Consumption Analysis
- 8.3. Market Analysis, Insights and Forecast - by Import Market Analysis (Value & Volume)
- 8.4. Market Analysis, Insights and Forecast - by Export Market Analysis (Value & Volume)
- 8.5. Market Analysis, Insights and Forecast - by Price Trend Analysis
- 9. Europe Packaging Market Analysis, Insights and Forecast, 2020-2032
- 9.1. Market Analysis, Insights and Forecast - by Production Analysis
- 9.2. Market Analysis, Insights and Forecast - by Consumption Analysis
- 9.3. Market Analysis, Insights and Forecast - by Import Market Analysis (Value & Volume)
- 9.4. Market Analysis, Insights and Forecast - by Export Market Analysis (Value & Volume)
- 9.5. Market Analysis, Insights and Forecast - by Price Trend Analysis
- 10. Middle East & Africa Packaging Market Analysis, Insights and Forecast, 2020-2032
- 10.1. Market Analysis, Insights and Forecast - by Production Analysis
- 10.2. Market Analysis, Insights and Forecast - by Consumption Analysis
- 10.3. Market Analysis, Insights and Forecast - by Import Market Analysis (Value & Volume)
- 10.4. Market Analysis, Insights and Forecast - by Export Market Analysis (Value & Volume)
- 10.5. Market Analysis, Insights and Forecast - by Price Trend Analysis
- 11. Asia Pacific Packaging Market Analysis, Insights and Forecast, 2020-2032
- 11.1. Market Analysis, Insights and Forecast - by Production Analysis
- 11.2. Market Analysis, Insights and Forecast - by Consumption Analysis
- 11.3. Market Analysis, Insights and Forecast - by Import Market Analysis (Value & Volume)
- 11.4. Market Analysis, Insights and Forecast - by Export Market Analysis (Value & Volume)
- 11.5. Market Analysis, Insights and Forecast - by Price Trend Analysis
- 12. Competitive Analysis
- 12.1. Company Profiles
- 12.1.1 International Paper Company
- 12.1.1.1. Company Overview
- 12.1.1.2. Products
- 12.1.1.3. Company Financials
- 12.1.1.4. SWOT Analysis
- 12.1.2 Mondi Group
- 12.1.2.1. Company Overview
- 12.1.2.2. Products
- 12.1.2.3. Company Financials
- 12.1.2.4. SWOT Analysis
- 12.1.3 Smurfit Kappa Group
- 12.1.3.1. Company Overview
- 12.1.3.2. Products
- 12.1.3.3. Company Financials
- 12.1.3.4. SWOT Analysis
- 12.1.4 DS Smith PLC
- 12.1.4.1. Company Overview
- 12.1.4.2. Products
- 12.1.4.3. Company Financials
- 12.1.4.4. SWOT Analysis
- 12.1.5 WestRock Company
- 12.1.5.1. Company Overview
- 12.1.5.2. Products
- 12.1.5.3. Company Financials
- 12.1.5.4. SWOT Analysis
- 12.1.6 UFlex Limited
- 12.1.6.1. Company Overview
- 12.1.6.2. Products
- 12.1.6.3. Company Financials
- 12.1.6.4. SWOT Analysis
- 12.1.7 Huhtamaki Oyj
- 12.1.7.1. Company Overview
- 12.1.7.2. Products
- 12.1.7.3. Company Financials
- 12.1.7.4. SWOT Analysis
- 12.1.8 Amcor Group GmbH
- 12.1.8.1. Company Overview
- 12.1.8.2. Products
- 12.1.8.3. Company Financials
- 12.1.8.4. SWOT Analysis
- 12.1.9 Coveris Holding SA
- 12.1.9.1. Company Overview
- 12.1.9.2. Products
- 12.1.9.3. Company Financials
- 12.1.9.4. SWOT Analysis
- 12.1.10 Sealed Air Corporation
- 12.1.10.1. Company Overview
- 12.1.10.2. Products
- 12.1.10.3. Company Financials
- 12.1.10.4. SWOT Analysis
- 12.1.11 Greif Inc
- 12.1.11.1. Company Overview
- 12.1.11.2. Products
- 12.1.11.3. Company Financials
- 12.1.11.4. SWOT Analysis
- 12.1.12 Sonoco Products Company
- 12.1.12.1. Company Overview
- 12.1.12.2. Products
- 12.1.12.3. Company Financials
- 12.1.12.4. SWOT Analysis
- 12.1.13 Aptar Group Inc
- 12.1.13.1. Company Overview
- 12.1.13.2. Products
- 12.1.13.3. Company Financials
- 12.1.13.4. SWOT Analysis
- 12.1.14 Berry Global Group Inc
- 12.1.14.1. Company Overview
- 12.1.14.2. Products
- 12.1.14.3. Company Financials
- 12.1.14.4. SWOT Analysis
- 12.1.15 Alpla Group
- 12.1.15.1. Company Overview
- 12.1.15.2. Products
- 12.1.15.3. Company Financials
- 12.1.15.4. SWOT Analysis
- 12.1.16 Owens-illinois Inc
- 12.1.16.1. Company Overview
- 12.1.16.2. Products
- 12.1.16.3. Company Financials
- 12.1.16.4. SWOT Analysis
- 12.1.17 Vidrala S A
- 12.1.17.1. Company Overview
- 12.1.17.2. Products
- 12.1.17.3. Company Financials
- 12.1.17.4. SWOT Analysis
- 12.1.18 Verallia SA
- 12.1.18.1. Company Overview
- 12.1.18.2. Products
- 12.1.18.3. Company Financials
- 12.1.18.4. SWOT Analysis
- 12.1.19 Gerresheimer AG
- 12.1.19.1. Company Overview
- 12.1.19.2. Products
- 12.1.19.3. Company Financials
- 12.1.19.4. SWOT Analysis
- 12.1.20 Vitro S A B De C V
- 12.1.20.1. Company Overview
- 12.1.20.2. Products
- 12.1.20.3. Company Financials
- 12.1.20.4. SWOT Analysis
- 12.1.21 Ball Corporation
- 12.1.21.1. Company Overview
- 12.1.21.2. Products
- 12.1.21.3. Company Financials
- 12.1.21.4. SWOT Analysis
- 12.1.22 Crown Holdings Inc
- 12.1.22.1. Company Overview
- 12.1.22.2. Products
- 12.1.22.3. Company Financials
- 12.1.22.4. SWOT Analysis
- 12.1.23 Ardagh Group S A
- 12.1.23.1. Company Overview
- 12.1.23.2. Products
- 12.1.23.3. Company Financials
- 12.1.23.4. SWOT Analysis
- 12.1.24 Can Pack SA
- 12.1.24.1. Company Overview
- 12.1.24.2. Products
- 12.1.24.3. Company Financials
- 12.1.24.4. SWOT Analysis
- 12.1.25 Silgan Holdings Inc
- 12.1.25.1. Company Overview
- 12.1.25.2. Products
- 12.1.25.3. Company Financials
- 12.1.25.4. SWOT Analysis
- 12.1.1 International Paper Company
- 12.2. Market Entropy
- 12.2.1 Company's Key Areas Served
- 12.2.2 Recent Developments
- 12.3. Company Market Share Analysis 2025
- 12.3.1 Top 5 Companies Market Share Analysis
- 12.3.2 Top 3 Companies Market Share Analysis
- 12.4. List of Potential Customers
- 13. Research Methodology
List of Figures
- Figure 1: Global Packaging Market Revenue Breakdown (Million, %) by Region 2025 & 2033
- Figure 2: Global Packaging Market Volume Breakdown (Trillion, %) by Region 2025 & 2033
- Figure 3: North America Packaging Market Revenue (Million), by Production Analysis 2025 & 2033
- Figure 4: North America Packaging Market Volume (Trillion), by Production Analysis 2025 & 2033
- Figure 5: North America Packaging Market Revenue Share (%), by Production Analysis 2025 & 2033
- Figure 6: North America Packaging Market Volume Share (%), by Production Analysis 2025 & 2033
- Figure 7: North America Packaging Market Revenue (Million), by Consumption Analysis 2025 & 2033
- Figure 8: North America Packaging Market Volume (Trillion), by Consumption Analysis 2025 & 2033
- Figure 9: North America Packaging Market Revenue Share (%), by Consumption Analysis 2025 & 2033
- Figure 10: North America Packaging Market Volume Share (%), by Consumption Analysis 2025 & 2033
- Figure 11: North America Packaging Market Revenue (Million), by Import Market Analysis (Value & Volume) 2025 & 2033
- Figure 12: North America Packaging Market Volume (Trillion), by Import Market Analysis (Value & Volume) 2025 & 2033
- Figure 13: North America Packaging Market Revenue Share (%), by Import Market Analysis (Value & Volume) 2025 & 2033
- Figure 14: North America Packaging Market Volume Share (%), by Import Market Analysis (Value & Volume) 2025 & 2033
- Figure 15: North America Packaging Market Revenue (Million), by Export Market Analysis (Value & Volume) 2025 & 2033
- Figure 16: North America Packaging Market Volume (Trillion), by Export Market Analysis (Value & Volume) 2025 & 2033
- Figure 17: North America Packaging Market Revenue Share (%), by Export Market Analysis (Value & Volume) 2025 & 2033
- Figure 18: North America Packaging Market Volume Share (%), by Export Market Analysis (Value & Volume) 2025 & 2033
- Figure 19: North America Packaging Market Revenue (Million), by Price Trend Analysis 2025 & 2033
- Figure 20: North America Packaging Market Volume (Trillion), by Price Trend Analysis 2025 & 2033
- Figure 21: North America Packaging Market Revenue Share (%), by Price Trend Analysis 2025 & 2033
- Figure 22: North America Packaging Market Volume Share (%), by Price Trend Analysis 2025 & 2033
- Figure 23: North America Packaging Market Revenue (Million), by Country 2025 & 2033
- Figure 24: North America Packaging Market Volume (Trillion), by Country 2025 & 2033
- Figure 25: North America Packaging Market Revenue Share (%), by Country 2025 & 2033
- Figure 26: North America Packaging Market Volume Share (%), by Country 2025 & 2033
- Figure 27: South America Packaging Market Revenue (Million), by Production Analysis 2025 & 2033
- Figure 28: South America Packaging Market Volume (Trillion), by Production Analysis 2025 & 2033
- Figure 29: South America Packaging Market Revenue Share (%), by Production Analysis 2025 & 2033
- Figure 30: South America Packaging Market Volume Share (%), by Production Analysis 2025 & 2033
- Figure 31: South America Packaging Market Revenue (Million), by Consumption Analysis 2025 & 2033
- Figure 32: South America Packaging Market Volume (Trillion), by Consumption Analysis 2025 & 2033
- Figure 33: South America Packaging Market Revenue Share (%), by Consumption Analysis 2025 & 2033
- Figure 34: South America Packaging Market Volume Share (%), by Consumption Analysis 2025 & 2033
- Figure 35: South America Packaging Market Revenue (Million), by Import Market Analysis (Value & Volume) 2025 & 2033
- Figure 36: South America Packaging Market Volume (Trillion), by Import Market Analysis (Value & Volume) 2025 & 2033
- Figure 37: South America Packaging Market Revenue Share (%), by Import Market Analysis (Value & Volume) 2025 & 2033
- Figure 38: South America Packaging Market Volume Share (%), by Import Market Analysis (Value & Volume) 2025 & 2033
- Figure 39: South America Packaging Market Revenue (Million), by Export Market Analysis (Value & Volume) 2025 & 2033
- Figure 40: South America Packaging Market Volume (Trillion), by Export Market Analysis (Value & Volume) 2025 & 2033
- Figure 41: South America Packaging Market Revenue Share (%), by Export Market Analysis (Value & Volume) 2025 & 2033
- Figure 42: South America Packaging Market Volume Share (%), by Export Market Analysis (Value & Volume) 2025 & 2033
- Figure 43: South America Packaging Market Revenue (Million), by Price Trend Analysis 2025 & 2033
- Figure 44: South America Packaging Market Volume (Trillion), by Price Trend Analysis 2025 & 2033
- Figure 45: South America Packaging Market Revenue Share (%), by Price Trend Analysis 2025 & 2033
- Figure 46: South America Packaging Market Volume Share (%), by Price Trend Analysis 2025 & 2033
- Figure 47: South America Packaging Market Revenue (Million), by Country 2025 & 2033
- Figure 48: South America Packaging Market Volume (Trillion), by Country 2025 & 2033
- Figure 49: South America Packaging Market Revenue Share (%), by Country 2025 & 2033
- Figure 50: South America Packaging Market Volume Share (%), by Country 2025 & 2033
- Figure 51: Europe Packaging Market Revenue (Million), by Production Analysis 2025 & 2033
- Figure 52: Europe Packaging Market Volume (Trillion), by Production Analysis 2025 & 2033
- Figure 53: Europe Packaging Market Revenue Share (%), by Production Analysis 2025 & 2033
- Figure 54: Europe Packaging Market Volume Share (%), by Production Analysis 2025 & 2033
- Figure 55: Europe Packaging Market Revenue (Million), by Consumption Analysis 2025 & 2033
- Figure 56: Europe Packaging Market Volume (Trillion), by Consumption Analysis 2025 & 2033
- Figure 57: Europe Packaging Market Revenue Share (%), by Consumption Analysis 2025 & 2033
- Figure 58: Europe Packaging Market Volume Share (%), by Consumption Analysis 2025 & 2033
- Figure 59: Europe Packaging Market Revenue (Million), by Import Market Analysis (Value & Volume) 2025 & 2033
- Figure 60: Europe Packaging Market Volume (Trillion), by Import Market Analysis (Value & Volume) 2025 & 2033
- Figure 61: Europe Packaging Market Revenue Share (%), by Import Market Analysis (Value & Volume) 2025 & 2033
- Figure 62: Europe Packaging Market Volume Share (%), by Import Market Analysis (Value & Volume) 2025 & 2033
- Figure 63: Europe Packaging Market Revenue (Million), by Export Market Analysis (Value & Volume) 2025 & 2033
- Figure 64: Europe Packaging Market Volume (Trillion), by Export Market Analysis (Value & Volume) 2025 & 2033
- Figure 65: Europe Packaging Market Revenue Share (%), by Export Market Analysis (Value & Volume) 2025 & 2033
- Figure 66: Europe Packaging Market Volume Share (%), by Export Market Analysis (Value & Volume) 2025 & 2033
- Figure 67: Europe Packaging Market Revenue (Million), by Price Trend Analysis 2025 & 2033
- Figure 68: Europe Packaging Market Volume (Trillion), by Price Trend Analysis 2025 & 2033
- Figure 69: Europe Packaging Market Revenue Share (%), by Price Trend Analysis 2025 & 2033
- Figure 70: Europe Packaging Market Volume Share (%), by Price Trend Analysis 2025 & 2033
- Figure 71: Europe Packaging Market Revenue (Million), by Country 2025 & 2033
- Figure 72: Europe Packaging Market Volume (Trillion), by Country 2025 & 2033
- Figure 73: Europe Packaging Market Revenue Share (%), by Country 2025 & 2033
- Figure 74: Europe Packaging Market Volume Share (%), by Country 2025 & 2033
- Figure 75: Middle East & Africa Packaging Market Revenue (Million), by Production Analysis 2025 & 2033
- Figure 76: Middle East & Africa Packaging Market Volume (Trillion), by Production Analysis 2025 & 2033
- Figure 77: Middle East & Africa Packaging Market Revenue Share (%), by Production Analysis 2025 & 2033
- Figure 78: Middle East & Africa Packaging Market Volume Share (%), by Production Analysis 2025 & 2033
- Figure 79: Middle East & Africa Packaging Market Revenue (Million), by Consumption Analysis 2025 & 2033
- Figure 80: Middle East & Africa Packaging Market Volume (Trillion), by Consumption Analysis 2025 & 2033
- Figure 81: Middle East & Africa Packaging Market Revenue Share (%), by Consumption Analysis 2025 & 2033
- Figure 82: Middle East & Africa Packaging Market Volume Share (%), by Consumption Analysis 2025 & 2033
- Figure 83: Middle East & Africa Packaging Market Revenue (Million), by Import Market Analysis (Value & Volume) 2025 & 2033
- Figure 84: Middle East & Africa Packaging Market Volume (Trillion), by Import Market Analysis (Value & Volume) 2025 & 2033
- Figure 85: Middle East & Africa Packaging Market Revenue Share (%), by Import Market Analysis (Value & Volume) 2025 & 2033
- Figure 86: Middle East & Africa Packaging Market Volume Share (%), by Import Market Analysis (Value & Volume) 2025 & 2033
- Figure 87: Middle East & Africa Packaging Market Revenue (Million), by Export Market Analysis (Value & Volume) 2025 & 2033
- Figure 88: Middle East & Africa Packaging Market Volume (Trillion), by Export Market Analysis (Value & Volume) 2025 & 2033
- Figure 89: Middle East & Africa Packaging Market Revenue Share (%), by Export Market Analysis (Value & Volume) 2025 & 2033
- Figure 90: Middle East & Africa Packaging Market Volume Share (%), by Export Market Analysis (Value & Volume) 2025 & 2033
- Figure 91: Middle East & Africa Packaging Market Revenue (Million), by Price Trend Analysis 2025 & 2033
- Figure 92: Middle East & Africa Packaging Market Volume (Trillion), by Price Trend Analysis 2025 & 2033
- Figure 93: Middle East & Africa Packaging Market Revenue Share (%), by Price Trend Analysis 2025 & 2033
- Figure 94: Middle East & Africa Packaging Market Volume Share (%), by Price Trend Analysis 2025 & 2033
- Figure 95: Middle East & Africa Packaging Market Revenue (Million), by Country 2025 & 2033
- Figure 96: Middle East & Africa Packaging Market Volume (Trillion), by Country 2025 & 2033
- Figure 97: Middle East & Africa Packaging Market Revenue Share (%), by Country 2025 & 2033
- Figure 98: Middle East & Africa Packaging Market Volume Share (%), by Country 2025 & 2033
- Figure 99: Asia Pacific Packaging Market Revenue (Million), by Production Analysis 2025 & 2033
- Figure 100: Asia Pacific Packaging Market Volume (Trillion), by Production Analysis 2025 & 2033
- Figure 101: Asia Pacific Packaging Market Revenue Share (%), by Production Analysis 2025 & 2033
- Figure 102: Asia Pacific Packaging Market Volume Share (%), by Production Analysis 2025 & 2033
- Figure 103: Asia Pacific Packaging Market Revenue (Million), by Consumption Analysis 2025 & 2033
- Figure 104: Asia Pacific Packaging Market Volume (Trillion), by Consumption Analysis 2025 & 2033
- Figure 105: Asia Pacific Packaging Market Revenue Share (%), by Consumption Analysis 2025 & 2033
- Figure 106: Asia Pacific Packaging Market Volume Share (%), by Consumption Analysis 2025 & 2033
- Figure 107: Asia Pacific Packaging Market Revenue (Million), by Import Market Analysis (Value & Volume) 2025 & 2033
- Figure 108: Asia Pacific Packaging Market Volume (Trillion), by Import Market Analysis (Value & Volume) 2025 & 2033
- Figure 109: Asia Pacific Packaging Market Revenue Share (%), by Import Market Analysis (Value & Volume) 2025 & 2033
- Figure 110: Asia Pacific Packaging Market Volume Share (%), by Import Market Analysis (Value & Volume) 2025 & 2033
- Figure 111: Asia Pacific Packaging Market Revenue (Million), by Export Market Analysis (Value & Volume) 2025 & 2033
- Figure 112: Asia Pacific Packaging Market Volume (Trillion), by Export Market Analysis (Value & Volume) 2025 & 2033
- Figure 113: Asia Pacific Packaging Market Revenue Share (%), by Export Market Analysis (Value & Volume) 2025 & 2033
- Figure 114: Asia Pacific Packaging Market Volume Share (%), by Export Market Analysis (Value & Volume) 2025 & 2033
- Figure 115: Asia Pacific Packaging Market Revenue (Million), by Price Trend Analysis 2025 & 2033
- Figure 116: Asia Pacific Packaging Market Volume (Trillion), by Price Trend Analysis 2025 & 2033
- Figure 117: Asia Pacific Packaging Market Revenue Share (%), by Price Trend Analysis 2025 & 2033
- Figure 118: Asia Pacific Packaging Market Volume Share (%), by Price Trend Analysis 2025 & 2033
- Figure 119: Asia Pacific Packaging Market Revenue (Million), by Country 2025 & 2033
- Figure 120: Asia Pacific Packaging Market Volume (Trillion), by Country 2025 & 2033
- Figure 121: Asia Pacific Packaging Market Revenue Share (%), by Country 2025 & 2033
- Figure 122: Asia Pacific Packaging Market Volume Share (%), by Country 2025 & 2033
List of Tables
- Table 1: Global Packaging Market Revenue Million Forecast, by Production Analysis 2020 & 2033
- Table 2: Global Packaging Market Volume Trillion Forecast, by Production Analysis 2020 & 2033
- Table 3: Global Packaging Market Revenue Million Forecast, by Consumption Analysis 2020 & 2033
- Table 4: Global Packaging Market Volume Trillion Forecast, by Consumption Analysis 2020 & 2033
- Table 5: Global Packaging Market Revenue Million Forecast, by Import Market Analysis (Value & Volume) 2020 & 2033
- Table 6: Global Packaging Market Volume Trillion Forecast, by Import Market Analysis (Value & Volume) 2020 & 2033
- Table 7: Global Packaging Market Revenue Million Forecast, by Export Market Analysis (Value & Volume) 2020 & 2033
- Table 8: Global Packaging Market Volume Trillion Forecast, by Export Market Analysis (Value & Volume) 2020 & 2033
- Table 9: Global Packaging Market Revenue Million Forecast, by Price Trend Analysis 2020 & 2033
- Table 10: Global Packaging Market Volume Trillion Forecast, by Price Trend Analysis 2020 & 2033
- Table 11: Global Packaging Market Revenue Million Forecast, by Region 2020 & 2033
- Table 12: Global Packaging Market Volume Trillion Forecast, by Region 2020 & 2033
- Table 13: Global Packaging Market Revenue Million Forecast, by Production Analysis 2020 & 2033
- Table 14: Global Packaging Market Volume Trillion Forecast, by Production Analysis 2020 & 2033
- Table 15: Global Packaging Market Revenue Million Forecast, by Consumption Analysis 2020 & 2033
- Table 16: Global Packaging Market Volume Trillion Forecast, by Consumption Analysis 2020 & 2033
- Table 17: Global Packaging Market Revenue Million Forecast, by Import Market Analysis (Value & Volume) 2020 & 2033
- Table 18: Global Packaging Market Volume Trillion Forecast, by Import Market Analysis (Value & Volume) 2020 & 2033
- Table 19: Global Packaging Market Revenue Million Forecast, by Export Market Analysis (Value & Volume) 2020 & 2033
- Table 20: Global Packaging Market Volume Trillion Forecast, by Export Market Analysis (Value & Volume) 2020 & 2033
- Table 21: Global Packaging Market Revenue Million Forecast, by Price Trend Analysis 2020 & 2033
- Table 22: Global Packaging Market Volume Trillion Forecast, by Price Trend Analysis 2020 & 2033
- Table 23: Global Packaging Market Revenue Million Forecast, by Country 2020 & 2033
- Table 24: Global Packaging Market Volume Trillion Forecast, by Country 2020 & 2033
- Table 25: United States Packaging Market Revenue (Million) Forecast, by Application 2020 & 2033
- Table 26: United States Packaging Market Volume (Trillion) Forecast, by Application 2020 & 2033
- Table 27: Canada Packaging Market Revenue (Million) Forecast, by Application 2020 & 2033
- Table 28: Canada Packaging Market Volume (Trillion) Forecast, by Application 2020 & 2033
- Table 29: Mexico Packaging Market Revenue (Million) Forecast, by Application 2020 & 2033
- Table 30: Mexico Packaging Market Volume (Trillion) Forecast, by Application 2020 & 2033
- Table 31: Global Packaging Market Revenue Million Forecast, by Production Analysis 2020 & 2033
- Table 32: Global Packaging Market Volume Trillion Forecast, by Production Analysis 2020 & 2033
- Table 33: Global Packaging Market Revenue Million Forecast, by Consumption Analysis 2020 & 2033
- Table 34: Global Packaging Market Volume Trillion Forecast, by Consumption Analysis 2020 & 2033
- Table 35: Global Packaging Market Revenue Million Forecast, by Import Market Analysis (Value & Volume) 2020 & 2033
- Table 36: Global Packaging Market Volume Trillion Forecast, by Import Market Analysis (Value & Volume) 2020 & 2033
- Table 37: Global Packaging Market Revenue Million Forecast, by Export Market Analysis (Value & Volume) 2020 & 2033
- Table 38: Global Packaging Market Volume Trillion Forecast, by Export Market Analysis (Value & Volume) 2020 & 2033
- Table 39: Global Packaging Market Revenue Million Forecast, by Price Trend Analysis 2020 & 2033
- Table 40: Global Packaging Market Volume Trillion Forecast, by Price Trend Analysis 2020 & 2033
- Table 41: Global Packaging Market Revenue Million Forecast, by Country 2020 & 2033
- Table 42: Global Packaging Market Volume Trillion Forecast, by Country 2020 & 2033
- Table 43: Brazil Packaging Market Revenue (Million) Forecast, by Application 2020 & 2033
- Table 44: Brazil Packaging Market Volume (Trillion) Forecast, by Application 2020 & 2033
- Table 45: Argentina Packaging Market Revenue (Million) Forecast, by Application 2020 & 2033
- Table 46: Argentina Packaging Market Volume (Trillion) Forecast, by Application 2020 & 2033
- Table 47: Rest of South America Packaging Market Revenue (Million) Forecast, by Application 2020 & 2033
- Table 48: Rest of South America Packaging Market Volume (Trillion) Forecast, by Application 2020 & 2033
- Table 49: Global Packaging Market Revenue Million Forecast, by Production Analysis 2020 & 2033
- Table 50: Global Packaging Market Volume Trillion Forecast, by Production Analysis 2020 & 2033
- Table 51: Global Packaging Market Revenue Million Forecast, by Consumption Analysis 2020 & 2033
- Table 52: Global Packaging Market Volume Trillion Forecast, by Consumption Analysis 2020 & 2033
- Table 53: Global Packaging Market Revenue Million Forecast, by Import Market Analysis (Value & Volume) 2020 & 2033
- Table 54: Global Packaging Market Volume Trillion Forecast, by Import Market Analysis (Value & Volume) 2020 & 2033
- Table 55: Global Packaging Market Revenue Million Forecast, by Export Market Analysis (Value & Volume) 2020 & 2033
- Table 56: Global Packaging Market Volume Trillion Forecast, by Export Market Analysis (Value & Volume) 2020 & 2033
- Table 57: Global Packaging Market Revenue Million Forecast, by Price Trend Analysis 2020 & 2033
- Table 58: Global Packaging Market Volume Trillion Forecast, by Price Trend Analysis 2020 & 2033
- Table 59: Global Packaging Market Revenue Million Forecast, by Country 2020 & 2033
- Table 60: Global Packaging Market Volume Trillion Forecast, by Country 2020 & 2033
- Table 61: United Kingdom Packaging Market Revenue (Million) Forecast, by Application 2020 & 2033
- Table 62: United Kingdom Packaging Market Volume (Trillion) Forecast, by Application 2020 & 2033
- Table 63: Germany Packaging Market Revenue (Million) Forecast, by Application 2020 & 2033
- Table 64: Germany Packaging Market Volume (Trillion) Forecast, by Application 2020 & 2033
- Table 65: France Packaging Market Revenue (Million) Forecast, by Application 2020 & 2033
- Table 66: France Packaging Market Volume (Trillion) Forecast, by Application 2020 & 2033
- Table 67: Italy Packaging Market Revenue (Million) Forecast, by Application 2020 & 2033
- Table 68: Italy Packaging Market Volume (Trillion) Forecast, by Application 2020 & 2033
- Table 69: Spain Packaging Market Revenue (Million) Forecast, by Application 2020 & 2033
- Table 70: Spain Packaging Market Volume (Trillion) Forecast, by Application 2020 & 2033
- Table 71: Russia Packaging Market Revenue (Million) Forecast, by Application 2020 & 2033
- Table 72: Russia Packaging Market Volume (Trillion) Forecast, by Application 2020 & 2033
- Table 73: Benelux Packaging Market Revenue (Million) Forecast, by Application 2020 & 2033
- Table 74: Benelux Packaging Market Volume (Trillion) Forecast, by Application 2020 & 2033
- Table 75: Nordics Packaging Market Revenue (Million) Forecast, by Application 2020 & 2033
- Table 76: Nordics Packaging Market Volume (Trillion) Forecast, by Application 2020 & 2033
- Table 77: Rest of Europe Packaging Market Revenue (Million) Forecast, by Application 2020 & 2033
- Table 78: Rest of Europe Packaging Market Volume (Trillion) Forecast, by Application 2020 & 2033
- Table 79: Global Packaging Market Revenue Million Forecast, by Production Analysis 2020 & 2033
- Table 80: Global Packaging Market Volume Trillion Forecast, by Production Analysis 2020 & 2033
- Table 81: Global Packaging Market Revenue Million Forecast, by Consumption Analysis 2020 & 2033
- Table 82: Global Packaging Market Volume Trillion Forecast, by Consumption Analysis 2020 & 2033
- Table 83: Global Packaging Market Revenue Million Forecast, by Import Market Analysis (Value & Volume) 2020 & 2033
- Table 84: Global Packaging Market Volume Trillion Forecast, by Import Market Analysis (Value & Volume) 2020 & 2033
- Table 85: Global Packaging Market Revenue Million Forecast, by Export Market Analysis (Value & Volume) 2020 & 2033
- Table 86: Global Packaging Market Volume Trillion Forecast, by Export Market Analysis (Value & Volume) 2020 & 2033
- Table 87: Global Packaging Market Revenue Million Forecast, by Price Trend Analysis 2020 & 2033
- Table 88: Global Packaging Market Volume Trillion Forecast, by Price Trend Analysis 2020 & 2033
- Table 89: Global Packaging Market Revenue Million Forecast, by Country 2020 & 2033
- Table 90: Global Packaging Market Volume Trillion Forecast, by Country 2020 & 2033
- Table 91: Turkey Packaging Market Revenue (Million) Forecast, by Application 2020 & 2033
- Table 92: Turkey Packaging Market Volume (Trillion) Forecast, by Application 2020 & 2033
- Table 93: Israel Packaging Market Revenue (Million) Forecast, by Application 2020 & 2033
- Table 94: Israel Packaging Market Volume (Trillion) Forecast, by Application 2020 & 2033
- Table 95: GCC Packaging Market Revenue (Million) Forecast, by Application 2020 & 2033
- Table 96: GCC Packaging Market Volume (Trillion) Forecast, by Application 2020 & 2033
- Table 97: North Africa Packaging Market Revenue (Million) Forecast, by Application 2020 & 2033
- Table 98: North Africa Packaging Market Volume (Trillion) Forecast, by Application 2020 & 2033
- Table 99: South Africa Packaging Market Revenue (Million) Forecast, by Application 2020 & 2033
- Table 100: South Africa Packaging Market Volume (Trillion) Forecast, by Application 2020 & 2033
- Table 101: Rest of Middle East & Africa Packaging Market Revenue (Million) Forecast, by Application 2020 & 2033
- Table 102: Rest of Middle East & Africa Packaging Market Volume (Trillion) Forecast, by Application 2020 & 2033
- Table 103: Global Packaging Market Revenue Million Forecast, by Production Analysis 2020 & 2033
- Table 104: Global Packaging Market Volume Trillion Forecast, by Production Analysis 2020 & 2033
- Table 105: Global Packaging Market Revenue Million Forecast, by Consumption Analysis 2020 & 2033
- Table 106: Global Packaging Market Volume Trillion Forecast, by Consumption Analysis 2020 & 2033
- Table 107: Global Packaging Market Revenue Million Forecast, by Import Market Analysis (Value & Volume) 2020 & 2033
- Table 108: Global Packaging Market Volume Trillion Forecast, by Import Market Analysis (Value & Volume) 2020 & 2033
- Table 109: Global Packaging Market Revenue Million Forecast, by Export Market Analysis (Value & Volume) 2020 & 2033
- Table 110: Global Packaging Market Volume Trillion Forecast, by Export Market Analysis (Value & Volume) 2020 & 2033
- Table 111: Global Packaging Market Revenue Million Forecast, by Price Trend Analysis 2020 & 2033
- Table 112: Global Packaging Market Volume Trillion Forecast, by Price Trend Analysis 2020 & 2033
- Table 113: Global Packaging Market Revenue Million Forecast, by Country 2020 & 2033
- Table 114: Global Packaging Market Volume Trillion Forecast, by Country 2020 & 2033
- Table 115: China Packaging Market Revenue (Million) Forecast, by Application 2020 & 2033
- Table 116: China Packaging Market Volume (Trillion) Forecast, by Application 2020 & 2033
- Table 117: India Packaging Market Revenue (Million) Forecast, by Application 2020 & 2033
- Table 118: India Packaging Market Volume (Trillion) Forecast, by Application 2020 & 2033
- Table 119: Japan Packaging Market Revenue (Million) Forecast, by Application 2020 & 2033
- Table 120: Japan Packaging Market Volume (Trillion) Forecast, by Application 2020 & 2033
- Table 121: South Korea Packaging Market Revenue (Million) Forecast, by Application 2020 & 2033
- Table 122: South Korea Packaging Market Volume (Trillion) Forecast, by Application 2020 & 2033
- Table 123: ASEAN Packaging Market Revenue (Million) Forecast, by Application 2020 & 2033
- Table 124: ASEAN Packaging Market Volume (Trillion) Forecast, by Application 2020 & 2033
- Table 125: Oceania Packaging Market Revenue (Million) Forecast, by Application 2020 & 2033
- Table 126: Oceania Packaging Market Volume (Trillion) Forecast, by Application 2020 & 2033
- Table 127: Rest of Asia Pacific Packaging Market Revenue (Million) Forecast, by Application 2020 & 2033
- Table 128: Rest of Asia Pacific Packaging Market Volume (Trillion) Forecast, by Application 2020 & 2033
Frequently Asked Questions
1. What is the projected Compound Annual Growth Rate (CAGR) of the Packaging Market?
The projected CAGR is approximately 3.89%.
2. Which companies are prominent players in the Packaging Market?
Key companies in the market include International Paper Company, Mondi Group, Smurfit Kappa Group, DS Smith PLC, WestRock Company, UFlex Limited, Huhtamaki Oyj, Amcor Group GmbH, Coveris Holding SA, Sealed Air Corporation, Greif Inc, Sonoco Products Company, Aptar Group Inc, Berry Global Group Inc, Alpla Group, Owens-illinois Inc, Vidrala S A, Verallia SA, Gerresheimer AG, Vitro S A B De C V, Ball Corporation, Crown Holdings Inc, Ardagh Group S A, Can Pack SA, Silgan Holdings Inc.
3. What are the main segments of the Packaging Market?
The market segments include Production Analysis, Consumption Analysis, Import Market Analysis (Value & Volume), Export Market Analysis (Value & Volume), Price Trend Analysis.
4. Can you provide details about the market size?
The market size is estimated to be USD 1.14 Million as of 2022.
5. What are some drivers contributing to market growth?
N/A
6. What are the notable trends driving market growth?
Paper and Paperboard Packaging Products to Witness the Highest Growth.
7. Are there any restraints impacting market growth?
N/A
8. Can you provide examples of recent developments in the market?
June 2024: Sonoco Products Company announced its agreement to acquire Eviosys, a Europe manufacturer of food cans, ends, and closures, from KPS Capital Partners, LP, at around USD 3.9 billion.
9. What pricing options are available for accessing the report?
Pricing options include single-user, multi-user, and enterprise licenses priced at USD 3800, USD 4500, and USD 5800 respectively.
10. Is the market size provided in terms of value or volume?
The market size is provided in terms of value, measured in Million and volume, measured in Trillion.
11. Are there any specific market keywords associated with the report?
Yes, the market keyword associated with the report is "Packaging Market," which aids in identifying and referencing the specific market segment covered.
12. How do I determine which pricing option suits my needs best?
The pricing options vary based on user requirements and access needs. Individual users may opt for single-user licenses, while businesses requiring broader access may choose multi-user or enterprise licenses for cost-effective access to the report.
13. Are there any additional resources or data provided in the Packaging Market report?
While the report offers comprehensive insights, it's advisable to review the specific contents or supplementary materials provided to ascertain if additional resources or data are available.
14. How can I stay updated on further developments or reports in the Packaging Market?
To stay informed about further developments, trends, and reports in the Packaging Market, consider subscribing to industry newsletters, following relevant companies and organizations, or regularly checking reputable industry news sources and publications.
Methodology
Step 1 - Identification of Relevant Samples Size from Population Database


Step 2 - Approaches for Defining Global Market Size (Value, Volume* & Price*)

Note*: In applicable scenarios
Step 3 - Data Sources
Primary Research
- Web Analytics
- Survey Reports
- Research Institute
- Latest Research Reports
- Opinion Leaders
Secondary Research
- Annual Reports
- White Paper
- Latest Press Release
- Industry Association
- Paid Database
- Investor Presentations

Step 4 - Data Triangulation
Involves using different sources of information in order to increase the validity of a study
These sources are likely to be stakeholders in a program - participants, other researchers, program staff, other community members, and so on.
Then we put all data in single framework & apply various statistical tools to find out the dynamic on the market.
During the analysis stage, feedback from the stakeholder groups would be compared to determine areas of agreement as well as areas of divergence