

Key Insights
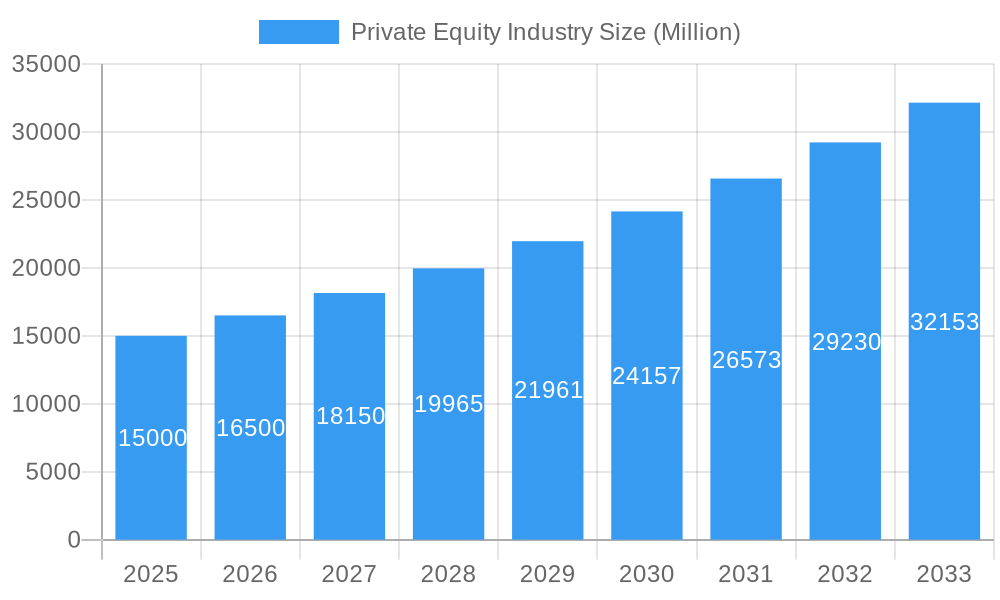
The global private equity (PE) industry is experiencing robust growth, projected to maintain a Compound Annual Growth Rate (CAGR) exceeding 10% from 2025 to 2033. This expansion is driven by several factors, including increasing institutional investor interest seeking higher returns than traditional asset classes, a rise in available dry powder (uninvested capital), and a favorable regulatory environment in many key markets. The technology and healthcare sectors are major beneficiaries, attracting significant PE investments due to their growth potential and innovation-driven nature. Further fueling growth are strategic acquisitions within the financial services, consumer & retail, and real estate sectors, reflecting a continued focus on consolidation and value creation within established markets. While geopolitical uncertainty and potential economic downturns pose risks, the adaptability of PE firms to changing market conditions suggests continued expansion, although potentially at a moderated pace during periods of economic volatility. The industry's diverse investment strategies, spanning buyout, venture capital, real estate, and infrastructure, contribute to its resilience and broad appeal to both investors and businesses seeking capital. The geographical distribution of investments remains concentrated in North America and Europe, but Asia-Pacific, especially China and India, are exhibiting increasing significance with substantial growth potential for the remainder of the forecast period. Different fund types show varying growth trajectories, with venture capital showing potentially higher growth than buyouts in the coming years reflecting the increased focus on innovation-driven investments.
Private Equity Industry Market Size (In Billion)
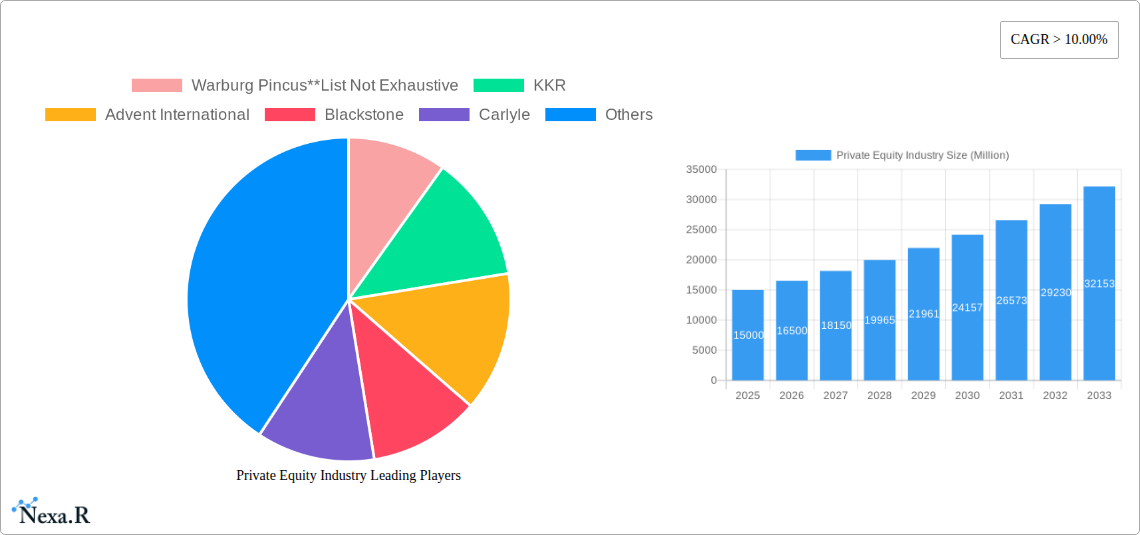
The varied investment strategies employed by leading private equity firms, such as Warburg Pincus, KKR, Blackstone, and Carlyle, further contribute to market dynamism. These firms actively pursue investments across different market capitalization segments, ranging from large-cap to lower middle-market deals, ensuring a diversified investment portfolio and resilience against market fluctuations. The segmentation by sector also reflects industry-specific dynamics and growth opportunities. For instance, while the technology sector enjoys robust growth, the real estate sector benefits from long-term investments and stable returns. This strategic diversification across fund types, sectors, and investment sizes positions the private equity industry to continue its impressive growth trajectory, despite potential challenges. Furthermore, emerging markets in regions like South America and MEA offer promising opportunities for future expansion, although these markets are currently relatively less developed compared to North America, Europe, and Asia-Pacific.
Private Equity Industry Company Market Share
Private Equity Industry Market Report: 2019-2033
This comprehensive report provides a detailed analysis of the Private Equity industry, encompassing market dynamics, growth trends, key players, and future outlook. The study period covers 2019-2033, with a base year of 2025 and a forecast period of 2025-2033. This report is invaluable for investors, industry professionals, and anyone seeking to understand the intricacies and future potential of this dynamic sector. The report analyzes key segments including Buyout, Venture Capital (VCs), Real Estate, and Infrastructure funds, across diverse sectors such as Technology, Healthcare, and Financial Services, considering investments across Large Cap, Upper Middle Market, and Lower Middle Market segments.
Private Equity Industry Market Dynamics & Structure
The private equity market is characterized by high concentration among leading firms and significant technological innovation. Regulatory frameworks, competitive pressures from alternative investment vehicles, and evolving end-user demographics shape market dynamics. Mergers and acquisitions (M&A) play a crucial role, driving market consolidation and shaping investment strategies.
- Market Concentration: The top 10 firms (including Warburg Pincus, KKR, Blackstone, Carlyle, and others) hold an estimated xx% market share in global private equity.
- Technological Innovation: Fintech and data analytics are reshaping deal sourcing, due diligence, and portfolio management.
- Regulatory Landscape: Increasing regulatory scrutiny impacts deal structures and investment strategies across jurisdictions.
- M&A Trends: Deal volume showed a xx% increase in 2024 compared to 2023, driven primarily by activity in the Technology and Healthcare sectors. The average deal size is estimated at $xx million.
- Competitive Landscape: Competition is intense, with both traditional PE firms and alternative asset managers vying for attractive investment opportunities.
Private Equity Industry Growth Trends & Insights
The global private equity market is experiencing robust growth, driven by several key factors. Increasing institutional investor participation, alongside favorable economic conditions in several regions, has fueled substantial investment flows into the sector. Technological disruption and shifts in consumer behavior further contribute to market expansion. Our analysis projects a Compound Annual Growth Rate (CAGR) of xx% during the forecast period (2025-2033). This growth is supported by rising demand for alternative investment strategies and the increasing availability of sophisticated data-driven investment approaches. Market penetration is expected to reach xx% by 2033, driven by a growing number of startups and established businesses seeking private equity funding. Specific sector analyses reveal the highest growth in the Technology and Healthcare sectors. The overall market size is predicted to reach $xx million by 2033, from $xx million in 2024.
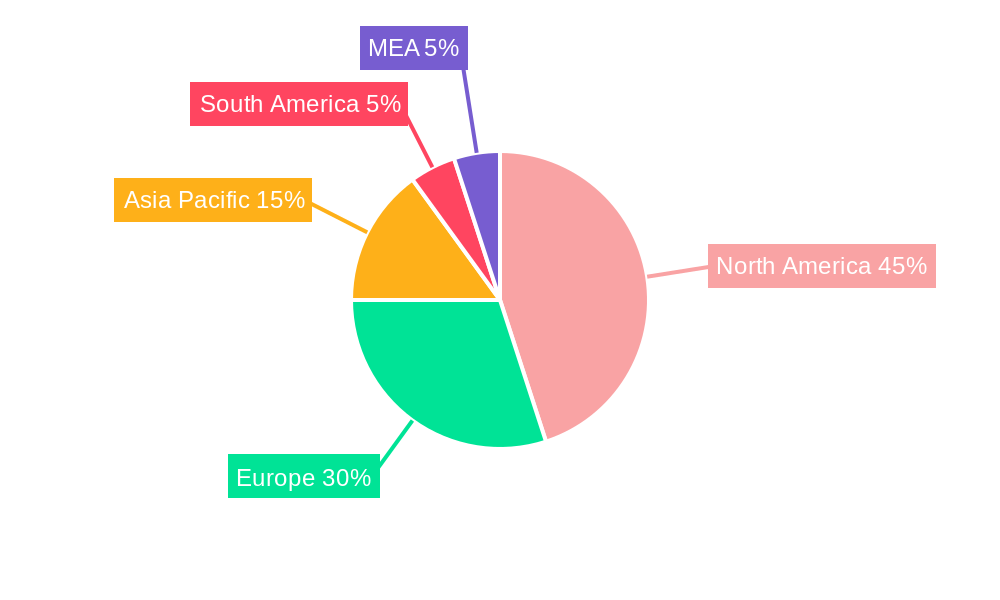
Dominant Regions, Countries, or Segments in Private Equity Industry
North America (specifically the U.S.) and Europe remain the dominant regions for private equity activity, although Asia-Pacific is experiencing rapid growth. Within fund types, Buyout funds continue to represent the largest segment, while Venture Capital investments are concentrated in Technology and other high-growth sectors.
- North America: Strong economic fundamentals and a deep pool of investable companies contribute to its dominance.
- Europe: A mature market with a diverse range of investment opportunities continues to attract significant investment.
- Asia-Pacific: Rapid economic growth and a burgeoning entrepreneurial landscape are fueling private equity expansion.
- Dominant Sectors: Technology (Software), Healthcare, and Financial Services collectively account for xx% of total private equity investments.
- Investment Strategies: Large-cap investments constitute a significant portion of total deal value, while the Upper Middle Market segment showcases substantial growth potential.
Private Equity Industry Product Landscape
Private equity firms offer various investment products tailored to different investor needs and risk tolerances, ranging from customized fund structures to direct co-investments. Technological advancements such as AI-driven due diligence and portfolio monitoring tools are enhancing investment efficiency and risk management. Unique selling propositions include specialized sector expertise, access to a vast deal pipeline, and established networks. The market is characterized by increasingly sophisticated value-creation strategies.
Key Drivers, Barriers & Challenges in Private Equity Industry
Key Drivers:
- Increasing institutional investor interest in alternative assets.
- Technological advancements enhancing deal sourcing and portfolio management.
- Favorable economic conditions in key markets.
Key Barriers & Challenges:
- Regulatory uncertainty and compliance requirements.
- Intense competition from other investment firms.
- Difficulty in identifying and executing successful exit strategies. An estimated xx% of deals experience delays or difficulties in exit strategies.
Emerging Opportunities in Private Equity Industry
- Untapped markets in emerging economies.
- Innovative investment strategies in areas like ESG and impact investing.
- Growth in niche sectors such as fintech and renewable energy.
Growth Accelerators in the Private Equity Industry Industry
Strategic partnerships, expansion into new geographical markets, and advancements in data analytics are critical growth accelerators. Technological breakthroughs and innovations in deal structuring further contribute to industry growth.
Key Players Shaping the Private Equity Industry Market
- Warburg Pincus
- KKR
- Advent International
- Blackstone
- Carlyle
- EnCap Investments
- CVC Capital Partners
- TPG Capital
- Neuberger Berman
- Apollo Global Management
Notable Milestones in Private Equity Industry Sector
- September 2022: Nonantum Capital Partners acquired LJP Waste Solutions, demonstrating continued interest in the environmental services sector.
- August 2022: Prosus Ventures and PayU India acquired BillDesk in a USD 4.7 billion deal, highlighting significant activity in the Indian digital payments market.
In-Depth Private Equity Industry Market Outlook
The private equity market is poised for continued growth, driven by increasing demand for alternative investments and ongoing technological advancements. Strategic partnerships and expansion into new markets will be key factors in shaping future market dynamics. The focus on ESG and sustainability, along with the rise of innovative investment strategies, will also be key areas to monitor. The market shows significant potential for further expansion, with opportunities arising in various sectors and geographical regions.
Private Equity Industry Segmentation
-
1. Fund Type
- 1.1. Buyout
- 1.2. Venture Capital (VCs)
- 1.3. Real Estate
- 1.4. Infrastructure
- 1.5. Other (Distressed PE, Direct Lending, etc.)
-
2. Sector
- 2.1. Technology (Software)
- 2.2. Healthcare
- 2.3. Real Estate and Services
- 2.4. Financial Services
- 2.5. Industrials
- 2.6. Consumer & Retail
- 2.7. Energy & Power
- 2.8. Media & Entertainment
- 2.9. Telecom
- 2.10. Others (Transportation, etc.)
-
3. Investments
- 3.1. Large Cap
- 3.2. Upper Middle Market
- 3.3. Lower Middle Market
- 3.4. Real Estate
Private Equity Industry Segmentation By Geography
- 1. North America
- 2. Europe
- 3. Asia Pacific
- 4. Latin America
- 5. Middle East
Private Equity Industry Regional Market Share
Geographic Coverage of Private Equity Industry
Private Equity Industry REPORT HIGHLIGHTS
| Aspects | Details |
|---|---|
| Study Period | 2020-2034 |
| Base Year | 2025 |
| Estimated Year | 2026 |
| Forecast Period | 2026-2034 |
| Historical Period | 2020-2025 |
| Growth Rate | CAGR of 11% from 2020-2034 |
| Segmentation |
|
Table of Contents
- 1. Introduction
- 1.1. Research Scope
- 1.2. Market Segmentation
- 1.3. Research Objective
- 1.4. Definitions and Assumptions
- 2. Executive Summary
- 2.1. Market Snapshot
- 3. Market Dynamics
- 3.1. Market Drivers
- 3.2. Market Restrains
- 3.3. Market Trends
- 3.4. Market Opportunities
- 4. Market Factor Analysis
- 4.1. Porters Five Forces
- 4.1.1. Bargaining Power of Suppliers
- 4.1.2. Bargaining Power of Buyers
- 4.1.3. Threat of New Entrants
- 4.1.4. Threat of Substitutes
- 4.1.5. Competitive Rivalry
- 4.2. PESTEL analysis
- 4.3. BCG Analysis
- 4.3.1. Stars (High Growth, High Market Share)
- 4.3.2. Cash Cows (Low Growth, High Market Share)
- 4.3.3. Question Mark (High Growth, Low Market Share)
- 4.3.4. Dogs (Low Growth, Low Market Share)
- 4.4. Ansoff Matrix Analysis
- 4.5. Supply Chain Analysis
- 4.6. Regulatory Landscape
- 4.7. Current Market Potential and Opportunity Assessment (TAM–SAM–SOM Framework)
- 4.8. NRP Analyst Note
- 4.1. Porters Five Forces
- 5. Market Analysis, Insights and Forecast 2021-2033
- 5.1. Market Analysis, Insights and Forecast - by Fund Type
- 5.1.1. Buyout
- 5.1.2. Venture Capital (VCs)
- 5.1.3. Real Estate
- 5.1.4. Infrastructure
- 5.1.5. Other (Distressed PE, Direct Lending, etc.)
- 5.2. Market Analysis, Insights and Forecast - by Sector
- 5.2.1. Technology (Software)
- 5.2.2. Healthcare
- 5.2.3. Real Estate and Services
- 5.2.4. Financial Services
- 5.2.5. Industrials
- 5.2.6. Consumer & Retail
- 5.2.7. Energy & Power
- 5.2.8. Media & Entertainment
- 5.2.9. Telecom
- 5.2.10. Others (Transportation, etc.)
- 5.3. Market Analysis, Insights and Forecast - by Investments
- 5.3.1. Large Cap
- 5.3.2. Upper Middle Market
- 5.3.3. Lower Middle Market
- 5.3.4. Real Estate
- 5.4. Market Analysis, Insights and Forecast - by Region
- 5.4.1. North America
- 5.4.2. Europe
- 5.4.3. Asia Pacific
- 5.4.4. Latin America
- 5.4.5. Middle East
- 5.1. Market Analysis, Insights and Forecast - by Fund Type
- 6. Global Private Equity Industry Analysis, Insights and Forecast, 2021-2033
- 6.1. Market Analysis, Insights and Forecast - by Fund Type
- 6.1.1. Buyout
- 6.1.2. Venture Capital (VCs)
- 6.1.3. Real Estate
- 6.1.4. Infrastructure
- 6.1.5. Other (Distressed PE, Direct Lending, etc.)
- 6.2. Market Analysis, Insights and Forecast - by Sector
- 6.2.1. Technology (Software)
- 6.2.2. Healthcare
- 6.2.3. Real Estate and Services
- 6.2.4. Financial Services
- 6.2.5. Industrials
- 6.2.6. Consumer & Retail
- 6.2.7. Energy & Power
- 6.2.8. Media & Entertainment
- 6.2.9. Telecom
- 6.2.10. Others (Transportation, etc.)
- 6.3. Market Analysis, Insights and Forecast - by Investments
- 6.3.1. Large Cap
- 6.3.2. Upper Middle Market
- 6.3.3. Lower Middle Market
- 6.3.4. Real Estate
- 6.1. Market Analysis, Insights and Forecast - by Fund Type
- 7. North America Private Equity Industry Analysis, Insights and Forecast, 2020-2032
- 7.1. Market Analysis, Insights and Forecast - by Fund Type
- 7.1.1. Buyout
- 7.1.2. Venture Capital (VCs)
- 7.1.3. Real Estate
- 7.1.4. Infrastructure
- 7.1.5. Other (Distressed PE, Direct Lending, etc.)
- 7.2. Market Analysis, Insights and Forecast - by Sector
- 7.2.1. Technology (Software)
- 7.2.2. Healthcare
- 7.2.3. Real Estate and Services
- 7.2.4. Financial Services
- 7.2.5. Industrials
- 7.2.6. Consumer & Retail
- 7.2.7. Energy & Power
- 7.2.8. Media & Entertainment
- 7.2.9. Telecom
- 7.2.10. Others (Transportation, etc.)
- 7.3. Market Analysis, Insights and Forecast - by Investments
- 7.3.1. Large Cap
- 7.3.2. Upper Middle Market
- 7.3.3. Lower Middle Market
- 7.3.4. Real Estate
- 7.1. Market Analysis, Insights and Forecast - by Fund Type
- 8. Europe Private Equity Industry Analysis, Insights and Forecast, 2020-2032
- 8.1. Market Analysis, Insights and Forecast - by Fund Type
- 8.1.1. Buyout
- 8.1.2. Venture Capital (VCs)
- 8.1.3. Real Estate
- 8.1.4. Infrastructure
- 8.1.5. Other (Distressed PE, Direct Lending, etc.)
- 8.2. Market Analysis, Insights and Forecast - by Sector
- 8.2.1. Technology (Software)
- 8.2.2. Healthcare
- 8.2.3. Real Estate and Services
- 8.2.4. Financial Services
- 8.2.5. Industrials
- 8.2.6. Consumer & Retail
- 8.2.7. Energy & Power
- 8.2.8. Media & Entertainment
- 8.2.9. Telecom
- 8.2.10. Others (Transportation, etc.)
- 8.3. Market Analysis, Insights and Forecast - by Investments
- 8.3.1. Large Cap
- 8.3.2. Upper Middle Market
- 8.3.3. Lower Middle Market
- 8.3.4. Real Estate
- 8.1. Market Analysis, Insights and Forecast - by Fund Type
- 9. Asia Pacific Private Equity Industry Analysis, Insights and Forecast, 2020-2032
- 9.1. Market Analysis, Insights and Forecast - by Fund Type
- 9.1.1. Buyout
- 9.1.2. Venture Capital (VCs)
- 9.1.3. Real Estate
- 9.1.4. Infrastructure
- 9.1.5. Other (Distressed PE, Direct Lending, etc.)
- 9.2. Market Analysis, Insights and Forecast - by Sector
- 9.2.1. Technology (Software)
- 9.2.2. Healthcare
- 9.2.3. Real Estate and Services
- 9.2.4. Financial Services
- 9.2.5. Industrials
- 9.2.6. Consumer & Retail
- 9.2.7. Energy & Power
- 9.2.8. Media & Entertainment
- 9.2.9. Telecom
- 9.2.10. Others (Transportation, etc.)
- 9.3. Market Analysis, Insights and Forecast - by Investments
- 9.3.1. Large Cap
- 9.3.2. Upper Middle Market
- 9.3.3. Lower Middle Market
- 9.3.4. Real Estate
- 9.1. Market Analysis, Insights and Forecast - by Fund Type
- 10. Latin America Private Equity Industry Analysis, Insights and Forecast, 2020-2032
- 10.1. Market Analysis, Insights and Forecast - by Fund Type
- 10.1.1. Buyout
- 10.1.2. Venture Capital (VCs)
- 10.1.3. Real Estate
- 10.1.4. Infrastructure
- 10.1.5. Other (Distressed PE, Direct Lending, etc.)
- 10.2. Market Analysis, Insights and Forecast - by Sector
- 10.2.1. Technology (Software)
- 10.2.2. Healthcare
- 10.2.3. Real Estate and Services
- 10.2.4. Financial Services
- 10.2.5. Industrials
- 10.2.6. Consumer & Retail
- 10.2.7. Energy & Power
- 10.2.8. Media & Entertainment
- 10.2.9. Telecom
- 10.2.10. Others (Transportation, etc.)
- 10.3. Market Analysis, Insights and Forecast - by Investments
- 10.3.1. Large Cap
- 10.3.2. Upper Middle Market
- 10.3.3. Lower Middle Market
- 10.3.4. Real Estate
- 10.1. Market Analysis, Insights and Forecast - by Fund Type
- 11. Middle East Private Equity Industry Analysis, Insights and Forecast, 2020-2032
- 11.1. Market Analysis, Insights and Forecast - by Fund Type
- 11.1.1. Buyout
- 11.1.2. Venture Capital (VCs)
- 11.1.3. Real Estate
- 11.1.4. Infrastructure
- 11.1.5. Other (Distressed PE, Direct Lending, etc.)
- 11.2. Market Analysis, Insights and Forecast - by Sector
- 11.2.1. Technology (Software)
- 11.2.2. Healthcare
- 11.2.3. Real Estate and Services
- 11.2.4. Financial Services
- 11.2.5. Industrials
- 11.2.6. Consumer & Retail
- 11.2.7. Energy & Power
- 11.2.8. Media & Entertainment
- 11.2.9. Telecom
- 11.2.10. Others (Transportation, etc.)
- 11.3. Market Analysis, Insights and Forecast - by Investments
- 11.3.1. Large Cap
- 11.3.2. Upper Middle Market
- 11.3.3. Lower Middle Market
- 11.3.4. Real Estate
- 11.1. Market Analysis, Insights and Forecast - by Fund Type
- 12. Competitive Analysis
- 12.1. Company Profiles
- 12.1.1 Warburg Pincus**List Not Exhaustive
- 12.1.1.1. Company Overview
- 12.1.1.2. Products
- 12.1.1.3. Company Financials
- 12.1.1.4. SWOT Analysis
- 12.1.2 KKR
- 12.1.2.1. Company Overview
- 12.1.2.2. Products
- 12.1.2.3. Company Financials
- 12.1.2.4. SWOT Analysis
- 12.1.3 Advent International
- 12.1.3.1. Company Overview
- 12.1.3.2. Products
- 12.1.3.3. Company Financials
- 12.1.3.4. SWOT Analysis
- 12.1.4 Blackstone
- 12.1.4.1. Company Overview
- 12.1.4.2. Products
- 12.1.4.3. Company Financials
- 12.1.4.4. SWOT Analysis
- 12.1.5 Carlyle
- 12.1.5.1. Company Overview
- 12.1.5.2. Products
- 12.1.5.3. Company Financials
- 12.1.5.4. SWOT Analysis
- 12.1.6 EnCap Investments
- 12.1.6.1. Company Overview
- 12.1.6.2. Products
- 12.1.6.3. Company Financials
- 12.1.6.4. SWOT Analysis
- 12.1.7 CVC Capital Partners
- 12.1.7.1. Company Overview
- 12.1.7.2. Products
- 12.1.7.3. Company Financials
- 12.1.7.4. SWOT Analysis
- 12.1.8 TPG Capital
- 12.1.8.1. Company Overview
- 12.1.8.2. Products
- 12.1.8.3. Company Financials
- 12.1.8.4. SWOT Analysis
- 12.1.9 Neuberger Berman
- 12.1.9.1. Company Overview
- 12.1.9.2. Products
- 12.1.9.3. Company Financials
- 12.1.9.4. SWOT Analysis
- 12.1.10 Apollo Global Management
- 12.1.10.1. Company Overview
- 12.1.10.2. Products
- 12.1.10.3. Company Financials
- 12.1.10.4. SWOT Analysis
- 12.1.1 Warburg Pincus**List Not Exhaustive
- 12.2. Market Entropy
- 12.2.1 Company's Key Areas Served
- 12.2.2 Recent Developments
- 12.3. Company Market Share Analysis 2025
- 12.3.1 Top 5 Companies Market Share Analysis
- 12.3.2 Top 3 Companies Market Share Analysis
- 12.4. List of Potential Customers
- 13. Research Methodology
List of Figures
- Figure 1: Global Private Equity Industry Revenue Breakdown (billion, %) by Region 2025 & 2033
- Figure 2: North America Private Equity Industry Revenue (billion), by Fund Type 2025 & 2033
- Figure 3: North America Private Equity Industry Revenue Share (%), by Fund Type 2025 & 2033
- Figure 4: North America Private Equity Industry Revenue (billion), by Sector 2025 & 2033
- Figure 5: North America Private Equity Industry Revenue Share (%), by Sector 2025 & 2033
- Figure 6: North America Private Equity Industry Revenue (billion), by Investments 2025 & 2033
- Figure 7: North America Private Equity Industry Revenue Share (%), by Investments 2025 & 2033
- Figure 8: North America Private Equity Industry Revenue (billion), by Country 2025 & 2033
- Figure 9: North America Private Equity Industry Revenue Share (%), by Country 2025 & 2033
- Figure 10: Europe Private Equity Industry Revenue (billion), by Fund Type 2025 & 2033
- Figure 11: Europe Private Equity Industry Revenue Share (%), by Fund Type 2025 & 2033
- Figure 12: Europe Private Equity Industry Revenue (billion), by Sector 2025 & 2033
- Figure 13: Europe Private Equity Industry Revenue Share (%), by Sector 2025 & 2033
- Figure 14: Europe Private Equity Industry Revenue (billion), by Investments 2025 & 2033
- Figure 15: Europe Private Equity Industry Revenue Share (%), by Investments 2025 & 2033
- Figure 16: Europe Private Equity Industry Revenue (billion), by Country 2025 & 2033
- Figure 17: Europe Private Equity Industry Revenue Share (%), by Country 2025 & 2033
- Figure 18: Asia Pacific Private Equity Industry Revenue (billion), by Fund Type 2025 & 2033
- Figure 19: Asia Pacific Private Equity Industry Revenue Share (%), by Fund Type 2025 & 2033
- Figure 20: Asia Pacific Private Equity Industry Revenue (billion), by Sector 2025 & 2033
- Figure 21: Asia Pacific Private Equity Industry Revenue Share (%), by Sector 2025 & 2033
- Figure 22: Asia Pacific Private Equity Industry Revenue (billion), by Investments 2025 & 2033
- Figure 23: Asia Pacific Private Equity Industry Revenue Share (%), by Investments 2025 & 2033
- Figure 24: Asia Pacific Private Equity Industry Revenue (billion), by Country 2025 & 2033
- Figure 25: Asia Pacific Private Equity Industry Revenue Share (%), by Country 2025 & 2033
- Figure 26: Latin America Private Equity Industry Revenue (billion), by Fund Type 2025 & 2033
- Figure 27: Latin America Private Equity Industry Revenue Share (%), by Fund Type 2025 & 2033
- Figure 28: Latin America Private Equity Industry Revenue (billion), by Sector 2025 & 2033
- Figure 29: Latin America Private Equity Industry Revenue Share (%), by Sector 2025 & 2033
- Figure 30: Latin America Private Equity Industry Revenue (billion), by Investments 2025 & 2033
- Figure 31: Latin America Private Equity Industry Revenue Share (%), by Investments 2025 & 2033
- Figure 32: Latin America Private Equity Industry Revenue (billion), by Country 2025 & 2033
- Figure 33: Latin America Private Equity Industry Revenue Share (%), by Country 2025 & 2033
- Figure 34: Middle East Private Equity Industry Revenue (billion), by Fund Type 2025 & 2033
- Figure 35: Middle East Private Equity Industry Revenue Share (%), by Fund Type 2025 & 2033
- Figure 36: Middle East Private Equity Industry Revenue (billion), by Sector 2025 & 2033
- Figure 37: Middle East Private Equity Industry Revenue Share (%), by Sector 2025 & 2033
- Figure 38: Middle East Private Equity Industry Revenue (billion), by Investments 2025 & 2033
- Figure 39: Middle East Private Equity Industry Revenue Share (%), by Investments 2025 & 2033
- Figure 40: Middle East Private Equity Industry Revenue (billion), by Country 2025 & 2033
- Figure 41: Middle East Private Equity Industry Revenue Share (%), by Country 2025 & 2033
List of Tables
- Table 1: Global Private Equity Industry Revenue billion Forecast, by Fund Type 2020 & 2033
- Table 2: Global Private Equity Industry Revenue billion Forecast, by Sector 2020 & 2033
- Table 3: Global Private Equity Industry Revenue billion Forecast, by Investments 2020 & 2033
- Table 4: Global Private Equity Industry Revenue billion Forecast, by Region 2020 & 2033
- Table 5: Global Private Equity Industry Revenue billion Forecast, by Fund Type 2020 & 2033
- Table 6: Global Private Equity Industry Revenue billion Forecast, by Sector 2020 & 2033
- Table 7: Global Private Equity Industry Revenue billion Forecast, by Investments 2020 & 2033
- Table 8: Global Private Equity Industry Revenue billion Forecast, by Country 2020 & 2033
- Table 9: Global Private Equity Industry Revenue billion Forecast, by Fund Type 2020 & 2033
- Table 10: Global Private Equity Industry Revenue billion Forecast, by Sector 2020 & 2033
- Table 11: Global Private Equity Industry Revenue billion Forecast, by Investments 2020 & 2033
- Table 12: Global Private Equity Industry Revenue billion Forecast, by Country 2020 & 2033
- Table 13: Global Private Equity Industry Revenue billion Forecast, by Fund Type 2020 & 2033
- Table 14: Global Private Equity Industry Revenue billion Forecast, by Sector 2020 & 2033
- Table 15: Global Private Equity Industry Revenue billion Forecast, by Investments 2020 & 2033
- Table 16: Global Private Equity Industry Revenue billion Forecast, by Country 2020 & 2033
- Table 17: Global Private Equity Industry Revenue billion Forecast, by Fund Type 2020 & 2033
- Table 18: Global Private Equity Industry Revenue billion Forecast, by Sector 2020 & 2033
- Table 19: Global Private Equity Industry Revenue billion Forecast, by Investments 2020 & 2033
- Table 20: Global Private Equity Industry Revenue billion Forecast, by Country 2020 & 2033
- Table 21: Global Private Equity Industry Revenue billion Forecast, by Fund Type 2020 & 2033
- Table 22: Global Private Equity Industry Revenue billion Forecast, by Sector 2020 & 2033
- Table 23: Global Private Equity Industry Revenue billion Forecast, by Investments 2020 & 2033
- Table 24: Global Private Equity Industry Revenue billion Forecast, by Country 2020 & 2033
Frequently Asked Questions
1. What is the projected Compound Annual Growth Rate (CAGR) of the Private Equity Industry?
The projected CAGR is approximately 11%.
2. Which companies are prominent players in the Private Equity Industry?
Key companies in the market include Warburg Pincus**List Not Exhaustive, KKR, Advent International, Blackstone, Carlyle, EnCap Investments, CVC Capital Partners, TPG Capital, Neuberger Berman, Apollo Global Management.
3. What are the main segments of the Private Equity Industry?
The market segments include Fund Type, Sector, Investments.
4. Can you provide details about the market size?
The market size is estimated to be USD 460 billion as of 2022.
5. What are some drivers contributing to market growth?
Increasing Adoption of Innovative Tracking Technologies.
6. What are the notable trends driving market growth?
Growth Investments Have Become Larger and More Complex.
7. Are there any restraints impacting market growth?
Rising Competition of Banks with Fintech and Financial Services.
8. Can you provide examples of recent developments in the market?
September 2022: Nonantum Capital Partners, a middle-market private equity firm, today announced the acquisition of LJP Waste Solutions ("LJP") from Aperion Management. LJP is a leading regional provider of non-hazardous solid waste and recycling services specializing in zero landfill and waste-to-energy solutions.
9. What pricing options are available for accessing the report?
Pricing options include single-user, multi-user, and enterprise licenses priced at USD 4750, USD 5250, and USD 8750 respectively.
10. Is the market size provided in terms of value or volume?
The market size is provided in terms of value, measured in billion.
11. Are there any specific market keywords associated with the report?
Yes, the market keyword associated with the report is "Private Equity Industry," which aids in identifying and referencing the specific market segment covered.
12. How do I determine which pricing option suits my needs best?
The pricing options vary based on user requirements and access needs. Individual users may opt for single-user licenses, while businesses requiring broader access may choose multi-user or enterprise licenses for cost-effective access to the report.
13. Are there any additional resources or data provided in the Private Equity Industry report?
While the report offers comprehensive insights, it's advisable to review the specific contents or supplementary materials provided to ascertain if additional resources or data are available.
14. How can I stay updated on further developments or reports in the Private Equity Industry?
To stay informed about further developments, trends, and reports in the Private Equity Industry, consider subscribing to industry newsletters, following relevant companies and organizations, or regularly checking reputable industry news sources and publications.
Methodology
Step 1 - Identification of Relevant Samples Size from Population Database


Step 2 - Approaches for Defining Global Market Size (Value, Volume* & Price*)

Note*: In applicable scenarios
Step 3 - Data Sources
Primary Research
- Web Analytics
- Survey Reports
- Research Institute
- Latest Research Reports
- Opinion Leaders
Secondary Research
- Annual Reports
- White Paper
- Latest Press Release
- Industry Association
- Paid Database
- Investor Presentations

Step 4 - Data Triangulation
Involves using different sources of information in order to increase the validity of a study
These sources are likely to be stakeholders in a program - participants, other researchers, program staff, other community members, and so on.
Then we put all data in single framework & apply various statistical tools to find out the dynamic on the market.
During the analysis stage, feedback from the stakeholder groups would be compared to determine areas of agreement as well as areas of divergence