

Key Insights
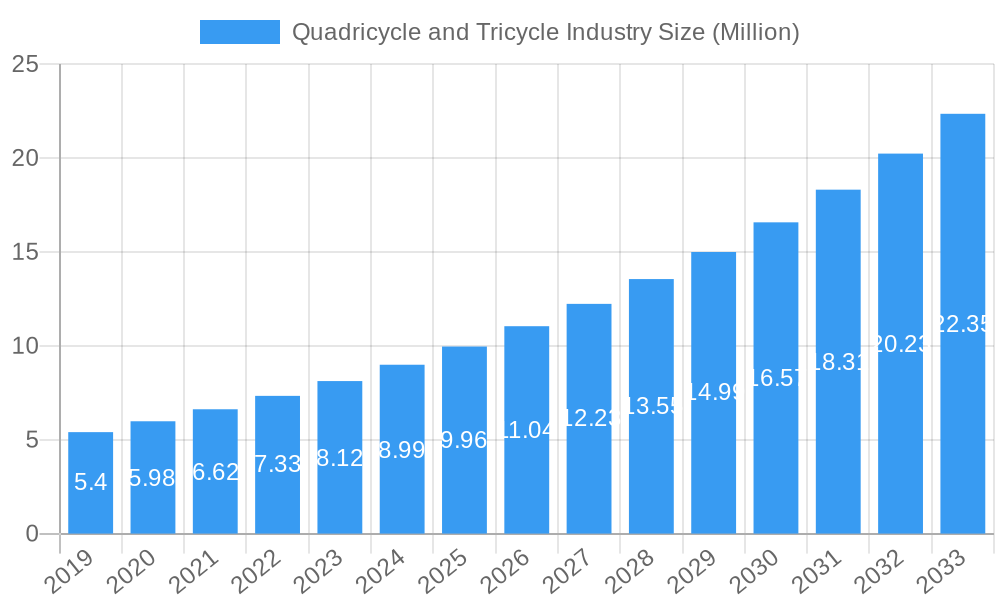
The global Quadricycle and Tricycle market is experiencing robust growth, projected to reach a substantial USD 8.20 million by 2025. This expansion is fueled by a significant Compound Annual Growth Rate (CAGR) of 10.84% between 2019 and 2033, indicating a dynamic and evolving industry. Key growth drivers include the increasing demand for sustainable and cost-effective urban mobility solutions, particularly in densely populated areas. Governments worldwide are actively promoting micro-mobility and low-emission vehicles, further bolstering market prospects. The rising adoption of electric power sources, driven by environmental consciousness and favorable government incentives, is a prominent trend. Electric quadricycles and tricycles are gaining traction for personal commuting and last-mile delivery services due to their reduced operating costs and environmental benefits. Furthermore, advancements in battery technology and charging infrastructure are addressing range anxiety and improving the overall user experience. The growing emphasis on personalized transportation options and the need for efficient, compact vehicles for navigating congested city streets are also contributing to the market's upward trajectory.
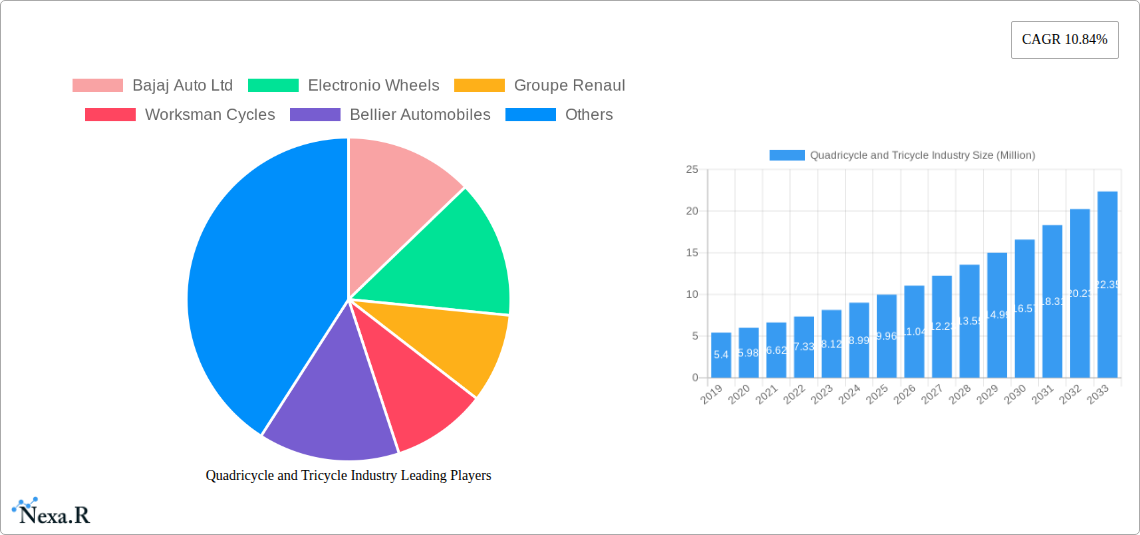
Quadricycle and Tricycle Industry Market Size (In Million)
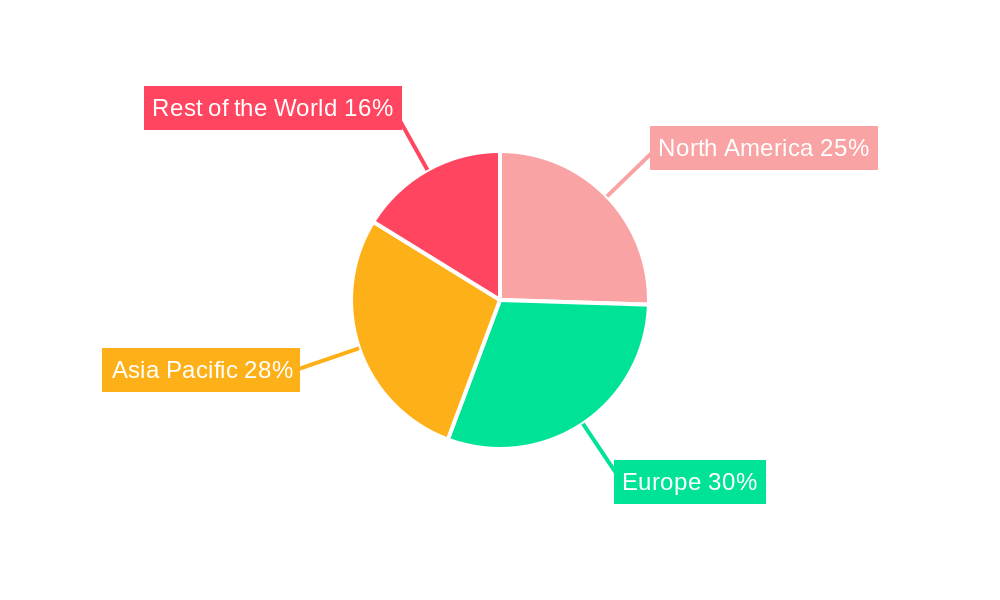
The market segmentation reveals a strong preference for electric power sources across both personal and commercial applications. While gasoline-powered vehicles still hold a presence, the trend is clearly shifting towards electrification. Within vehicle types, both quadricycles and tricycles are witnessing increasing demand, catering to diverse needs from individual riders to small-scale commercial operations. Geographically, Europe and North America are anticipated to be major markets, driven by stringent emission regulations and a well-established infrastructure for electric vehicles. The Asia Pacific region, particularly China and India, presents significant growth potential due to its large population, increasing disposable incomes, and a growing focus on sustainable transportation. However, certain restraints, such as high initial costs for some electric models and limitations in charging infrastructure in developing regions, may pose challenges. Despite these, the overall outlook for the quadricycle and tricycle industry remains exceptionally positive, with innovation and evolving consumer preferences paving the way for sustained expansion.
Quadricycle and Tricycle Industry Company Market Share
Comprehensive Quadricycle and Tricycle Industry Report: Market Dynamics, Growth Trends, and Future Outlook (2019-2033)
This in-depth report delivers a critical analysis of the global Quadricycle and Tricycle industry, encompassing a detailed examination of market dynamics, growth trajectories, regional dominance, product innovation, key players, and future opportunities. With an extensive study period from 2019 to 2033, including a base year of 2025 and a forecast period from 2025 to 2033, this report provides invaluable insights for stakeholders seeking to navigate and capitalize on this rapidly evolving sector. Leveraging high-traffic SEO keywords such as "quadricycle market," "tricycle market," "electric quadricycle," "commercial tricycle," "personal mobility solutions," and "micro-mobility industry," this report ensures maximum visibility and engagement for industry professionals, manufacturers, investors, and policymakers. We delve into both parent and child market segments, offering a holistic view of the landscape. All quantitative values are presented in Million units.
Quadricycle and Tricycle Industry Market Dynamics & Structure
The Quadricycle and Tricycle industry is characterized by a dynamic interplay of market concentration, technological innovation, and evolving regulatory frameworks. While certain segments exhibit moderate concentration, driven by established manufacturers like Bajaj Auto Ltd and Groupe Renault, the burgeoning electric and micro-mobility sectors are fostering an environment ripe for new entrants and specialized players. Technological innovation is a primary driver, with advancements in battery technology, lightweight materials, and connectivity features significantly influencing product development and adoption. Regulatory bodies are increasingly focusing on safety standards and emissions, particularly for electric quadricycles and tricycles, creating both opportunities and challenges. Competitive product substitutes, ranging from traditional motorcycles and scooters to emerging electric bikes and autonomous shuttles, necessitate continuous product differentiation and cost-effectiveness. End-user demographics are expanding, with a growing interest from urban commuters seeking sustainable and affordable personal mobility, as well as businesses looking for efficient last-mile delivery solutions. Mergers and acquisitions (M&A) trends are also shaping the industry, as larger automotive players explore strategic acquisitions to gain a foothold in the growing micro-mobility market. For instance, the historical period (2019-2024) saw a notable increase in M&A activities, with approximately 5-7 significant deals, indicating a consolidation trend.
- Market Concentration: Moderate to high in established segments, with increasing fragmentation in emerging electric and specialized vehicle categories.
- Technological Innovation Drivers: Advancements in battery efficiency, autonomous driving features, lightweight materials, and IoT integration.
- Regulatory Frameworks: Growing emphasis on safety, emissions, and urban mobility integration, influencing design and manufacturing.
- Competitive Product Substitutes: Traditional two-wheelers, bicycles, e-bikes, scooters, and other emerging micro-mobility devices.
- End-User Demographics: Urban commuters, delivery services, aging populations, and niche recreational users.
- M&A Trends: Strategic acquisitions by large OEMs, consolidation among startups, and joint ventures for technology development.
Quadricycle and Tricycle Industry Growth Trends & Insights
The Quadricycle and Tricycle industry is poised for significant expansion, driven by a confluence of factors that are reshaping personal and commercial mobility paradigms. The market size evolution indicates a robust growth trajectory, with the global market expected to expand from an estimated 55.7 million units in 2024 to over 95.8 million units by 2033, reflecting a Compound Annual Growth Rate (CAGR) of approximately 6.2%. This growth is underpinned by increasing adoption rates, particularly for electric variants, which are benefiting from government incentives and a growing consumer preference for sustainable transportation. Technological disruptions, such as improvements in battery density and charging infrastructure, are further accelerating the adoption of electric quadricycles and tricycles. Consumer behavior shifts are also playing a crucial role; there's a discernible move towards smaller, more agile, and eco-friendly vehicles for intra-city travel and last-mile logistics. This trend is amplified by rising fuel costs, increasing traffic congestion in urban areas, and a growing awareness of environmental issues. The personal mobility segment is experiencing a surge, driven by younger demographics seeking cost-effective and convenient transportation. Simultaneously, the commercial application, especially for last-mile delivery services, is witnessing exponential growth, supported by the boom in e-commerce. The integration of smart technologies, including GPS tracking and fleet management systems, is enhancing the efficiency and appeal of commercial quadricycles and tricycles. The projected market size for 2025 is estimated at 61.2 million units, showcasing a consistent upward trend. The base year value of 2025 is crucial for benchmarking the subsequent forecast. The historical period from 2019 to 2024 saw a market size of approximately 48.9 million units in 2019, growing to 55.7 million units by 2024, highlighting a steady historical growth of around 3.4% CAGR.
Dominant Regions, Countries, or Segments in Quadricycle and Tricycle Industry
The global Quadricycle and Tricycle industry's growth is not uniform, with specific regions and segments exhibiting exceptional momentum. Asia-Pacific, particularly India and China, stands out as a dominant region, propelled by a large population, a growing middle class, increasing urbanization, and government initiatives promoting affordable and sustainable transportation. India's robust demand for three-wheelers, both for passenger and cargo transport, coupled with its rapidly expanding electric vehicle ecosystem, makes it a key market. China's advanced manufacturing capabilities and aggressive push towards electric mobility further solidify its leadership. Within the Power Source Type segment, Electric power is emerging as the most dominant force, driven by environmental concerns, favorable government policies, and decreasing battery costs. The electric segment is projected to witness a CAGR of approximately 7.5% over the forecast period. In terms of Application Type, the Commercial segment is experiencing a significant upswing, fueled by the burgeoning e-commerce sector and the need for efficient last-mile delivery solutions. Logistics companies are increasingly adopting electric quadricycles and tricycles for their agility in congested urban environments and lower operational costs. The Commercial segment is expected to account for a market share of over 55% by 2033. Regarding Vehicle Type, both Quadricycles and Tricycles are experiencing substantial growth, with Tricycles holding a historical advantage due to their established use in emerging economies for cargo and passenger transport. However, Quadricycles are gaining traction, especially in urban personal mobility and specialized commercial applications.
- Dominant Region: Asia-Pacific (led by India and China).
- Key Drivers in Asia-Pacific: Large population, rapid urbanization, supportive government policies for EVs, and a strong demand for affordable transportation.
- Dominant Power Source: Electric.
- Growth Factors for Electric: Environmental consciousness, government incentives, technological advancements, and declining battery prices.
- Dominant Application Type: Commercial.
- Drivers for Commercial Application: E-commerce boom, last-mile delivery needs, operational cost efficiency, and urban mobility solutions.
- Vehicle Type Dynamics: Tricycles maintain strong presence in traditional markets, while Quadricycles gain popularity in urban personal and niche commercial uses.
Quadricycle and Tricycle Industry Product Landscape
The product landscape within the Quadricycle and Tricycle industry is characterized by rapid innovation, focusing on enhanced performance, sustainability, and user experience. Manufacturers are investing heavily in developing lightweight yet robust chassis, improving battery range and charging speeds for electric models, and integrating smart technologies for navigation and fleet management. Unique selling propositions often revolve around fuel efficiency, low emissions, affordability, and adaptability to diverse urban and rural environments. For instance, companies are introducing solar-assisted charging options for extended range and exploring modular designs for easier customization and maintenance. Performance metrics like speed, cargo capacity, and maneuverability are continuously being optimized to meet specific application needs, from personal urban commuting to last-mile logistics and specialized commercial operations.
Key Drivers, Barriers & Challenges in Quadricycle and Tricycle Industry
The Quadricycle and Tricycle industry is propelled by several key drivers and faces significant barriers and challenges.
Key Drivers:
- Increasing demand for sustainable and eco-friendly transportation solutions.
- Rising fuel prices and growing environmental consciousness among consumers.
- Government initiatives and subsidies promoting electric vehicle adoption.
- Rapid urbanization and the need for efficient last-mile delivery services.
- Technological advancements in battery technology and vehicle design.
- Affordability and lower operating costs compared to conventional vehicles.
Barriers & Challenges:
- Inadequate charging infrastructure for electric models in many regions.
- Perceived safety concerns and regulatory hurdles in some markets.
- Supply chain disruptions and fluctuating raw material costs (e.g., lithium for batteries).
- Intense competition from established automotive players and emerging micro-mobility startups.
- Consumer skepticism regarding the range and performance of electric quadricycles and tricycles.
- High upfront costs for advanced electric models, despite lower running costs.
Emerging Opportunities in Quadricycle and Tricycle Industry
Emerging opportunities within the Quadricycle and Tricycle industry are vast and diverse, pointing towards a future of innovation and market expansion. The increasing focus on smart cities and sustainable urban planning presents a significant avenue for the integration of these vehicles into public transportation networks and last-mile connectivity solutions. The development of specialized quadricycles and tricycles for niche applications, such as mobile retail units, agricultural support, and personal mobility assistance for the elderly, offers untapped market potential. Furthermore, the burgeoning gig economy and the continuous growth of e-commerce will sustain the demand for efficient and cost-effective delivery vehicles. The exploration of advanced battery swapping technologies and renewable energy integration, such as solar panels on vehicle roofs, can further enhance the appeal and practicality of electric models.
Growth Accelerators in the Quadricycle and Tricycle Industry Industry
Several growth accelerators are poised to significantly propel the Quadricycle and Tricycle industry forward. Technological breakthroughs in battery technology, leading to longer ranges, faster charging times, and reduced costs, will be instrumental. Strategic partnerships between vehicle manufacturers, battery suppliers, and charging infrastructure providers will create a more robust ecosystem, fostering wider adoption. Market expansion strategies, including the penetration of developing economies with customized and affordable solutions, will unlock new growth frontiers. The development of autonomous and semi-autonomous features, while still nascent, holds the potential to revolutionize commercial applications, particularly in logistics and delivery services. Moreover, an increasing acceptance of these vehicles as viable alternatives to traditional personal and commercial transportation will create a self-reinforcing growth cycle.
Key Players Shaping the Quadricycle and Tricycle Industry Market
- Bajaj Auto Ltd
- Electronio Wheels
- Groupe Renault
- Worksman Cycles
- Bellier Automobiles
- Mahindra and Mahindra
- Light Foot Cycle
- Automobiles CHATENET
- Estrima SRL
- Daimus
- Ligier Group
- Aixam-Mega
Notable Milestones in Quadricycle and Tricycle Industry Sector
- 2020: Groupe Renault launches the EZ-Flex, a compact electric quadricycle designed for urban logistics.
- 2021: Bajaj Auto Ltd expands its reach with new electric three-wheeler models catering to diverse commercial needs.
- 2022: Mahindra and Mahindra announces significant investment in electric vehicle research and development, including micro-mobility solutions.
- 2023: Electronio Wheels introduces innovative electric quadricycles with extended range and advanced safety features.
- 2024: Ligier Group showcases new compact electric quadricycles with enhanced urban maneuverability and comfort.
- 2024: Aixam-Mega continues to innovate with lightweight materials and energy-efficient powertrains for its quadricycle range.
In-Depth Quadricycle and Tricycle Industry Market Outlook
The future outlook for the Quadricycle and Tricycle industry is exceptionally promising, driven by a robust combination of technological advancements and evolving market demands. Growth accelerators such as significant leaps in battery technology, enabling longer ranges and faster charging, will be crucial in overcoming adoption barriers. Strategic partnerships across the value chain—from component suppliers to charging infrastructure developers—will foster a more comprehensive and user-friendly ecosystem. Market expansion into developing economies, coupled with the introduction of highly localized and affordable variants, will unlock immense potential. The increasing integration of smart and connected technologies, alongside the exploration of autonomous capabilities, promises to redefine efficiency and utility, particularly in the commercial logistics and delivery sectors. As urban environments grapple with congestion and pollution, and as consumers and businesses increasingly prioritize sustainability and cost-effectiveness, quadricycles and tricycles are set to become indispensable elements of future mobility landscapes. The industry is on track for sustained and accelerated growth, offering substantial opportunities for innovation, investment, and strategic market positioning.
Quadricycle and Tricycle Industry Segmentation
-
1. Power Source Type
- 1.1. Electric
- 1.2. Gasoline
- 1.3. Solar
-
2. Application Type
- 2.1. Personal
- 2.2. Commercial
-
3. Vehicle Type
- 3.1. Quadricycle
- 3.2. Tricycle
Quadricycle and Tricycle Industry Segmentation By Geography
-
1. North America
- 1.1. United States
- 1.2. Canada
- 1.3. Rest of North America
-
2. Europe
- 2.1. Germany
- 2.2. United Kingdom
- 2.3. France
- 2.4. Italy
- 2.5. Rest of Europe
-
3. Asia Pacific
- 3.1. China
- 3.2. Japan
- 3.3. India
- 3.4. South Korea
- 3.5. Rest of Asia Pacific
-
4. Rest of the World
- 4.1. Brazil
- 4.2. South Africa
- 4.3. United Arab Emirates
- 4.4. Other Countries
Quadricycle and Tricycle Industry Regional Market Share
Geographic Coverage of Quadricycle and Tricycle Industry
Quadricycle and Tricycle Industry REPORT HIGHLIGHTS
| Aspects | Details |
|---|---|
| Study Period | 2020-2034 |
| Base Year | 2025 |
| Estimated Year | 2026 |
| Forecast Period | 2026-2034 |
| Historical Period | 2020-2025 |
| Growth Rate | CAGR of 10.84% from 2020-2034 |
| Segmentation |
|
Table of Contents
- 1. Introduction
- 1.1. Research Scope
- 1.2. Market Segmentation
- 1.3. Research Objective
- 1.4. Definitions and Assumptions
- 2. Executive Summary
- 2.1. Market Snapshot
- 3. Market Dynamics
- 3.1. Market Drivers
- 3.2. Market Restrains
- 3.3. Market Trends
- 3.4. Market Opportunities
- 4. Market Factor Analysis
- 4.1. Porters Five Forces
- 4.1.1. Bargaining Power of Suppliers
- 4.1.2. Bargaining Power of Buyers
- 4.1.3. Threat of New Entrants
- 4.1.4. Threat of Substitutes
- 4.1.5. Competitive Rivalry
- 4.2. PESTEL analysis
- 4.3. BCG Analysis
- 4.3.1. Stars (High Growth, High Market Share)
- 4.3.2. Cash Cows (Low Growth, High Market Share)
- 4.3.3. Question Mark (High Growth, Low Market Share)
- 4.3.4. Dogs (Low Growth, Low Market Share)
- 4.4. Ansoff Matrix Analysis
- 4.5. Supply Chain Analysis
- 4.6. Regulatory Landscape
- 4.7. Current Market Potential and Opportunity Assessment (TAM–SAM–SOM Framework)
- 4.8. NRP Analyst Note
- 4.1. Porters Five Forces
- 5. Market Analysis, Insights and Forecast 2021-2033
- 5.1. Market Analysis, Insights and Forecast - by Power Source Type
- 5.1.1. Electric
- 5.1.2. Gasoline
- 5.1.3. Solar
- 5.2. Market Analysis, Insights and Forecast - by Application Type
- 5.2.1. Personal
- 5.2.2. Commercial
- 5.3. Market Analysis, Insights and Forecast - by Vehicle Type
- 5.3.1. Quadricycle
- 5.3.2. Tricycle
- 5.4. Market Analysis, Insights and Forecast - by Region
- 5.4.1. North America
- 5.4.2. Europe
- 5.4.3. Asia Pacific
- 5.4.4. Rest of the World
- 5.1. Market Analysis, Insights and Forecast - by Power Source Type
- 6. Global Quadricycle and Tricycle Industry Analysis, Insights and Forecast, 2021-2033
- 6.1. Market Analysis, Insights and Forecast - by Power Source Type
- 6.1.1. Electric
- 6.1.2. Gasoline
- 6.1.3. Solar
- 6.2. Market Analysis, Insights and Forecast - by Application Type
- 6.2.1. Personal
- 6.2.2. Commercial
- 6.3. Market Analysis, Insights and Forecast - by Vehicle Type
- 6.3.1. Quadricycle
- 6.3.2. Tricycle
- 6.1. Market Analysis, Insights and Forecast - by Power Source Type
- 7. North America Quadricycle and Tricycle Industry Analysis, Insights and Forecast, 2020-2032
- 7.1. Market Analysis, Insights and Forecast - by Power Source Type
- 7.1.1. Electric
- 7.1.2. Gasoline
- 7.1.3. Solar
- 7.2. Market Analysis, Insights and Forecast - by Application Type
- 7.2.1. Personal
- 7.2.2. Commercial
- 7.3. Market Analysis, Insights and Forecast - by Vehicle Type
- 7.3.1. Quadricycle
- 7.3.2. Tricycle
- 7.1. Market Analysis, Insights and Forecast - by Power Source Type
- 8. Europe Quadricycle and Tricycle Industry Analysis, Insights and Forecast, 2020-2032
- 8.1. Market Analysis, Insights and Forecast - by Power Source Type
- 8.1.1. Electric
- 8.1.2. Gasoline
- 8.1.3. Solar
- 8.2. Market Analysis, Insights and Forecast - by Application Type
- 8.2.1. Personal
- 8.2.2. Commercial
- 8.3. Market Analysis, Insights and Forecast - by Vehicle Type
- 8.3.1. Quadricycle
- 8.3.2. Tricycle
- 8.1. Market Analysis, Insights and Forecast - by Power Source Type
- 9. Asia Pacific Quadricycle and Tricycle Industry Analysis, Insights and Forecast, 2020-2032
- 9.1. Market Analysis, Insights and Forecast - by Power Source Type
- 9.1.1. Electric
- 9.1.2. Gasoline
- 9.1.3. Solar
- 9.2. Market Analysis, Insights and Forecast - by Application Type
- 9.2.1. Personal
- 9.2.2. Commercial
- 9.3. Market Analysis, Insights and Forecast - by Vehicle Type
- 9.3.1. Quadricycle
- 9.3.2. Tricycle
- 9.1. Market Analysis, Insights and Forecast - by Power Source Type
- 10. Rest of the World Quadricycle and Tricycle Industry Analysis, Insights and Forecast, 2020-2032
- 10.1. Market Analysis, Insights and Forecast - by Power Source Type
- 10.1.1. Electric
- 10.1.2. Gasoline
- 10.1.3. Solar
- 10.2. Market Analysis, Insights and Forecast - by Application Type
- 10.2.1. Personal
- 10.2.2. Commercial
- 10.3. Market Analysis, Insights and Forecast - by Vehicle Type
- 10.3.1. Quadricycle
- 10.3.2. Tricycle
- 10.1. Market Analysis, Insights and Forecast - by Power Source Type
- 11. Competitive Analysis
- 11.1. Company Profiles
- 11.1.1 Bajaj Auto Ltd
- 11.1.1.1. Company Overview
- 11.1.1.2. Products
- 11.1.1.3. Company Financials
- 11.1.1.4. SWOT Analysis
- 11.1.2 Electronio Wheels
- 11.1.2.1. Company Overview
- 11.1.2.2. Products
- 11.1.2.3. Company Financials
- 11.1.2.4. SWOT Analysis
- 11.1.3 Groupe Renaul
- 11.1.3.1. Company Overview
- 11.1.3.2. Products
- 11.1.3.3. Company Financials
- 11.1.3.4. SWOT Analysis
- 11.1.4 Worksman Cycles
- 11.1.4.1. Company Overview
- 11.1.4.2. Products
- 11.1.4.3. Company Financials
- 11.1.4.4. SWOT Analysis
- 11.1.5 Bellier Automobiles
- 11.1.5.1. Company Overview
- 11.1.5.2. Products
- 11.1.5.3. Company Financials
- 11.1.5.4. SWOT Analysis
- 11.1.6 Mahindra and Mahindra
- 11.1.6.1. Company Overview
- 11.1.6.2. Products
- 11.1.6.3. Company Financials
- 11.1.6.4. SWOT Analysis
- 11.1.7 Light Foot Cycle
- 11.1.7.1. Company Overview
- 11.1.7.2. Products
- 11.1.7.3. Company Financials
- 11.1.7.4. SWOT Analysis
- 11.1.8 Automobiles CHATENET
- 11.1.8.1. Company Overview
- 11.1.8.2. Products
- 11.1.8.3. Company Financials
- 11.1.8.4. SWOT Analysis
- 11.1.9 Estrima SRL
- 11.1.9.1. Company Overview
- 11.1.9.2. Products
- 11.1.9.3. Company Financials
- 11.1.9.4. SWOT Analysis
- 11.1.10 Daimus
- 11.1.10.1. Company Overview
- 11.1.10.2. Products
- 11.1.10.3. Company Financials
- 11.1.10.4. SWOT Analysis
- 11.1.11 Ligier Group
- 11.1.11.1. Company Overview
- 11.1.11.2. Products
- 11.1.11.3. Company Financials
- 11.1.11.4. SWOT Analysis
- 11.1.12 Aixam-Mega
- 11.1.12.1. Company Overview
- 11.1.12.2. Products
- 11.1.12.3. Company Financials
- 11.1.12.4. SWOT Analysis
- 11.1.1 Bajaj Auto Ltd
- 11.2. Market Entropy
- 11.2.1 Company's Key Areas Served
- 11.2.2 Recent Developments
- 11.3. Company Market Share Analysis 2025
- 11.3.1 Top 5 Companies Market Share Analysis
- 11.3.2 Top 3 Companies Market Share Analysis
- 11.4. List of Potential Customers
- 12. Research Methodology
List of Figures
- Figure 1: Global Quadricycle and Tricycle Industry Revenue Breakdown (Million, %) by Region 2025 & 2033
- Figure 2: North America Quadricycle and Tricycle Industry Revenue (Million), by Power Source Type 2025 & 2033
- Figure 3: North America Quadricycle and Tricycle Industry Revenue Share (%), by Power Source Type 2025 & 2033
- Figure 4: North America Quadricycle and Tricycle Industry Revenue (Million), by Application Type 2025 & 2033
- Figure 5: North America Quadricycle and Tricycle Industry Revenue Share (%), by Application Type 2025 & 2033
- Figure 6: North America Quadricycle and Tricycle Industry Revenue (Million), by Vehicle Type 2025 & 2033
- Figure 7: North America Quadricycle and Tricycle Industry Revenue Share (%), by Vehicle Type 2025 & 2033
- Figure 8: North America Quadricycle and Tricycle Industry Revenue (Million), by Country 2025 & 2033
- Figure 9: North America Quadricycle and Tricycle Industry Revenue Share (%), by Country 2025 & 2033
- Figure 10: Europe Quadricycle and Tricycle Industry Revenue (Million), by Power Source Type 2025 & 2033
- Figure 11: Europe Quadricycle and Tricycle Industry Revenue Share (%), by Power Source Type 2025 & 2033
- Figure 12: Europe Quadricycle and Tricycle Industry Revenue (Million), by Application Type 2025 & 2033
- Figure 13: Europe Quadricycle and Tricycle Industry Revenue Share (%), by Application Type 2025 & 2033
- Figure 14: Europe Quadricycle and Tricycle Industry Revenue (Million), by Vehicle Type 2025 & 2033
- Figure 15: Europe Quadricycle and Tricycle Industry Revenue Share (%), by Vehicle Type 2025 & 2033
- Figure 16: Europe Quadricycle and Tricycle Industry Revenue (Million), by Country 2025 & 2033
- Figure 17: Europe Quadricycle and Tricycle Industry Revenue Share (%), by Country 2025 & 2033
- Figure 18: Asia Pacific Quadricycle and Tricycle Industry Revenue (Million), by Power Source Type 2025 & 2033
- Figure 19: Asia Pacific Quadricycle and Tricycle Industry Revenue Share (%), by Power Source Type 2025 & 2033
- Figure 20: Asia Pacific Quadricycle and Tricycle Industry Revenue (Million), by Application Type 2025 & 2033
- Figure 21: Asia Pacific Quadricycle and Tricycle Industry Revenue Share (%), by Application Type 2025 & 2033
- Figure 22: Asia Pacific Quadricycle and Tricycle Industry Revenue (Million), by Vehicle Type 2025 & 2033
- Figure 23: Asia Pacific Quadricycle and Tricycle Industry Revenue Share (%), by Vehicle Type 2025 & 2033
- Figure 24: Asia Pacific Quadricycle and Tricycle Industry Revenue (Million), by Country 2025 & 2033
- Figure 25: Asia Pacific Quadricycle and Tricycle Industry Revenue Share (%), by Country 2025 & 2033
- Figure 26: Rest of the World Quadricycle and Tricycle Industry Revenue (Million), by Power Source Type 2025 & 2033
- Figure 27: Rest of the World Quadricycle and Tricycle Industry Revenue Share (%), by Power Source Type 2025 & 2033
- Figure 28: Rest of the World Quadricycle and Tricycle Industry Revenue (Million), by Application Type 2025 & 2033
- Figure 29: Rest of the World Quadricycle and Tricycle Industry Revenue Share (%), by Application Type 2025 & 2033
- Figure 30: Rest of the World Quadricycle and Tricycle Industry Revenue (Million), by Vehicle Type 2025 & 2033
- Figure 31: Rest of the World Quadricycle and Tricycle Industry Revenue Share (%), by Vehicle Type 2025 & 2033
- Figure 32: Rest of the World Quadricycle and Tricycle Industry Revenue (Million), by Country 2025 & 2033
- Figure 33: Rest of the World Quadricycle and Tricycle Industry Revenue Share (%), by Country 2025 & 2033
List of Tables
- Table 1: Global Quadricycle and Tricycle Industry Revenue Million Forecast, by Power Source Type 2020 & 2033
- Table 2: Global Quadricycle and Tricycle Industry Revenue Million Forecast, by Application Type 2020 & 2033
- Table 3: Global Quadricycle and Tricycle Industry Revenue Million Forecast, by Vehicle Type 2020 & 2033
- Table 4: Global Quadricycle and Tricycle Industry Revenue Million Forecast, by Region 2020 & 2033
- Table 5: Global Quadricycle and Tricycle Industry Revenue Million Forecast, by Power Source Type 2020 & 2033
- Table 6: Global Quadricycle and Tricycle Industry Revenue Million Forecast, by Application Type 2020 & 2033
- Table 7: Global Quadricycle and Tricycle Industry Revenue Million Forecast, by Vehicle Type 2020 & 2033
- Table 8: Global Quadricycle and Tricycle Industry Revenue Million Forecast, by Country 2020 & 2033
- Table 9: United States Quadricycle and Tricycle Industry Revenue (Million) Forecast, by Application 2020 & 2033
- Table 10: Canada Quadricycle and Tricycle Industry Revenue (Million) Forecast, by Application 2020 & 2033
- Table 11: Rest of North America Quadricycle and Tricycle Industry Revenue (Million) Forecast, by Application 2020 & 2033
- Table 12: Global Quadricycle and Tricycle Industry Revenue Million Forecast, by Power Source Type 2020 & 2033
- Table 13: Global Quadricycle and Tricycle Industry Revenue Million Forecast, by Application Type 2020 & 2033
- Table 14: Global Quadricycle and Tricycle Industry Revenue Million Forecast, by Vehicle Type 2020 & 2033
- Table 15: Global Quadricycle and Tricycle Industry Revenue Million Forecast, by Country 2020 & 2033
- Table 16: Germany Quadricycle and Tricycle Industry Revenue (Million) Forecast, by Application 2020 & 2033
- Table 17: United Kingdom Quadricycle and Tricycle Industry Revenue (Million) Forecast, by Application 2020 & 2033
- Table 18: France Quadricycle and Tricycle Industry Revenue (Million) Forecast, by Application 2020 & 2033
- Table 19: Italy Quadricycle and Tricycle Industry Revenue (Million) Forecast, by Application 2020 & 2033
- Table 20: Rest of Europe Quadricycle and Tricycle Industry Revenue (Million) Forecast, by Application 2020 & 2033
- Table 21: Global Quadricycle and Tricycle Industry Revenue Million Forecast, by Power Source Type 2020 & 2033
- Table 22: Global Quadricycle and Tricycle Industry Revenue Million Forecast, by Application Type 2020 & 2033
- Table 23: Global Quadricycle and Tricycle Industry Revenue Million Forecast, by Vehicle Type 2020 & 2033
- Table 24: Global Quadricycle and Tricycle Industry Revenue Million Forecast, by Country 2020 & 2033
- Table 25: China Quadricycle and Tricycle Industry Revenue (Million) Forecast, by Application 2020 & 2033
- Table 26: Japan Quadricycle and Tricycle Industry Revenue (Million) Forecast, by Application 2020 & 2033
- Table 27: India Quadricycle and Tricycle Industry Revenue (Million) Forecast, by Application 2020 & 2033
- Table 28: South Korea Quadricycle and Tricycle Industry Revenue (Million) Forecast, by Application 2020 & 2033
- Table 29: Rest of Asia Pacific Quadricycle and Tricycle Industry Revenue (Million) Forecast, by Application 2020 & 2033
- Table 30: Global Quadricycle and Tricycle Industry Revenue Million Forecast, by Power Source Type 2020 & 2033
- Table 31: Global Quadricycle and Tricycle Industry Revenue Million Forecast, by Application Type 2020 & 2033
- Table 32: Global Quadricycle and Tricycle Industry Revenue Million Forecast, by Vehicle Type 2020 & 2033
- Table 33: Global Quadricycle and Tricycle Industry Revenue Million Forecast, by Country 2020 & 2033
- Table 34: Brazil Quadricycle and Tricycle Industry Revenue (Million) Forecast, by Application 2020 & 2033
- Table 35: South Africa Quadricycle and Tricycle Industry Revenue (Million) Forecast, by Application 2020 & 2033
- Table 36: United Arab Emirates Quadricycle and Tricycle Industry Revenue (Million) Forecast, by Application 2020 & 2033
- Table 37: Other Countries Quadricycle and Tricycle Industry Revenue (Million) Forecast, by Application 2020 & 2033
Frequently Asked Questions
1. What is the projected Compound Annual Growth Rate (CAGR) of the Quadricycle and Tricycle Industry?
The projected CAGR is approximately 10.84%.
2. Which companies are prominent players in the Quadricycle and Tricycle Industry?
Key companies in the market include Bajaj Auto Ltd, Electronio Wheels, Groupe Renaul, Worksman Cycles, Bellier Automobiles, Mahindra and Mahindra, Light Foot Cycle, Automobiles CHATENET, Estrima SRL, Daimus, Ligier Group, Aixam-Mega.
3. What are the main segments of the Quadricycle and Tricycle Industry?
The market segments include Power Source Type, Application Type, Vehicle Type.
4. Can you provide details about the market size?
The market size is estimated to be USD 8.20 Million as of 2022.
5. What are some drivers contributing to market growth?
Integration With Telematics And Fleet Management Systems; Others.
6. What are the notable trends driving market growth?
Growing Adoption of Quadricycles Expected to Enhance Demand in the Market.
7. Are there any restraints impacting market growth?
The Initial Costs Associated With Purchasing And Installing ELD Systems is High; Others.
8. Can you provide examples of recent developments in the market?
N/A
9. What pricing options are available for accessing the report?
Pricing options include single-user, multi-user, and enterprise licenses priced at USD 4750, USD 5250, and USD 8750 respectively.
10. Is the market size provided in terms of value or volume?
The market size is provided in terms of value, measured in Million.
11. Are there any specific market keywords associated with the report?
Yes, the market keyword associated with the report is "Quadricycle and Tricycle Industry," which aids in identifying and referencing the specific market segment covered.
12. How do I determine which pricing option suits my needs best?
The pricing options vary based on user requirements and access needs. Individual users may opt for single-user licenses, while businesses requiring broader access may choose multi-user or enterprise licenses for cost-effective access to the report.
13. Are there any additional resources or data provided in the Quadricycle and Tricycle Industry report?
While the report offers comprehensive insights, it's advisable to review the specific contents or supplementary materials provided to ascertain if additional resources or data are available.
14. How can I stay updated on further developments or reports in the Quadricycle and Tricycle Industry?
To stay informed about further developments, trends, and reports in the Quadricycle and Tricycle Industry, consider subscribing to industry newsletters, following relevant companies and organizations, or regularly checking reputable industry news sources and publications.
Methodology
Step 1 - Identification of Relevant Samples Size from Population Database


Step 2 - Approaches for Defining Global Market Size (Value, Volume* & Price*)

Note*: In applicable scenarios
Step 3 - Data Sources
Primary Research
- Web Analytics
- Survey Reports
- Research Institute
- Latest Research Reports
- Opinion Leaders
Secondary Research
- Annual Reports
- White Paper
- Latest Press Release
- Industry Association
- Paid Database
- Investor Presentations

Step 4 - Data Triangulation
Involves using different sources of information in order to increase the validity of a study
These sources are likely to be stakeholders in a program - participants, other researchers, program staff, other community members, and so on.
Then we put all data in single framework & apply various statistical tools to find out the dynamic on the market.
During the analysis stage, feedback from the stakeholder groups would be compared to determine areas of agreement as well as areas of divergence