

Key Insights
The silicon nanowire battery market is projected for substantial expansion, driven by escalating demand for enhanced energy density and rapid charging solutions across electric vehicles (EVs), portable electronics, and grid-scale energy storage. With an estimated market size of $487.3 million in the base year 2025, the market is forecasted to achieve a Compound Annual Growth Rate (CAGR) of 18.3% from 2025 to 2033. This significant growth is underpinned by ongoing research and development aimed at improving the stability and longevity of silicon nanowire batteries, thereby overcoming limitations of conventional lithium-ion technology. Key growth catalysts include the burgeoning electric vehicle sector, increased adoption of renewable energy necessitating efficient storage, and the demand for portable devices with extended battery performance. Despite existing hurdles like high production costs and scalability challenges, ongoing technological innovations and escalating investments are poised to address these constraints. Prominent companies such as Amprius Technologies and Tesla are at the forefront of technological advancement, fostering a competitive and dynamic market environment. The market is segmented by battery type (anode, electrolyte), application (EVs, consumer electronics, grid storage), and geographic region (North America, Europe, Asia-Pacific, etc.).
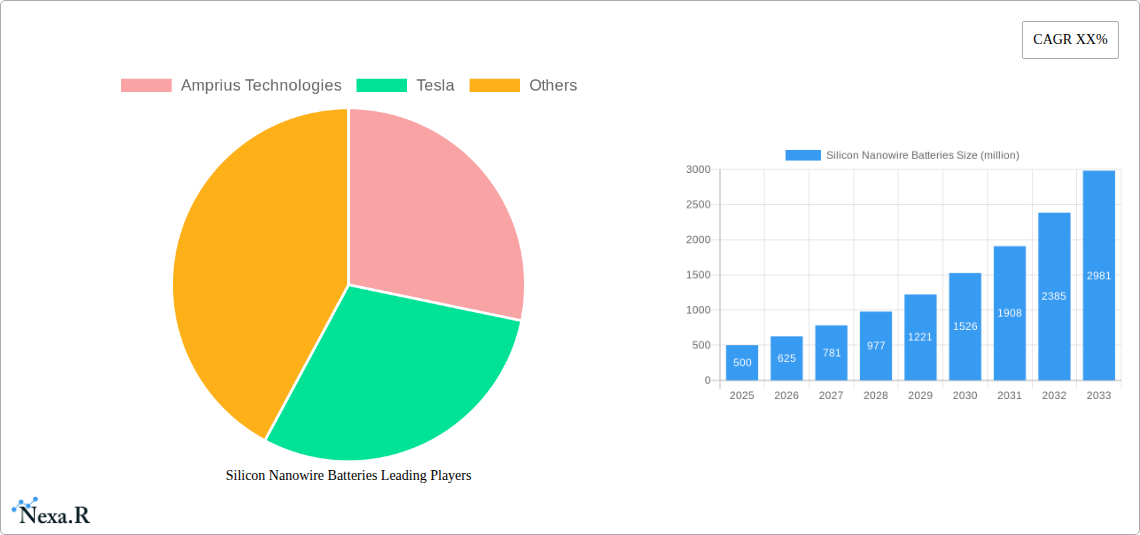
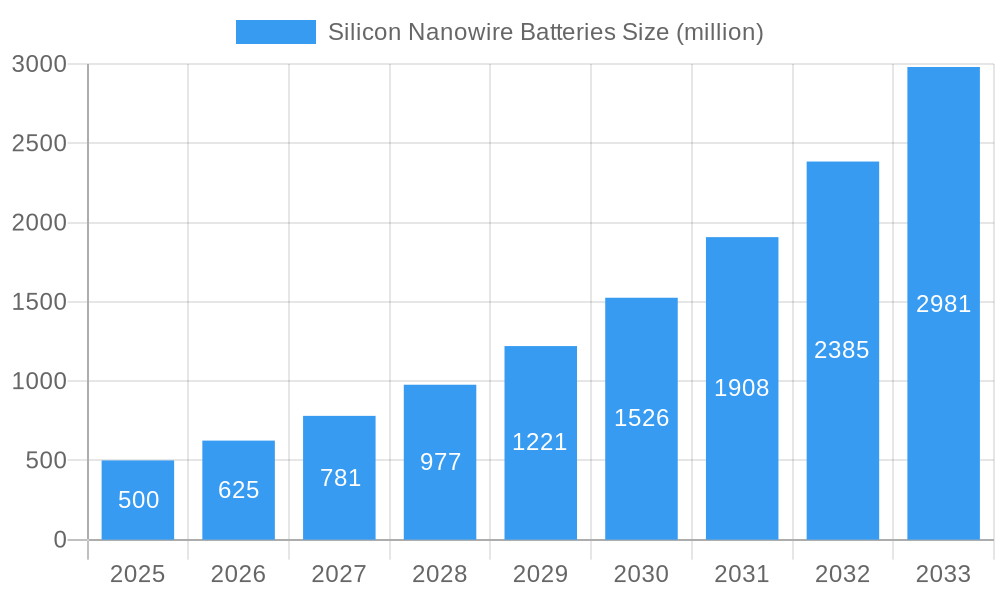
Silicon Nanowire Batteries Market Size (In Million)
The forecast period (2025-2033) predicts a significant upswing in the silicon nanowire battery market. Continuous miniaturization trends in electronics and a strong focus on sustainable energy solutions will further accelerate market growth. Advancements in cycle life, energy density, and safety will be pivotal for market adoption. Geographic adoption rates are expected to vary, with the Asia-Pacific region anticipated to lead growth due to rapid expansion in the EV and electronics industries. Competitive dynamics will be shaped by persistent innovation, strategic alliances, and mergers and acquisitions within the silicon nanowire battery manufacturing sector.
Silicon Nanowire Batteries Company Market Share
Silicon Nanowire Batteries Market Report: 2019-2033
This comprehensive report provides an in-depth analysis of the burgeoning Silicon Nanowire Batteries market, encompassing market dynamics, growth trends, regional dominance, product landscape, challenges, opportunities, and key players. The report covers the period 2019-2033, with a focus on the forecast period 2025-2033, and leverages extensive data analysis to deliver actionable insights for industry professionals, investors, and strategic decision-makers. This report analyzes the parent market of energy storage solutions and the child market of advanced battery technologies.
Silicon Nanowire Batteries Market Dynamics & Structure
This section analyzes the competitive landscape, technological advancements, regulatory influences, and market trends within the silicon nanowire battery sector. The study period is 2019-2024, with 2025 as the base and estimated year. The forecast period is 2025-2033. The global market size in 2025 is estimated at $xx million.
- Market Concentration: The market is currently characterized by a relatively low concentration, with several emerging players and established companies competing for market share. The top three players (including Amprius Technologies and Tesla) collectively hold an estimated xx% market share in 2025.
- Technological Innovation: Significant R&D efforts are focused on enhancing energy density, cycle life, and safety features of silicon nanowire batteries, driving innovation. Key innovations include improved electrode design and electrolyte formulations.
- Regulatory Frameworks: Government regulations and incentives promoting the adoption of advanced battery technologies are creating favorable conditions for market growth. However, evolving safety standards pose challenges to market expansion.
- Competitive Product Substitutes: Lithium-ion batteries remain the dominant technology, but silicon nanowire batteries offer potential advantages in terms of energy density, posing a competitive threat.
- End-User Demographics: The primary end-users include the electric vehicle (EV), consumer electronics, and grid storage sectors. The growth of the EV market is expected to significantly drive demand for silicon nanowire batteries.
- M&A Trends: The number of mergers and acquisitions (M&A) deals in the sector is expected to increase during the forecast period, driven by the need for technology consolidation and market expansion. An estimated xx M&A deals are projected during 2025-2033.
Silicon Nanowire Batteries Growth Trends & Insights
This section provides a comprehensive analysis of the market size evolution, adoption rates, and technological disruptions impacting the silicon nanowire battery market. The Compound Annual Growth Rate (CAGR) during the forecast period (2025-2033) is projected to be xx%. Market penetration is expected to reach xx% by 2033. The analysis incorporates qualitative factors such as consumer preference for improved battery performance and environmental concerns, alongside quantitative data such as market size and adoption rates.
The increasing demand for higher energy density batteries from the burgeoning EV sector is a major catalyst for growth. Technological advancements are driving increased adoption. Market penetration is likely to be affected by challenges such as high production costs, but government incentives and technological breakthroughs will mitigate these factors. Consumer behavior shifts towards environmentally friendly products are also contributing to market growth.
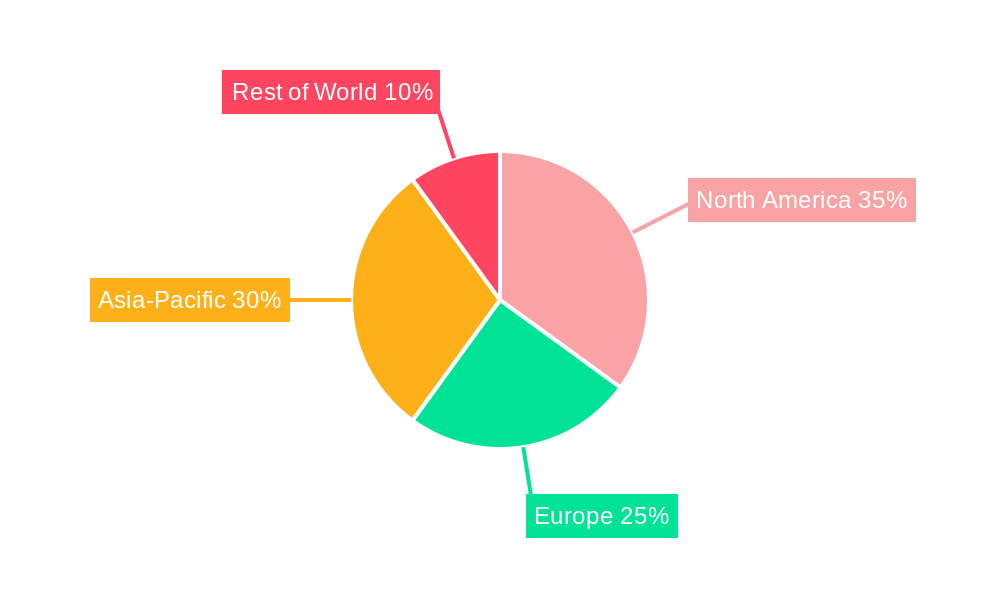
Dominant Regions, Countries, or Segments in Silicon Nanowire Batteries
This section identifies the leading regions and segments driving market growth. The analysis focuses on market share and growth potential in different geographic locations, considering economic policies, infrastructure development, and other factors. Asia-Pacific is projected to hold the largest market share in 2025, driven by significant EV adoption and government support for advanced battery technologies.
- Key Drivers for Asia-Pacific:
- Strong government support for electric vehicle manufacturing and adoption.
- Rapid growth of the consumer electronics market.
- Well-established manufacturing infrastructure.
- North America Market Dynamics: North America's market growth will be driven by increasing demand for high energy density batteries, specifically for electric vehicles and grid storage applications.
- Europe's Market Growth: Stringent emission regulations and robust government support for renewable energy technologies are expected to accelerate market growth in Europe.
Silicon Nanowire Batteries Product Landscape
Silicon nanowire batteries offer superior energy density compared to traditional lithium-ion batteries. Ongoing research and development focuses on improving cycle life, safety, and cost-effectiveness. Advancements in nanomaterials and electrode design are continuously enhancing performance metrics. Unique selling propositions include higher energy density and faster charging capabilities, making them highly desirable for various applications.
Key Drivers, Barriers & Challenges in Silicon Nanowire Batteries
Key Drivers: The primary drivers include the growing demand for higher energy density batteries from electric vehicles and portable electronics. Government incentives for renewable energy storage and technological breakthroughs in nanomaterial synthesis are further accelerating market growth.
Key Challenges: High production costs, limited scalability, and challenges in achieving long cycle life remain significant barriers. Supply chain disruptions impacting the availability of raw materials could also impact market growth. Regulatory hurdles and competition from established battery technologies also pose significant challenges. The projected impact of these challenges on market growth is estimated at xx% reduction in the overall CAGR over the forecast period.
Emerging Opportunities in Silicon Nanowire Batteries
Emerging opportunities lie in the expansion into new application areas, including grid-scale energy storage and wearable electronics. The development of next-generation silicon nanowire materials and manufacturing processes will unlock further growth potential. Exploring new markets and strategic partnerships can enhance market reach and profitability.
Growth Accelerators in the Silicon Nanowire Batteries Industry
Technological breakthroughs in materials science and manufacturing processes are key growth accelerators. Strategic partnerships and collaborations between industry players, research institutions, and governments are crucial for fostering innovation. Expanding into new applications and geographical markets also plays a key role.
Key Players Shaping the Silicon Nanowire Batteries Market
- Amprius Technologies
- Tesla
Notable Milestones in Silicon Nanowire Batteries Sector
- 2020: Amprius Technologies announces a breakthrough in silicon nanowire battery technology, significantly increasing energy density.
- 2022: Tesla patents a new silicon nanowire anode design for improved battery performance.
- 2023: A major research institution publishes findings on a new electrolyte formulation for silicon nanowire batteries, enhancing safety and cycle life. (Further milestones to be added as data becomes available)
In-Depth Silicon Nanowire Batteries Market Outlook
The silicon nanowire battery market is poised for significant growth over the next decade. Continued technological advancements, increasing demand from the electric vehicle and energy storage sectors, and supportive government policies will drive market expansion. Strategic investments in R&D and innovative manufacturing techniques are vital for capturing market share and achieving long-term profitability. The market presents significant opportunities for both established players and emerging companies.
Silicon Nanowire Batteries Segmentation
-
1. Application
- 1.1. Automotive
- 1.2. Electronics
-
2. Types
- 2.1. 1
- 2.2. Not 100%
Silicon Nanowire Batteries Segmentation By Geography
-
1. North America
- 1.1. United States
- 1.2. Canada
- 1.3. Mexico
-
2. South America
- 2.1. Brazil
- 2.2. Argentina
- 2.3. Rest of South America
-
3. Europe
- 3.1. United Kingdom
- 3.2. Germany
- 3.3. France
- 3.4. Italy
- 3.5. Spain
- 3.6. Russia
- 3.7. Benelux
- 3.8. Nordics
- 3.9. Rest of Europe
-
4. Middle East & Africa
- 4.1. Turkey
- 4.2. Israel
- 4.3. GCC
- 4.4. North Africa
- 4.5. South Africa
- 4.6. Rest of Middle East & Africa
-
5. Asia Pacific
- 5.1. China
- 5.2. India
- 5.3. Japan
- 5.4. South Korea
- 5.5. ASEAN
- 5.6. Oceania
- 5.7. Rest of Asia Pacific
Silicon Nanowire Batteries Regional Market Share
Geographic Coverage of Silicon Nanowire Batteries
Silicon Nanowire Batteries REPORT HIGHLIGHTS
| Aspects | Details |
|---|---|
| Study Period | 2020-2034 |
| Base Year | 2025 |
| Estimated Year | 2026 |
| Forecast Period | 2026-2034 |
| Historical Period | 2020-2025 |
| Growth Rate | CAGR of 18.3% from 2020-2034 |
| Segmentation |
|
Table of Contents
- 1. Introduction
- 1.1. Research Scope
- 1.2. Market Segmentation
- 1.3. Research Methodology
- 1.4. Definitions and Assumptions
- 2. Executive Summary
- 2.1. Introduction
- 3. Market Dynamics
- 3.1. Introduction
- 3.2. Market Drivers
- 3.3. Market Restrains
- 3.4. Market Trends
- 4. Market Factor Analysis
- 4.1. Porters Five Forces
- 4.2. Supply/Value Chain
- 4.3. PESTEL analysis
- 4.4. Market Entropy
- 4.5. Patent/Trademark Analysis
- 5. Global Silicon Nanowire Batteries Analysis, Insights and Forecast, 2020-2032
- 5.1. Market Analysis, Insights and Forecast - by Application
- 5.1.1. Automotive
- 5.1.2. Electronics
- 5.2. Market Analysis, Insights and Forecast - by Types
- 5.2.1. 1
- 5.2.2. Not 100%
- 5.3. Market Analysis, Insights and Forecast - by Region
- 5.3.1. North America
- 5.3.2. South America
- 5.3.3. Europe
- 5.3.4. Middle East & Africa
- 5.3.5. Asia Pacific
- 5.1. Market Analysis, Insights and Forecast - by Application
- 6. North America Silicon Nanowire Batteries Analysis, Insights and Forecast, 2020-2032
- 6.1. Market Analysis, Insights and Forecast - by Application
- 6.1.1. Automotive
- 6.1.2. Electronics
- 6.2. Market Analysis, Insights and Forecast - by Types
- 6.2.1. 1
- 6.2.2. Not 100%
- 6.1. Market Analysis, Insights and Forecast - by Application
- 7. South America Silicon Nanowire Batteries Analysis, Insights and Forecast, 2020-2032
- 7.1. Market Analysis, Insights and Forecast - by Application
- 7.1.1. Automotive
- 7.1.2. Electronics
- 7.2. Market Analysis, Insights and Forecast - by Types
- 7.2.1. 1
- 7.2.2. Not 100%
- 7.1. Market Analysis, Insights and Forecast - by Application
- 8. Europe Silicon Nanowire Batteries Analysis, Insights and Forecast, 2020-2032
- 8.1. Market Analysis, Insights and Forecast - by Application
- 8.1.1. Automotive
- 8.1.2. Electronics
- 8.2. Market Analysis, Insights and Forecast - by Types
- 8.2.1. 1
- 8.2.2. Not 100%
- 8.1. Market Analysis, Insights and Forecast - by Application
- 9. Middle East & Africa Silicon Nanowire Batteries Analysis, Insights and Forecast, 2020-2032
- 9.1. Market Analysis, Insights and Forecast - by Application
- 9.1.1. Automotive
- 9.1.2. Electronics
- 9.2. Market Analysis, Insights and Forecast - by Types
- 9.2.1. 1
- 9.2.2. Not 100%
- 9.1. Market Analysis, Insights and Forecast - by Application
- 10. Asia Pacific Silicon Nanowire Batteries Analysis, Insights and Forecast, 2020-2032
- 10.1. Market Analysis, Insights and Forecast - by Application
- 10.1.1. Automotive
- 10.1.2. Electronics
- 10.2. Market Analysis, Insights and Forecast - by Types
- 10.2.1. 1
- 10.2.2. Not 100%
- 10.1. Market Analysis, Insights and Forecast - by Application
- 11. Competitive Analysis
- 11.1. Global Market Share Analysis 2025
- 11.2. Company Profiles
- 11.2.1 Amprius Technologies
- 11.2.1.1. Overview
- 11.2.1.2. Products
- 11.2.1.3. SWOT Analysis
- 11.2.1.4. Recent Developments
- 11.2.1.5. Financials (Based on Availability)
- 11.2.2 Tesla
- 11.2.2.1. Overview
- 11.2.2.2. Products
- 11.2.2.3. SWOT Analysis
- 11.2.2.4. Recent Developments
- 11.2.2.5. Financials (Based on Availability)
- 11.2.1 Amprius Technologies
List of Figures
- Figure 1: Global Silicon Nanowire Batteries Revenue Breakdown (million, %) by Region 2025 & 2033
- Figure 2: North America Silicon Nanowire Batteries Revenue (million), by Application 2025 & 2033
- Figure 3: North America Silicon Nanowire Batteries Revenue Share (%), by Application 2025 & 2033
- Figure 4: North America Silicon Nanowire Batteries Revenue (million), by Types 2025 & 2033
- Figure 5: North America Silicon Nanowire Batteries Revenue Share (%), by Types 2025 & 2033
- Figure 6: North America Silicon Nanowire Batteries Revenue (million), by Country 2025 & 2033
- Figure 7: North America Silicon Nanowire Batteries Revenue Share (%), by Country 2025 & 2033
- Figure 8: South America Silicon Nanowire Batteries Revenue (million), by Application 2025 & 2033
- Figure 9: South America Silicon Nanowire Batteries Revenue Share (%), by Application 2025 & 2033
- Figure 10: South America Silicon Nanowire Batteries Revenue (million), by Types 2025 & 2033
- Figure 11: South America Silicon Nanowire Batteries Revenue Share (%), by Types 2025 & 2033
- Figure 12: South America Silicon Nanowire Batteries Revenue (million), by Country 2025 & 2033
- Figure 13: South America Silicon Nanowire Batteries Revenue Share (%), by Country 2025 & 2033
- Figure 14: Europe Silicon Nanowire Batteries Revenue (million), by Application 2025 & 2033
- Figure 15: Europe Silicon Nanowire Batteries Revenue Share (%), by Application 2025 & 2033
- Figure 16: Europe Silicon Nanowire Batteries Revenue (million), by Types 2025 & 2033
- Figure 17: Europe Silicon Nanowire Batteries Revenue Share (%), by Types 2025 & 2033
- Figure 18: Europe Silicon Nanowire Batteries Revenue (million), by Country 2025 & 2033
- Figure 19: Europe Silicon Nanowire Batteries Revenue Share (%), by Country 2025 & 2033
- Figure 20: Middle East & Africa Silicon Nanowire Batteries Revenue (million), by Application 2025 & 2033
- Figure 21: Middle East & Africa Silicon Nanowire Batteries Revenue Share (%), by Application 2025 & 2033
- Figure 22: Middle East & Africa Silicon Nanowire Batteries Revenue (million), by Types 2025 & 2033
- Figure 23: Middle East & Africa Silicon Nanowire Batteries Revenue Share (%), by Types 2025 & 2033
- Figure 24: Middle East & Africa Silicon Nanowire Batteries Revenue (million), by Country 2025 & 2033
- Figure 25: Middle East & Africa Silicon Nanowire Batteries Revenue Share (%), by Country 2025 & 2033
- Figure 26: Asia Pacific Silicon Nanowire Batteries Revenue (million), by Application 2025 & 2033
- Figure 27: Asia Pacific Silicon Nanowire Batteries Revenue Share (%), by Application 2025 & 2033
- Figure 28: Asia Pacific Silicon Nanowire Batteries Revenue (million), by Types 2025 & 2033
- Figure 29: Asia Pacific Silicon Nanowire Batteries Revenue Share (%), by Types 2025 & 2033
- Figure 30: Asia Pacific Silicon Nanowire Batteries Revenue (million), by Country 2025 & 2033
- Figure 31: Asia Pacific Silicon Nanowire Batteries Revenue Share (%), by Country 2025 & 2033
List of Tables
- Table 1: Global Silicon Nanowire Batteries Revenue million Forecast, by Application 2020 & 2033
- Table 2: Global Silicon Nanowire Batteries Revenue million Forecast, by Types 2020 & 2033
- Table 3: Global Silicon Nanowire Batteries Revenue million Forecast, by Region 2020 & 2033
- Table 4: Global Silicon Nanowire Batteries Revenue million Forecast, by Application 2020 & 2033
- Table 5: Global Silicon Nanowire Batteries Revenue million Forecast, by Types 2020 & 2033
- Table 6: Global Silicon Nanowire Batteries Revenue million Forecast, by Country 2020 & 2033
- Table 7: United States Silicon Nanowire Batteries Revenue (million) Forecast, by Application 2020 & 2033
- Table 8: Canada Silicon Nanowire Batteries Revenue (million) Forecast, by Application 2020 & 2033
- Table 9: Mexico Silicon Nanowire Batteries Revenue (million) Forecast, by Application 2020 & 2033
- Table 10: Global Silicon Nanowire Batteries Revenue million Forecast, by Application 2020 & 2033
- Table 11: Global Silicon Nanowire Batteries Revenue million Forecast, by Types 2020 & 2033
- Table 12: Global Silicon Nanowire Batteries Revenue million Forecast, by Country 2020 & 2033
- Table 13: Brazil Silicon Nanowire Batteries Revenue (million) Forecast, by Application 2020 & 2033
- Table 14: Argentina Silicon Nanowire Batteries Revenue (million) Forecast, by Application 2020 & 2033
- Table 15: Rest of South America Silicon Nanowire Batteries Revenue (million) Forecast, by Application 2020 & 2033
- Table 16: Global Silicon Nanowire Batteries Revenue million Forecast, by Application 2020 & 2033
- Table 17: Global Silicon Nanowire Batteries Revenue million Forecast, by Types 2020 & 2033
- Table 18: Global Silicon Nanowire Batteries Revenue million Forecast, by Country 2020 & 2033
- Table 19: United Kingdom Silicon Nanowire Batteries Revenue (million) Forecast, by Application 2020 & 2033
- Table 20: Germany Silicon Nanowire Batteries Revenue (million) Forecast, by Application 2020 & 2033
- Table 21: France Silicon Nanowire Batteries Revenue (million) Forecast, by Application 2020 & 2033
- Table 22: Italy Silicon Nanowire Batteries Revenue (million) Forecast, by Application 2020 & 2033
- Table 23: Spain Silicon Nanowire Batteries Revenue (million) Forecast, by Application 2020 & 2033
- Table 24: Russia Silicon Nanowire Batteries Revenue (million) Forecast, by Application 2020 & 2033
- Table 25: Benelux Silicon Nanowire Batteries Revenue (million) Forecast, by Application 2020 & 2033
- Table 26: Nordics Silicon Nanowire Batteries Revenue (million) Forecast, by Application 2020 & 2033
- Table 27: Rest of Europe Silicon Nanowire Batteries Revenue (million) Forecast, by Application 2020 & 2033
- Table 28: Global Silicon Nanowire Batteries Revenue million Forecast, by Application 2020 & 2033
- Table 29: Global Silicon Nanowire Batteries Revenue million Forecast, by Types 2020 & 2033
- Table 30: Global Silicon Nanowire Batteries Revenue million Forecast, by Country 2020 & 2033
- Table 31: Turkey Silicon Nanowire Batteries Revenue (million) Forecast, by Application 2020 & 2033
- Table 32: Israel Silicon Nanowire Batteries Revenue (million) Forecast, by Application 2020 & 2033
- Table 33: GCC Silicon Nanowire Batteries Revenue (million) Forecast, by Application 2020 & 2033
- Table 34: North Africa Silicon Nanowire Batteries Revenue (million) Forecast, by Application 2020 & 2033
- Table 35: South Africa Silicon Nanowire Batteries Revenue (million) Forecast, by Application 2020 & 2033
- Table 36: Rest of Middle East & Africa Silicon Nanowire Batteries Revenue (million) Forecast, by Application 2020 & 2033
- Table 37: Global Silicon Nanowire Batteries Revenue million Forecast, by Application 2020 & 2033
- Table 38: Global Silicon Nanowire Batteries Revenue million Forecast, by Types 2020 & 2033
- Table 39: Global Silicon Nanowire Batteries Revenue million Forecast, by Country 2020 & 2033
- Table 40: China Silicon Nanowire Batteries Revenue (million) Forecast, by Application 2020 & 2033
- Table 41: India Silicon Nanowire Batteries Revenue (million) Forecast, by Application 2020 & 2033
- Table 42: Japan Silicon Nanowire Batteries Revenue (million) Forecast, by Application 2020 & 2033
- Table 43: South Korea Silicon Nanowire Batteries Revenue (million) Forecast, by Application 2020 & 2033
- Table 44: ASEAN Silicon Nanowire Batteries Revenue (million) Forecast, by Application 2020 & 2033
- Table 45: Oceania Silicon Nanowire Batteries Revenue (million) Forecast, by Application 2020 & 2033
- Table 46: Rest of Asia Pacific Silicon Nanowire Batteries Revenue (million) Forecast, by Application 2020 & 2033
Frequently Asked Questions
1. What is the projected Compound Annual Growth Rate (CAGR) of the Silicon Nanowire Batteries?
The projected CAGR is approximately 18.3%.
2. Which companies are prominent players in the Silicon Nanowire Batteries?
Key companies in the market include Amprius Technologies, Tesla.
3. What are the main segments of the Silicon Nanowire Batteries?
The market segments include Application, Types.
4. Can you provide details about the market size?
The market size is estimated to be USD 487.3 million as of 2022.
5. What are some drivers contributing to market growth?
N/A
6. What are the notable trends driving market growth?
N/A
7. Are there any restraints impacting market growth?
N/A
8. Can you provide examples of recent developments in the market?
N/A
9. What pricing options are available for accessing the report?
Pricing options include single-user, multi-user, and enterprise licenses priced at USD 4900.00, USD 7350.00, and USD 9800.00 respectively.
10. Is the market size provided in terms of value or volume?
The market size is provided in terms of value, measured in million.
11. Are there any specific market keywords associated with the report?
Yes, the market keyword associated with the report is "Silicon Nanowire Batteries," which aids in identifying and referencing the specific market segment covered.
12. How do I determine which pricing option suits my needs best?
The pricing options vary based on user requirements and access needs. Individual users may opt for single-user licenses, while businesses requiring broader access may choose multi-user or enterprise licenses for cost-effective access to the report.
13. Are there any additional resources or data provided in the Silicon Nanowire Batteries report?
While the report offers comprehensive insights, it's advisable to review the specific contents or supplementary materials provided to ascertain if additional resources or data are available.
14. How can I stay updated on further developments or reports in the Silicon Nanowire Batteries?
To stay informed about further developments, trends, and reports in the Silicon Nanowire Batteries, consider subscribing to industry newsletters, following relevant companies and organizations, or regularly checking reputable industry news sources and publications.
Methodology
Step 1 - Identification of Relevant Samples Size from Population Database


Step 2 - Approaches for Defining Global Market Size (Value, Volume* & Price*)

Note*: In applicable scenarios
Step 3 - Data Sources
Primary Research
- Web Analytics
- Survey Reports
- Research Institute
- Latest Research Reports
- Opinion Leaders
Secondary Research
- Annual Reports
- White Paper
- Latest Press Release
- Industry Association
- Paid Database
- Investor Presentations

Step 4 - Data Triangulation
Involves using different sources of information in order to increase the validity of a study
These sources are likely to be stakeholders in a program - participants, other researchers, program staff, other community members, and so on.
Then we put all data in single framework & apply various statistical tools to find out the dynamic on the market.
During the analysis stage, feedback from the stakeholder groups would be compared to determine areas of agreement as well as areas of divergence