

Key Insights
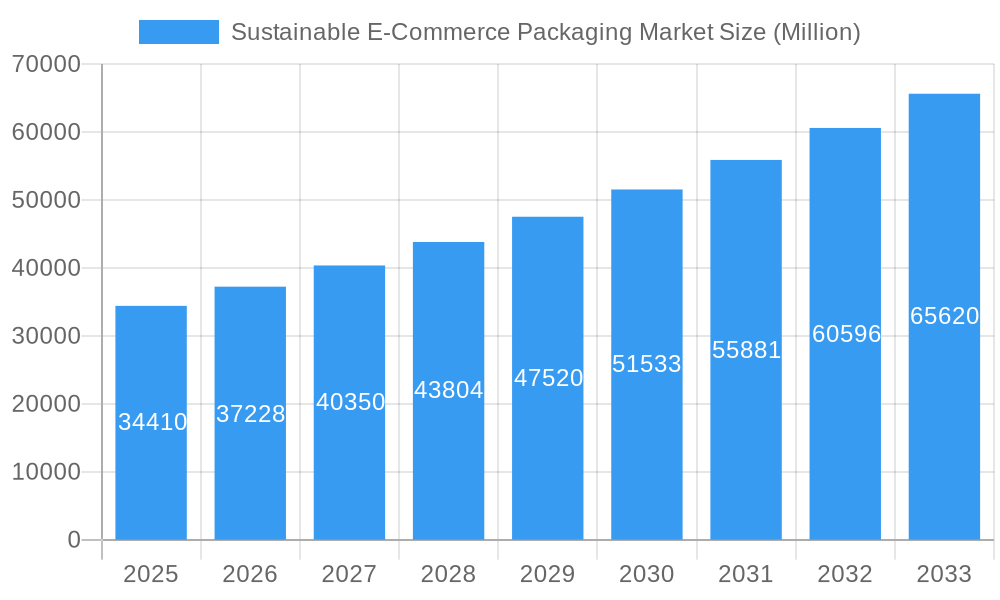
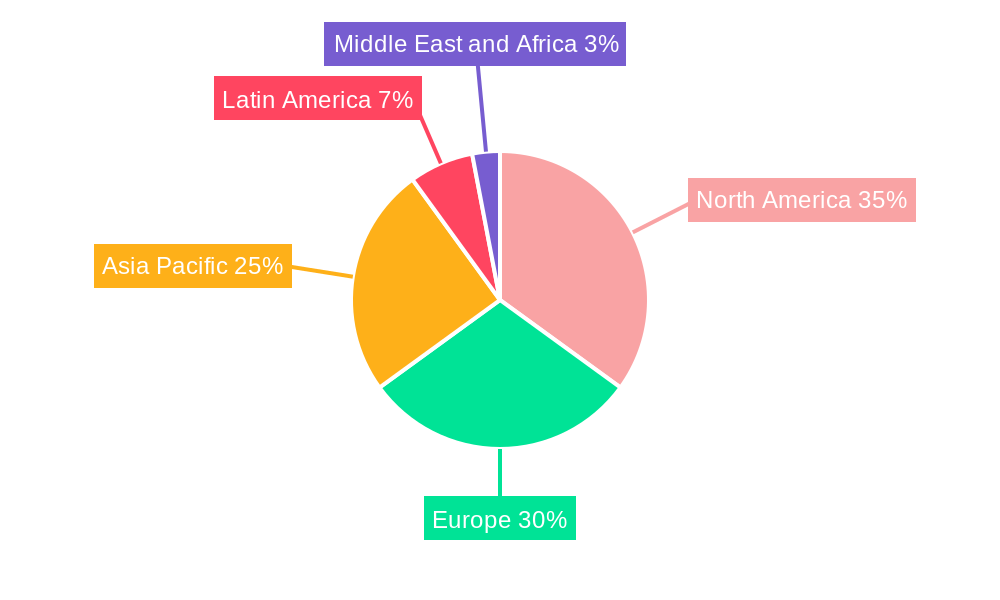
The sustainable e-commerce packaging market, valued at $34.41 billion in 2025, is experiencing robust growth, projected to expand at a compound annual growth rate (CAGR) of 8.12% from 2025 to 2033. This surge is driven by increasing consumer awareness of environmental issues, stricter government regulations on single-use plastics, and a rising demand for eco-friendly alternatives. Key growth segments include sustainable packaging materials like recycled paper and paperboard, biodegradable plastics, and compostable options. The fashion and apparel, consumer electronics, and food and beverage sectors are leading adopters, prioritizing sustainable packaging solutions to enhance their brand image and appeal to environmentally conscious consumers. However, the high initial cost of sustainable packaging materials compared to traditional options and the complexities of maintaining the supply chain's sustainability represent significant challenges. The market's geographical distribution showcases strong growth across North America and Europe, fueled by established e-commerce infrastructure and heightened environmental consciousness. Asia-Pacific is also poised for significant expansion, driven by rapid e-commerce growth and increasing disposable incomes. Competition is intense, with major players like WestRock Company, Amcor Group, DS Smith, and Smurfit Kappa Group constantly innovating to meet growing demand and varying regional needs. This market will benefit from continuous research into innovative, cost-effective, and readily available sustainable packaging solutions.
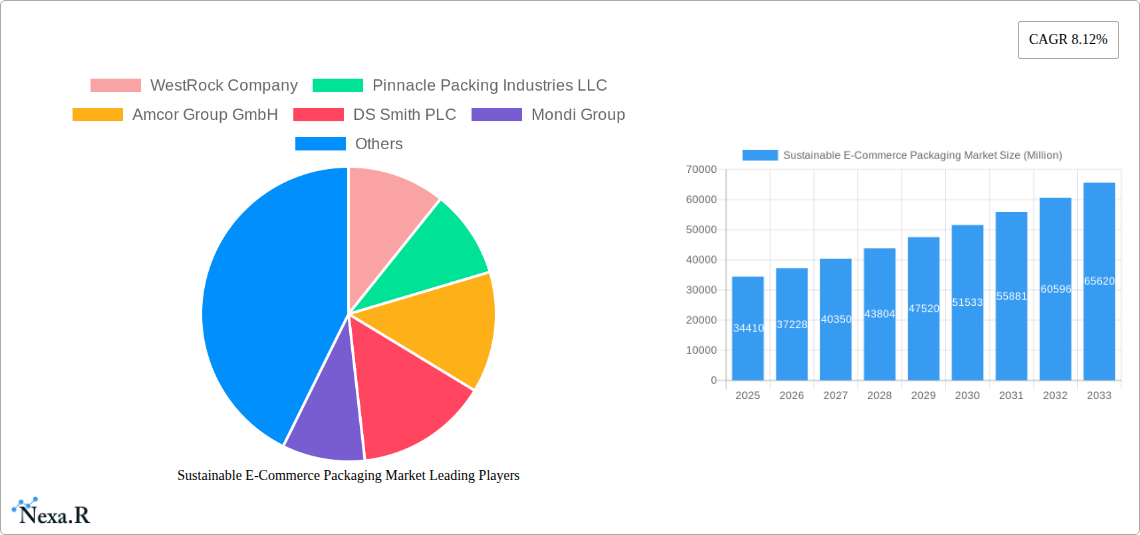
Sustainable E-Commerce Packaging Market Market Size (In Billion)
The forecast period of 2025-2033 anticipates a significant market expansion driven by several factors. The increasing adoption of e-commerce across various sectors continues to fuel demand. Furthermore, advancements in sustainable packaging technology are leading to more efficient and cost-effective solutions. Brand loyalty and a strong emphasis on corporate social responsibility are pushing businesses to adopt sustainable packaging as a crucial marketing strategy. This shift is leading to strategic partnerships and mergers and acquisitions within the industry, allowing companies to expand their market reach and product portfolios. Though challenges remain, the market’s trajectory indicates a promising future for sustainable e-commerce packaging, fueled by consumer demand, technological innovation, and evolving regulations promoting environmental responsibility.
Sustainable E-Commerce Packaging Market Company Market Share
Sustainable E-Commerce Packaging Market: A Comprehensive Report (2019-2033)
This comprehensive report offers an in-depth analysis of the Sustainable E-Commerce Packaging Market, encompassing market dynamics, growth trends, regional dominance, product landscapes, and key players. With a study period spanning 2019-2033 (base year 2025, forecast period 2025-2033), this report provides invaluable insights for businesses, investors, and researchers seeking to navigate this rapidly evolving sector. The market is segmented by material type (plastic, paper and paperboard, metal) and end-user (fashion and apparel, consumer electronics, food and beverage, pharmaceuticals, personal care), offering a granular view of market opportunities. The total market size is projected to reach xx Million units by 2033.
Sustainable E-Commerce Packaging Market Dynamics & Structure
The Sustainable E-Commerce Packaging market is characterized by moderate concentration, with key players like WestRock Company, Pinnacle Packing Industries LLC, Amcor Group GmbH, DS Smith PLC, Mondi Group, Smurfit Kappa Group PLC, H B Fuller Company, Packman Packaging Private Limited, Sealed Air Corporation, and International Paper holding significant market share. However, the market is witnessing increased competition from smaller, specialized firms focusing on innovative, eco-friendly solutions.
- Market Concentration: The top 5 players account for approximately xx% of the market share in 2025.
- Technological Innovation: Drivers include advancements in biodegradable materials, smart packaging solutions, and improved recyclability. Barriers include high initial investment costs and scalability challenges for new technologies.
- Regulatory Frameworks: Growing environmental regulations globally are pushing adoption of sustainable packaging, while inconsistent standards across regions present challenges.
- Competitive Product Substitutes: Traditional packaging materials face increasing pressure from sustainable alternatives, impacting their market share.
- End-User Demographics: The rising consumer demand for eco-friendly products is a major growth driver, particularly among millennials and Gen Z.
- M&A Trends: The market has seen xx M&A deals in the past 5 years, primarily driven by the consolidation of larger players to expand their product portfolio and geographical reach.
Sustainable E-Commerce Packaging Market Growth Trends & Insights
The Sustainable E-Commerce Packaging Market is experiencing robust growth, driven by rising environmental awareness, stringent regulations, and evolving consumer preferences. The market size is projected to expand at a CAGR of xx% during the forecast period. This growth is fueled by increasing e-commerce adoption, a surge in demand for sustainable products, and technological advancements enabling the development of more eco-friendly and efficient packaging solutions. The market penetration rate for sustainable packaging in the e-commerce sector is expected to reach xx% by 2033, up from xx% in 2025. Technological disruptions, such as the development of compostable and biodegradable materials, are further accelerating market expansion. Consumer behavior is shifting towards sustainable choices, with a growing willingness to pay a premium for environmentally friendly products.
Dominant Regions, Countries, or Segments in Sustainable E-Commerce Packaging Market
North America and Europe currently dominate the Sustainable E-Commerce Packaging market, driven by higher environmental awareness, stringent regulations, and established e-commerce infrastructure. However, Asia-Pacific is projected to witness significant growth over the forecast period due to rapidly expanding e-commerce and increasing government support for sustainable initiatives.
By Material Type:
- Paper and Paperboard: This segment holds the largest market share due to its recyclability, biodegradability, and relatively lower cost compared to other sustainable alternatives.
- Plastic: While facing increasing scrutiny, the plastic segment continues to hold a significant share, especially in applications requiring high barrier properties. Innovations in bioplastics are driving growth within this segment.
- Metal: This segment caters to specific applications where high durability and barrier properties are paramount but is limited by its high environmental impact if not properly recycled.
By End User:
- Consumer Electronics: This sector is experiencing rapid growth due to the increasing demand for sustainable packaging solutions for electronic devices.
- Food and Beverage: This segment is experiencing robust growth, with brands increasingly adopting sustainable packaging to meet consumer demand and regulatory requirements.
- Fashion and Apparel: The fashion industry is undergoing a significant shift toward eco-friendly packaging, with brands adopting sustainable materials and minimizing packaging waste.
Sustainable E-Commerce Packaging Market Product Landscape
The Sustainable E-Commerce Packaging market showcases a diverse range of products, from biodegradable mailers and compostable boxes to reusable packaging solutions and innovative protective inserts. Key product innovations include the development of advanced bioplastics, water-based inks, and smart packaging solutions that improve supply chain visibility and reduce waste. These innovations offer enhanced performance metrics, including improved barrier properties, reduced environmental impact, and enhanced recyclability, differentiating them from traditional packaging materials.
Key Drivers, Barriers & Challenges in Sustainable E-Commerce Packaging Market
Key Drivers:
- Rising consumer demand for eco-friendly products.
- Stringent government regulations promoting sustainable packaging.
- Technological advancements in biodegradable and compostable materials.
- Growing adoption of e-commerce, driving demand for efficient packaging solutions.
Challenges and Restraints:
- High initial investment costs associated with adopting sustainable packaging solutions.
- Difficulty in maintaining the same performance level with sustainable packaging compared to traditional materials in certain applications.
- Inconsistent regulatory frameworks across different regions creating complexities in implementation.
- Supply chain disruptions and increased raw material costs impacting the production of sustainable packaging.
Emerging Opportunities in Sustainable E-Commerce Packaging Market
- Growing demand for personalized and customized sustainable packaging.
- Expansion of the market in developing economies with burgeoning e-commerce sectors.
- Development of innovative packaging solutions for sensitive products requiring high protection.
- Increased focus on circular economy models, fostering reuse and recycling initiatives.
Growth Accelerators in the Sustainable E-Commerce Packaging Market Industry
Strategic partnerships between packaging companies and e-commerce giants are driving growth by enabling the adoption of sustainable packaging solutions across broader supply chains. Technological breakthroughs in biodegradable and compostable materials are paving the way for more sustainable options, while expanding into emerging markets presents significant untapped potential.
Key Players Shaping the Sustainable E-Commerce Packaging Market Market
- WestRock Company
- Pinnacle Packing Industries LLC
- Amcor Group GmbH
- DS Smith PLC
- Mondi Group
- Smurfit Kappa Group PLC
- H B Fuller Company
- Packman Packaging Private Limited
- Sealed Air Corporation
- International Paper
Notable Milestones in Sustainable E-Commerce Packaging Market Sector
- June 2023: Mondi expanded its ISTA and APASS certified Performance Lab services, enhancing its capabilities in testing and optimizing sustainable e-commerce packaging.
- April 2024: DS Smith partnered with Jonsac to expand the availability of 100% recyclable, FSC-certified paper bags across Europe, accelerating the shift away from plastic packaging.
In-Depth Sustainable E-Commerce Packaging Market Outlook
The Sustainable E-Commerce Packaging market is poised for substantial growth in the coming years. The ongoing shift towards sustainable consumption, coupled with technological advancements and supportive government policies, will drive market expansion. Companies that invest in R&D, prioritize sustainability, and foster strategic partnerships are well-positioned to capitalize on the numerous opportunities within this dynamic market. The focus on circular economy models and improved recycling infrastructure will further fuel market growth and create significant long-term value.
Sustainable E-Commerce Packaging Market Segmentation
-
1. Material Type
- 1.1. Plastic
- 1.2. Paper and Paper Board
- 1.3. Metal
-
2. End User
- 2.1. Fashion and Apparel
- 2.2. Consumer Electronics
- 2.3. Food and Beverage
- 2.4. Pharmaceuticals
- 2.5. Personal Care
Sustainable E-Commerce Packaging Market Segmentation By Geography
-
1. North America
- 1.1. United States
- 1.2. Canada
-
2. Europe
- 2.1. United Kingdom
- 2.2. Germany
- 2.3. France
- 2.4. Italy
- 2.5. Spain
-
3. Asia Pacific
- 3.1. China
- 3.2. Japan
- 3.3. India
- 3.4. Australia and New Zealand
-
4. Latin America
- 4.1. Brazil
- 4.2. Argentina
- 4.3. Mexico
-
5. Middle East and Africa
- 5.1. Saudi Arabia
- 5.2. United Arab Emirates
- 5.3. South Africa
Sustainable E-Commerce Packaging Market Regional Market Share
Geographic Coverage of Sustainable E-Commerce Packaging Market
Sustainable E-Commerce Packaging Market REPORT HIGHLIGHTS
| Aspects | Details |
|---|---|
| Study Period | 2020-2034 |
| Base Year | 2025 |
| Estimated Year | 2026 |
| Forecast Period | 2026-2034 |
| Historical Period | 2020-2025 |
| Growth Rate | CAGR of 8.12% from 2020-2034 |
| Segmentation |
|
Table of Contents
- 1. Introduction
- 1.1. Research Scope
- 1.2. Market Segmentation
- 1.3. Research Objective
- 1.4. Definitions and Assumptions
- 2. Executive Summary
- 2.1. Market Snapshot
- 3. Market Dynamics
- 3.1. Market Drivers
- 3.2. Market Restrains
- 3.3. Market Trends
- 3.4. Market Opportunities
- 4. Market Factor Analysis
- 4.1. Porters Five Forces
- 4.1.1. Bargaining Power of Suppliers
- 4.1.2. Bargaining Power of Buyers
- 4.1.3. Threat of New Entrants
- 4.1.4. Threat of Substitutes
- 4.1.5. Competitive Rivalry
- 4.2. PESTEL analysis
- 4.3. BCG Analysis
- 4.3.1. Stars (High Growth, High Market Share)
- 4.3.2. Cash Cows (Low Growth, High Market Share)
- 4.3.3. Question Mark (High Growth, Low Market Share)
- 4.3.4. Dogs (Low Growth, Low Market Share)
- 4.4. Ansoff Matrix Analysis
- 4.5. Supply Chain Analysis
- 4.6. Regulatory Landscape
- 4.7. Current Market Potential and Opportunity Assessment (TAM–SAM–SOM Framework)
- 4.8. NRP Analyst Note
- 4.1. Porters Five Forces
- 5. Market Analysis, Insights and Forecast 2021-2033
- 5.1. Market Analysis, Insights and Forecast - by Material Type
- 5.1.1. Plastic
- 5.1.2. Paper and Paper Board
- 5.1.3. Metal
- 5.2. Market Analysis, Insights and Forecast - by End User
- 5.2.1. Fashion and Apparel
- 5.2.2. Consumer Electronics
- 5.2.3. Food and Beverage
- 5.2.4. Pharmaceuticals
- 5.2.5. Personal Care
- 5.3. Market Analysis, Insights and Forecast - by Region
- 5.3.1. North America
- 5.3.2. Europe
- 5.3.3. Asia Pacific
- 5.3.4. Latin America
- 5.3.5. Middle East and Africa
- 5.1. Market Analysis, Insights and Forecast - by Material Type
- 6. Global Sustainable E-Commerce Packaging Market Analysis, Insights and Forecast, 2021-2033
- 6.1. Market Analysis, Insights and Forecast - by Material Type
- 6.1.1. Plastic
- 6.1.2. Paper and Paper Board
- 6.1.3. Metal
- 6.2. Market Analysis, Insights and Forecast - by End User
- 6.2.1. Fashion and Apparel
- 6.2.2. Consumer Electronics
- 6.2.3. Food and Beverage
- 6.2.4. Pharmaceuticals
- 6.2.5. Personal Care
- 6.1. Market Analysis, Insights and Forecast - by Material Type
- 7. North America Sustainable E-Commerce Packaging Market Analysis, Insights and Forecast, 2020-2032
- 7.1. Market Analysis, Insights and Forecast - by Material Type
- 7.1.1. Plastic
- 7.1.2. Paper and Paper Board
- 7.1.3. Metal
- 7.2. Market Analysis, Insights and Forecast - by End User
- 7.2.1. Fashion and Apparel
- 7.2.2. Consumer Electronics
- 7.2.3. Food and Beverage
- 7.2.4. Pharmaceuticals
- 7.2.5. Personal Care
- 7.1. Market Analysis, Insights and Forecast - by Material Type
- 8. Europe Sustainable E-Commerce Packaging Market Analysis, Insights and Forecast, 2020-2032
- 8.1. Market Analysis, Insights and Forecast - by Material Type
- 8.1.1. Plastic
- 8.1.2. Paper and Paper Board
- 8.1.3. Metal
- 8.2. Market Analysis, Insights and Forecast - by End User
- 8.2.1. Fashion and Apparel
- 8.2.2. Consumer Electronics
- 8.2.3. Food and Beverage
- 8.2.4. Pharmaceuticals
- 8.2.5. Personal Care
- 8.1. Market Analysis, Insights and Forecast - by Material Type
- 9. Asia Pacific Sustainable E-Commerce Packaging Market Analysis, Insights and Forecast, 2020-2032
- 9.1. Market Analysis, Insights and Forecast - by Material Type
- 9.1.1. Plastic
- 9.1.2. Paper and Paper Board
- 9.1.3. Metal
- 9.2. Market Analysis, Insights and Forecast - by End User
- 9.2.1. Fashion and Apparel
- 9.2.2. Consumer Electronics
- 9.2.3. Food and Beverage
- 9.2.4. Pharmaceuticals
- 9.2.5. Personal Care
- 9.1. Market Analysis, Insights and Forecast - by Material Type
- 10. Latin America Sustainable E-Commerce Packaging Market Analysis, Insights and Forecast, 2020-2032
- 10.1. Market Analysis, Insights and Forecast - by Material Type
- 10.1.1. Plastic
- 10.1.2. Paper and Paper Board
- 10.1.3. Metal
- 10.2. Market Analysis, Insights and Forecast - by End User
- 10.2.1. Fashion and Apparel
- 10.2.2. Consumer Electronics
- 10.2.3. Food and Beverage
- 10.2.4. Pharmaceuticals
- 10.2.5. Personal Care
- 10.1. Market Analysis, Insights and Forecast - by Material Type
- 11. Middle East and Africa Sustainable E-Commerce Packaging Market Analysis, Insights and Forecast, 2020-2032
- 11.1. Market Analysis, Insights and Forecast - by Material Type
- 11.1.1. Plastic
- 11.1.2. Paper and Paper Board
- 11.1.3. Metal
- 11.2. Market Analysis, Insights and Forecast - by End User
- 11.2.1. Fashion and Apparel
- 11.2.2. Consumer Electronics
- 11.2.3. Food and Beverage
- 11.2.4. Pharmaceuticals
- 11.2.5. Personal Care
- 11.1. Market Analysis, Insights and Forecast - by Material Type
- 12. Competitive Analysis
- 12.1. Company Profiles
- 12.1.1 WestRock Company
- 12.1.1.1. Company Overview
- 12.1.1.2. Products
- 12.1.1.3. Company Financials
- 12.1.1.4. SWOT Analysis
- 12.1.2 Pinnacle Packing Industries LLC
- 12.1.2.1. Company Overview
- 12.1.2.2. Products
- 12.1.2.3. Company Financials
- 12.1.2.4. SWOT Analysis
- 12.1.3 Amcor Group GmbH
- 12.1.3.1. Company Overview
- 12.1.3.2. Products
- 12.1.3.3. Company Financials
- 12.1.3.4. SWOT Analysis
- 12.1.4 DS Smith PLC
- 12.1.4.1. Company Overview
- 12.1.4.2. Products
- 12.1.4.3. Company Financials
- 12.1.4.4. SWOT Analysis
- 12.1.5 Mondi Group
- 12.1.5.1. Company Overview
- 12.1.5.2. Products
- 12.1.5.3. Company Financials
- 12.1.5.4. SWOT Analysis
- 12.1.6 Smurfit Kappa Group PLC
- 12.1.6.1. Company Overview
- 12.1.6.2. Products
- 12.1.6.3. Company Financials
- 12.1.6.4. SWOT Analysis
- 12.1.7 H B Fuller Company*List Not Exhaustive
- 12.1.7.1. Company Overview
- 12.1.7.2. Products
- 12.1.7.3. Company Financials
- 12.1.7.4. SWOT Analysis
- 12.1.8 Packman Packaging Private Limited
- 12.1.8.1. Company Overview
- 12.1.8.2. Products
- 12.1.8.3. Company Financials
- 12.1.8.4. SWOT Analysis
- 12.1.9 Sealed Air Corporation
- 12.1.9.1. Company Overview
- 12.1.9.2. Products
- 12.1.9.3. Company Financials
- 12.1.9.4. SWOT Analysis
- 12.1.10 International Paper
- 12.1.10.1. Company Overview
- 12.1.10.2. Products
- 12.1.10.3. Company Financials
- 12.1.10.4. SWOT Analysis
- 12.1.1 WestRock Company
- 12.2. Market Entropy
- 12.2.1 Company's Key Areas Served
- 12.2.2 Recent Developments
- 12.3. Company Market Share Analysis 2025
- 12.3.1 Top 5 Companies Market Share Analysis
- 12.3.2 Top 3 Companies Market Share Analysis
- 12.4. List of Potential Customers
- 13. Research Methodology
List of Figures
- Figure 1: Global Sustainable E-Commerce Packaging Market Revenue Breakdown (Million, %) by Region 2025 & 2033
- Figure 2: North America Sustainable E-Commerce Packaging Market Revenue (Million), by Material Type 2025 & 2033
- Figure 3: North America Sustainable E-Commerce Packaging Market Revenue Share (%), by Material Type 2025 & 2033
- Figure 4: North America Sustainable E-Commerce Packaging Market Revenue (Million), by End User 2025 & 2033
- Figure 5: North America Sustainable E-Commerce Packaging Market Revenue Share (%), by End User 2025 & 2033
- Figure 6: North America Sustainable E-Commerce Packaging Market Revenue (Million), by Country 2025 & 2033
- Figure 7: North America Sustainable E-Commerce Packaging Market Revenue Share (%), by Country 2025 & 2033
- Figure 8: Europe Sustainable E-Commerce Packaging Market Revenue (Million), by Material Type 2025 & 2033
- Figure 9: Europe Sustainable E-Commerce Packaging Market Revenue Share (%), by Material Type 2025 & 2033
- Figure 10: Europe Sustainable E-Commerce Packaging Market Revenue (Million), by End User 2025 & 2033
- Figure 11: Europe Sustainable E-Commerce Packaging Market Revenue Share (%), by End User 2025 & 2033
- Figure 12: Europe Sustainable E-Commerce Packaging Market Revenue (Million), by Country 2025 & 2033
- Figure 13: Europe Sustainable E-Commerce Packaging Market Revenue Share (%), by Country 2025 & 2033
- Figure 14: Asia Pacific Sustainable E-Commerce Packaging Market Revenue (Million), by Material Type 2025 & 2033
- Figure 15: Asia Pacific Sustainable E-Commerce Packaging Market Revenue Share (%), by Material Type 2025 & 2033
- Figure 16: Asia Pacific Sustainable E-Commerce Packaging Market Revenue (Million), by End User 2025 & 2033
- Figure 17: Asia Pacific Sustainable E-Commerce Packaging Market Revenue Share (%), by End User 2025 & 2033
- Figure 18: Asia Pacific Sustainable E-Commerce Packaging Market Revenue (Million), by Country 2025 & 2033
- Figure 19: Asia Pacific Sustainable E-Commerce Packaging Market Revenue Share (%), by Country 2025 & 2033
- Figure 20: Latin America Sustainable E-Commerce Packaging Market Revenue (Million), by Material Type 2025 & 2033
- Figure 21: Latin America Sustainable E-Commerce Packaging Market Revenue Share (%), by Material Type 2025 & 2033
- Figure 22: Latin America Sustainable E-Commerce Packaging Market Revenue (Million), by End User 2025 & 2033
- Figure 23: Latin America Sustainable E-Commerce Packaging Market Revenue Share (%), by End User 2025 & 2033
- Figure 24: Latin America Sustainable E-Commerce Packaging Market Revenue (Million), by Country 2025 & 2033
- Figure 25: Latin America Sustainable E-Commerce Packaging Market Revenue Share (%), by Country 2025 & 2033
- Figure 26: Middle East and Africa Sustainable E-Commerce Packaging Market Revenue (Million), by Material Type 2025 & 2033
- Figure 27: Middle East and Africa Sustainable E-Commerce Packaging Market Revenue Share (%), by Material Type 2025 & 2033
- Figure 28: Middle East and Africa Sustainable E-Commerce Packaging Market Revenue (Million), by End User 2025 & 2033
- Figure 29: Middle East and Africa Sustainable E-Commerce Packaging Market Revenue Share (%), by End User 2025 & 2033
- Figure 30: Middle East and Africa Sustainable E-Commerce Packaging Market Revenue (Million), by Country 2025 & 2033
- Figure 31: Middle East and Africa Sustainable E-Commerce Packaging Market Revenue Share (%), by Country 2025 & 2033
List of Tables
- Table 1: Global Sustainable E-Commerce Packaging Market Revenue Million Forecast, by Material Type 2020 & 2033
- Table 2: Global Sustainable E-Commerce Packaging Market Revenue Million Forecast, by End User 2020 & 2033
- Table 3: Global Sustainable E-Commerce Packaging Market Revenue Million Forecast, by Region 2020 & 2033
- Table 4: Global Sustainable E-Commerce Packaging Market Revenue Million Forecast, by Material Type 2020 & 2033
- Table 5: Global Sustainable E-Commerce Packaging Market Revenue Million Forecast, by End User 2020 & 2033
- Table 6: Global Sustainable E-Commerce Packaging Market Revenue Million Forecast, by Country 2020 & 2033
- Table 7: United States Sustainable E-Commerce Packaging Market Revenue (Million) Forecast, by Application 2020 & 2033
- Table 8: Canada Sustainable E-Commerce Packaging Market Revenue (Million) Forecast, by Application 2020 & 2033
- Table 9: Global Sustainable E-Commerce Packaging Market Revenue Million Forecast, by Material Type 2020 & 2033
- Table 10: Global Sustainable E-Commerce Packaging Market Revenue Million Forecast, by End User 2020 & 2033
- Table 11: Global Sustainable E-Commerce Packaging Market Revenue Million Forecast, by Country 2020 & 2033
- Table 12: United Kingdom Sustainable E-Commerce Packaging Market Revenue (Million) Forecast, by Application 2020 & 2033
- Table 13: Germany Sustainable E-Commerce Packaging Market Revenue (Million) Forecast, by Application 2020 & 2033
- Table 14: France Sustainable E-Commerce Packaging Market Revenue (Million) Forecast, by Application 2020 & 2033
- Table 15: Italy Sustainable E-Commerce Packaging Market Revenue (Million) Forecast, by Application 2020 & 2033
- Table 16: Spain Sustainable E-Commerce Packaging Market Revenue (Million) Forecast, by Application 2020 & 2033
- Table 17: Global Sustainable E-Commerce Packaging Market Revenue Million Forecast, by Material Type 2020 & 2033
- Table 18: Global Sustainable E-Commerce Packaging Market Revenue Million Forecast, by End User 2020 & 2033
- Table 19: Global Sustainable E-Commerce Packaging Market Revenue Million Forecast, by Country 2020 & 2033
- Table 20: China Sustainable E-Commerce Packaging Market Revenue (Million) Forecast, by Application 2020 & 2033
- Table 21: Japan Sustainable E-Commerce Packaging Market Revenue (Million) Forecast, by Application 2020 & 2033
- Table 22: India Sustainable E-Commerce Packaging Market Revenue (Million) Forecast, by Application 2020 & 2033
- Table 23: Australia and New Zealand Sustainable E-Commerce Packaging Market Revenue (Million) Forecast, by Application 2020 & 2033
- Table 24: Global Sustainable E-Commerce Packaging Market Revenue Million Forecast, by Material Type 2020 & 2033
- Table 25: Global Sustainable E-Commerce Packaging Market Revenue Million Forecast, by End User 2020 & 2033
- Table 26: Global Sustainable E-Commerce Packaging Market Revenue Million Forecast, by Country 2020 & 2033
- Table 27: Brazil Sustainable E-Commerce Packaging Market Revenue (Million) Forecast, by Application 2020 & 2033
- Table 28: Argentina Sustainable E-Commerce Packaging Market Revenue (Million) Forecast, by Application 2020 & 2033
- Table 29: Mexico Sustainable E-Commerce Packaging Market Revenue (Million) Forecast, by Application 2020 & 2033
- Table 30: Global Sustainable E-Commerce Packaging Market Revenue Million Forecast, by Material Type 2020 & 2033
- Table 31: Global Sustainable E-Commerce Packaging Market Revenue Million Forecast, by End User 2020 & 2033
- Table 32: Global Sustainable E-Commerce Packaging Market Revenue Million Forecast, by Country 2020 & 2033
- Table 33: Saudi Arabia Sustainable E-Commerce Packaging Market Revenue (Million) Forecast, by Application 2020 & 2033
- Table 34: United Arab Emirates Sustainable E-Commerce Packaging Market Revenue (Million) Forecast, by Application 2020 & 2033
- Table 35: South Africa Sustainable E-Commerce Packaging Market Revenue (Million) Forecast, by Application 2020 & 2033
Frequently Asked Questions
1. What is the projected Compound Annual Growth Rate (CAGR) of the Sustainable E-Commerce Packaging Market?
The projected CAGR is approximately 8.12%.
2. Which companies are prominent players in the Sustainable E-Commerce Packaging Market?
Key companies in the market include WestRock Company, Pinnacle Packing Industries LLC, Amcor Group GmbH, DS Smith PLC, Mondi Group, Smurfit Kappa Group PLC, H B Fuller Company*List Not Exhaustive, Packman Packaging Private Limited, Sealed Air Corporation, International Paper.
3. What are the main segments of the Sustainable E-Commerce Packaging Market?
The market segments include Material Type, End User.
4. Can you provide details about the market size?
The market size is estimated to be USD 34.41 Million as of 2022.
5. What are some drivers contributing to market growth?
Shift in Consumer Preferences toward Recyclable and Eco-friendly Materials; Exponential Growth of Eco-commerce and Online Retailing Penetration Across the Globe; Rising Inclination Toward Downsized and Lightweight Packaging.
6. What are the notable trends driving market growth?
Online Sales of Consumer Electronics is Expected to Drive Top-Line.
7. Are there any restraints impacting market growth?
Supply Chain-related Issues and Fluctuating Cost of Raw Materials.
8. Can you provide examples of recent developments in the market?
April 2024: DS Smith, a packaging solutions provider, came into an agreement with a Swedish producer of sustainable e-commerce bags, Jonsac, to speed up the transition from plastic packaging to eco-friendly paper alternatives in the European e-commerce sector. The existing partnership between Jonsac and DS Smith, which previously involved the supply of paper bag solutions to DS Smith customers in the Nordic region, has now been expanded. As a result, Jonsac's 100% recyclable, FSC-certified paper bags will be accessible in all DS Smith markets across Europe.
9. What pricing options are available for accessing the report?
Pricing options include single-user, multi-user, and enterprise licenses priced at USD 4750, USD 5250, and USD 8750 respectively.
10. Is the market size provided in terms of value or volume?
The market size is provided in terms of value, measured in Million.
11. Are there any specific market keywords associated with the report?
Yes, the market keyword associated with the report is "Sustainable E-Commerce Packaging Market," which aids in identifying and referencing the specific market segment covered.
12. How do I determine which pricing option suits my needs best?
The pricing options vary based on user requirements and access needs. Individual users may opt for single-user licenses, while businesses requiring broader access may choose multi-user or enterprise licenses for cost-effective access to the report.
13. Are there any additional resources or data provided in the Sustainable E-Commerce Packaging Market report?
While the report offers comprehensive insights, it's advisable to review the specific contents or supplementary materials provided to ascertain if additional resources or data are available.
14. How can I stay updated on further developments or reports in the Sustainable E-Commerce Packaging Market?
To stay informed about further developments, trends, and reports in the Sustainable E-Commerce Packaging Market, consider subscribing to industry newsletters, following relevant companies and organizations, or regularly checking reputable industry news sources and publications.
Methodology
Step 1 - Identification of Relevant Samples Size from Population Database


Step 2 - Approaches for Defining Global Market Size (Value, Volume* & Price*)

Note*: In applicable scenarios
Step 3 - Data Sources
Primary Research
- Web Analytics
- Survey Reports
- Research Institute
- Latest Research Reports
- Opinion Leaders
Secondary Research
- Annual Reports
- White Paper
- Latest Press Release
- Industry Association
- Paid Database
- Investor Presentations

Step 4 - Data Triangulation
Involves using different sources of information in order to increase the validity of a study
These sources are likely to be stakeholders in a program - participants, other researchers, program staff, other community members, and so on.
Then we put all data in single framework & apply various statistical tools to find out the dynamic on the market.
During the analysis stage, feedback from the stakeholder groups would be compared to determine areas of agreement as well as areas of divergence