

Key Insights
The global synthetic food flavor market is projected to reach $21.42 billion by 2025, exhibiting a compound annual growth rate (CAGR) of 5.5%. This expansion is attributed to increasing consumer preference for processed foods and beverages, a growing emphasis on health-conscious choices such as low-sodium and low-sugar flavor enhancers, and ongoing innovation in flavor profiles to satisfy diverse consumer tastes. Leading companies including IFF, Givaudan, Firmenich, and Symrise are driving this growth through strategic acquisitions, research and development in novel flavor technologies, and expansion into emerging markets. The market's growth is further supported by the rising popularity of convenience foods and the expanding food service sector, which benefit from the cost-effectiveness and consistent quality offered by synthetic flavors. Despite regulatory considerations and consumer awareness of artificial ingredients, the market's positive outlook is sustained by strong consumer demand for enhanced taste and flavor across numerous food categories.
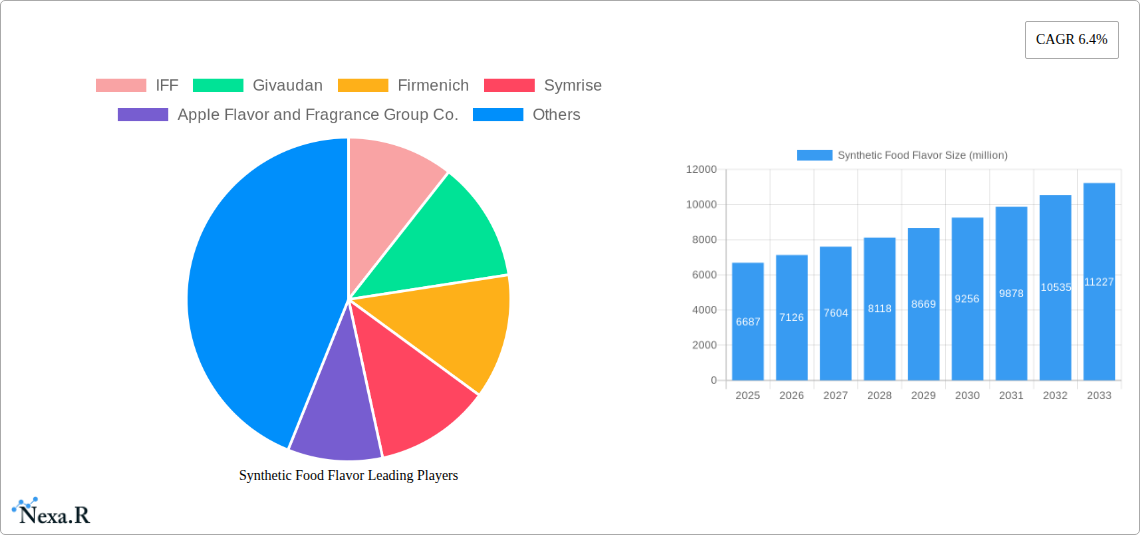
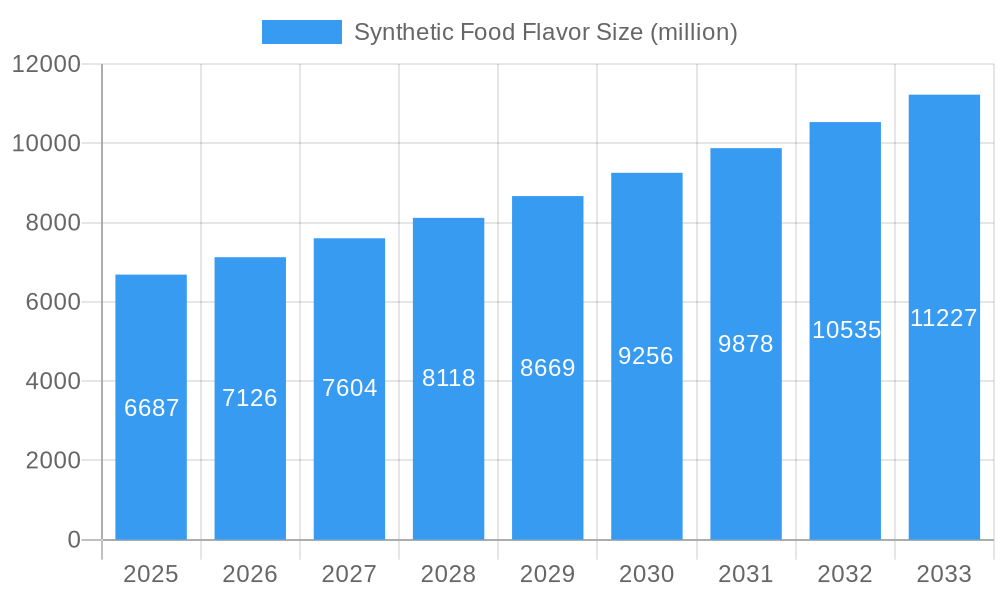
Synthetic Food Flavor Market Size (In Billion)
During the forecast period (2025-2033), the market is expected to experience a CAGR of 5.5%, signaling substantial growth. Factors contributing to this expansion include rising disposable incomes in developing economies, fostering greater consumption of processed food products. Additionally, advancements in flavor creation technologies and the development of natural and clean-label synthetic flavors will significantly influence future market dynamics. This will encourage continued investment from major players aiming to diversify their product offerings and meet the growing demand for healthier and more sustainable food alternatives. Regional growth rates are expected to vary based on economic development, consumer preferences, and regulatory environments.
Synthetic Food Flavor Company Market Share
Synthetic Food Flavor Market Report: 2019-2033
This comprehensive report provides a detailed analysis of the global synthetic food flavor market, offering invaluable insights for industry professionals, investors, and strategic decision-makers. With a study period spanning 2019-2033, a base year of 2025, and a forecast period of 2025-2033, this report delivers a precise and actionable understanding of market dynamics, growth trends, and future opportunities. The market is segmented by type, application and geography, with a focus on key players like IFF, Givaudan, Firmenich, and Symrise. The total market size in 2025 is estimated at XXX million.
Synthetic Food Flavor Market Dynamics & Structure
The synthetic food flavor market is characterized by a moderately concentrated landscape, with a few major players holding significant market share. In 2025, the top five companies, namely IFF, Givaudan, Firmenich, Symrise, and Takasago, are estimated to account for approximately xx% of the global market. Technological innovation, particularly in the development of natural and clean-label alternatives, is a key driver, but regulatory frameworks and evolving consumer preferences present both opportunities and challenges. The market witnesses consistent M&A activity, with xx deals recorded between 2019 and 2024, totaling an estimated value of xx million. Key factors influencing market dynamics include:
- Market Concentration: Highly concentrated with top players controlling a significant portion.
- Technological Innovation: Focus on natural and clean-label alternatives driving growth.
- Regulatory Frameworks: Stringent regulations impacting product development and labeling.
- Competitive Substitutes: Natural flavorings pose a significant competitive challenge.
- End-User Demographics: Growing demand from health-conscious consumers influencing product development.
- M&A Trends: Consolidation within the industry through acquisitions and mergers.
Synthetic Food Flavor Growth Trends & Insights
The synthetic food flavor market has exhibited a steady growth trajectory over the historical period (2019-2024). Driven by factors such as increasing demand for processed food and beverages, expanding global population, and rising disposable incomes, the market experienced a CAGR of xx% during this period. The market size is projected to reach xx million by 2033, indicating a CAGR of xx% during the forecast period (2025-2033). Technological disruptions, such as the advancements in flavor creation and delivery systems, are further accelerating market growth. Consumer behavior shifts towards convenience and affordability are also significant contributors. Market penetration rates, especially in emerging economies, suggest substantial growth potential, particularly in segments such as bakery and confectionery.
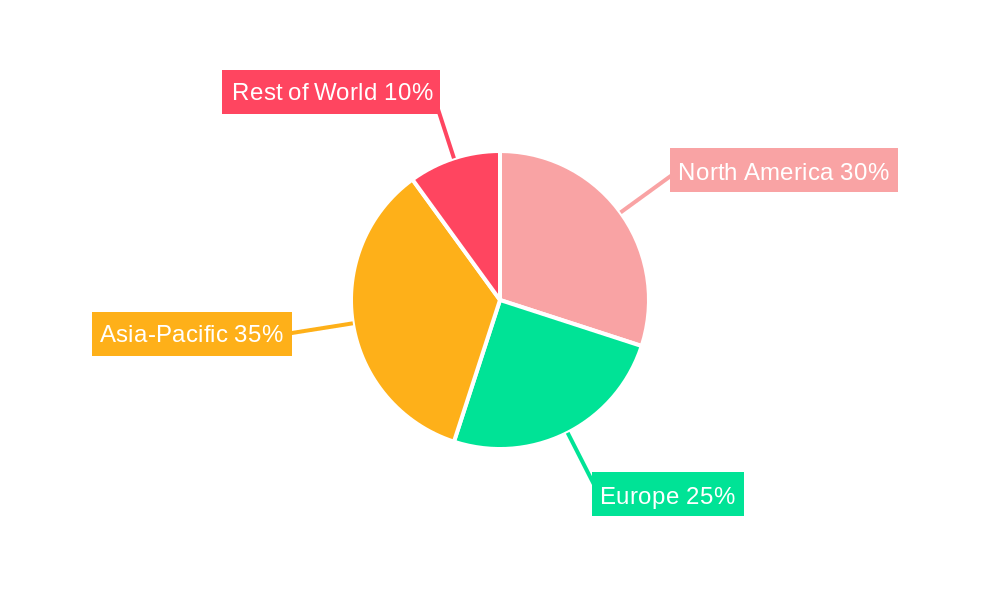
Dominant Regions, Countries, or Segments in Synthetic Food Flavor
North America currently dominates the global synthetic food flavor market, followed by Europe and Asia-Pacific. The dominance of North America is attributed to factors such as high consumption of processed foods, well-established food processing industries, and high per capita disposable income. However, the Asia-Pacific region presents significant growth potential, driven by rapid urbanization, rising disposable incomes, and a growing demand for convenience foods.
- North America: High processed food consumption and established food processing industry.
- Europe: Stringent regulations and increasing demand for natural flavors.
- Asia-Pacific: Rapid urbanization, rising disposable incomes, and demand for convenience foods fuel growth.
- Key Drivers: Economic growth, increasing urbanization, changing dietary habits and preferences.
The growth is unevenly distributed among different segments with the food and beverage sector exhibiting highest demand.
Synthetic Food Flavor Product Landscape
The synthetic food flavor market showcases a diverse range of products, categorized by flavor profile (e.g., fruity, spicy, savory), application (e.g., beverages, confectionery, savory snacks), and delivery systems (e.g., liquid, powder, emulsion). Recent innovations focus on clean-label ingredients, natural flavor enhancement, and customized flavor profiles tailored to specific consumer preferences. Technological advancements in flavor encapsulation and delivery methods are improving flavor stability and enhancing sensory experiences.
Key Drivers, Barriers & Challenges in Synthetic Food Flavor
Key Drivers:
- Increasing demand for processed foods.
- Growing global population and rising disposable incomes.
- Technological advancements in flavor creation and delivery.
- Expansion of the food and beverage industry.
Challenges and Restraints:
- Stringent regulations and safety concerns surrounding synthetic flavor usage.
- Growing consumer preference for natural and clean-label ingredients.
- Fluctuations in raw material prices impacting production costs.
- Intense competition amongst established players.
Emerging Opportunities in Synthetic Food Flavor
The synthetic food flavor market presents several emerging opportunities, including:
- Expanding into untapped markets in developing economies.
- Development of customized and personalized flavors catering to niche consumer segments.
- Creating sustainable and environmentally friendly flavoring solutions.
- Leveraging advanced technologies such as artificial intelligence and machine learning to improve flavor development and optimization.
Growth Accelerators in the Synthetic Food Flavor Industry
Technological breakthroughs, strategic partnerships, and market expansion strategies are driving long-term growth. The development of novel flavor compounds, improved delivery systems, and enhanced sensory attributes are key growth catalysts. Collaborative efforts between flavor companies and food manufacturers accelerate product innovation and market penetration. Expansion into new geographic regions and diversification into emerging product applications further propel market growth.
Notable Milestones in Synthetic Food Flavor Sector
- 2021: IFF acquired Frutarom, expanding its flavor portfolio and global reach.
- 2022: Symrise launched a new line of sustainable flavor solutions.
- 2023: Givaudan introduced a range of innovative flavor technologies. (Specific details of the launches are not available in your prompt; please add for accurate reporting)
In-Depth Synthetic Food Flavor Market Outlook
The synthetic food flavor market is poised for sustained growth, driven by continuous innovation, expanding consumer base, and strategic market expansions. Future opportunities lie in the development of personalized and functional flavors, natural-identical flavor compounds, and sustainable sourcing. Strategic partnerships, acquisitions, and technological advancements will remain key drivers of market expansion in the coming years, resulting in market value exceeding xx million by 2033.
Synthetic Food Flavor Segmentation
-
1. Application
- 1.1. Processed Meat
- 1.2. Condiment
- 1.3. Snack food
- 1.4. Others
-
2. Type
- 2.1. Liquid Flavor
- 2.2. Emulsifying Flavor
- 2.3. Powder Flavor
- 2.4. Others
Synthetic Food Flavor Segmentation By Geography
-
1. North America
- 1.1. United States
- 1.2. Canada
- 1.3. Mexico
-
2. South America
- 2.1. Brazil
- 2.2. Argentina
- 2.3. Rest of South America
-
3. Europe
- 3.1. United Kingdom
- 3.2. Germany
- 3.3. France
- 3.4. Italy
- 3.5. Spain
- 3.6. Russia
- 3.7. Benelux
- 3.8. Nordics
- 3.9. Rest of Europe
-
4. Middle East & Africa
- 4.1. Turkey
- 4.2. Israel
- 4.3. GCC
- 4.4. North Africa
- 4.5. South Africa
- 4.6. Rest of Middle East & Africa
-
5. Asia Pacific
- 5.1. China
- 5.2. India
- 5.3. Japan
- 5.4. South Korea
- 5.5. ASEAN
- 5.6. Oceania
- 5.7. Rest of Asia Pacific
Synthetic Food Flavor Regional Market Share
Geographic Coverage of Synthetic Food Flavor
Synthetic Food Flavor REPORT HIGHLIGHTS
| Aspects | Details |
|---|---|
| Study Period | 2020-2034 |
| Base Year | 2025 |
| Estimated Year | 2026 |
| Forecast Period | 2026-2034 |
| Historical Period | 2020-2025 |
| Growth Rate | CAGR of 5.5% from 2020-2034 |
| Segmentation |
|
Table of Contents
- 1. Introduction
- 1.1. Research Scope
- 1.2. Market Segmentation
- 1.3. Research Methodology
- 1.4. Definitions and Assumptions
- 2. Executive Summary
- 2.1. Introduction
- 3. Market Dynamics
- 3.1. Introduction
- 3.2. Market Drivers
- 3.3. Market Restrains
- 3.4. Market Trends
- 4. Market Factor Analysis
- 4.1. Porters Five Forces
- 4.2. Supply/Value Chain
- 4.3. PESTEL analysis
- 4.4. Market Entropy
- 4.5. Patent/Trademark Analysis
- 5. Global Synthetic Food Flavor Analysis, Insights and Forecast, 2020-2032
- 5.1. Market Analysis, Insights and Forecast - by Application
- 5.1.1. Processed Meat
- 5.1.2. Condiment
- 5.1.3. Snack food
- 5.1.4. Others
- 5.2. Market Analysis, Insights and Forecast - by Type
- 5.2.1. Liquid Flavor
- 5.2.2. Emulsifying Flavor
- 5.2.3. Powder Flavor
- 5.2.4. Others
- 5.3. Market Analysis, Insights and Forecast - by Region
- 5.3.1. North America
- 5.3.2. South America
- 5.3.3. Europe
- 5.3.4. Middle East & Africa
- 5.3.5. Asia Pacific
- 5.1. Market Analysis, Insights and Forecast - by Application
- 6. North America Synthetic Food Flavor Analysis, Insights and Forecast, 2020-2032
- 6.1. Market Analysis, Insights and Forecast - by Application
- 6.1.1. Processed Meat
- 6.1.2. Condiment
- 6.1.3. Snack food
- 6.1.4. Others
- 6.2. Market Analysis, Insights and Forecast - by Type
- 6.2.1. Liquid Flavor
- 6.2.2. Emulsifying Flavor
- 6.2.3. Powder Flavor
- 6.2.4. Others
- 6.1. Market Analysis, Insights and Forecast - by Application
- 7. South America Synthetic Food Flavor Analysis, Insights and Forecast, 2020-2032
- 7.1. Market Analysis, Insights and Forecast - by Application
- 7.1.1. Processed Meat
- 7.1.2. Condiment
- 7.1.3. Snack food
- 7.1.4. Others
- 7.2. Market Analysis, Insights and Forecast - by Type
- 7.2.1. Liquid Flavor
- 7.2.2. Emulsifying Flavor
- 7.2.3. Powder Flavor
- 7.2.4. Others
- 7.1. Market Analysis, Insights and Forecast - by Application
- 8. Europe Synthetic Food Flavor Analysis, Insights and Forecast, 2020-2032
- 8.1. Market Analysis, Insights and Forecast - by Application
- 8.1.1. Processed Meat
- 8.1.2. Condiment
- 8.1.3. Snack food
- 8.1.4. Others
- 8.2. Market Analysis, Insights and Forecast - by Type
- 8.2.1. Liquid Flavor
- 8.2.2. Emulsifying Flavor
- 8.2.3. Powder Flavor
- 8.2.4. Others
- 8.1. Market Analysis, Insights and Forecast - by Application
- 9. Middle East & Africa Synthetic Food Flavor Analysis, Insights and Forecast, 2020-2032
- 9.1. Market Analysis, Insights and Forecast - by Application
- 9.1.1. Processed Meat
- 9.1.2. Condiment
- 9.1.3. Snack food
- 9.1.4. Others
- 9.2. Market Analysis, Insights and Forecast - by Type
- 9.2.1. Liquid Flavor
- 9.2.2. Emulsifying Flavor
- 9.2.3. Powder Flavor
- 9.2.4. Others
- 9.1. Market Analysis, Insights and Forecast - by Application
- 10. Asia Pacific Synthetic Food Flavor Analysis, Insights and Forecast, 2020-2032
- 10.1. Market Analysis, Insights and Forecast - by Application
- 10.1.1. Processed Meat
- 10.1.2. Condiment
- 10.1.3. Snack food
- 10.1.4. Others
- 10.2. Market Analysis, Insights and Forecast - by Type
- 10.2.1. Liquid Flavor
- 10.2.2. Emulsifying Flavor
- 10.2.3. Powder Flavor
- 10.2.4. Others
- 10.1. Market Analysis, Insights and Forecast - by Application
- 11. Competitive Analysis
- 11.1. Global Market Share Analysis 2025
- 11.2. Company Profiles
- 11.2.1 IFF
- 11.2.1.1. Overview
- 11.2.1.2. Products
- 11.2.1.3. SWOT Analysis
- 11.2.1.4. Recent Developments
- 11.2.1.5. Financials (Based on Availability)
- 11.2.2 Givaudan
- 11.2.2.1. Overview
- 11.2.2.2. Products
- 11.2.2.3. SWOT Analysis
- 11.2.2.4. Recent Developments
- 11.2.2.5. Financials (Based on Availability)
- 11.2.3 Firmenich
- 11.2.3.1. Overview
- 11.2.3.2. Products
- 11.2.3.3. SWOT Analysis
- 11.2.3.4. Recent Developments
- 11.2.3.5. Financials (Based on Availability)
- 11.2.4 Symrise
- 11.2.4.1. Overview
- 11.2.4.2. Products
- 11.2.4.3. SWOT Analysis
- 11.2.4.4. Recent Developments
- 11.2.4.5. Financials (Based on Availability)
- 11.2.5 Apple Flavor and Fragrance Group Co.
- 11.2.5.1. Overview
- 11.2.5.2. Products
- 11.2.5.3. SWOT Analysis
- 11.2.5.4. Recent Developments
- 11.2.5.5. Financials (Based on Availability)
- 11.2.6 Ltd.
- 11.2.6.1. Overview
- 11.2.6.2. Products
- 11.2.6.3. SWOT Analysis
- 11.2.6.4. Recent Developments
- 11.2.6.5. Financials (Based on Availability)
- 11.2.7 Takasago
- 11.2.7.1. Overview
- 11.2.7.2. Products
- 11.2.7.3. SWOT Analysis
- 11.2.7.4. Recent Developments
- 11.2.7.5. Financials (Based on Availability)
- 11.2.8 Hasegawa
- 11.2.8.1. Overview
- 11.2.8.2. Products
- 11.2.8.3. SWOT Analysis
- 11.2.8.4. Recent Developments
- 11.2.8.5. Financials (Based on Availability)
- 11.2.9 MAY CHEN AROMATIC CO.
- 11.2.9.1. Overview
- 11.2.9.2. Products
- 11.2.9.3. SWOT Analysis
- 11.2.9.4. Recent Developments
- 11.2.9.5. Financials (Based on Availability)
- 11.2.10 LTD.
- 11.2.10.1. Overview
- 11.2.10.2. Products
- 11.2.10.3. SWOT Analysis
- 11.2.10.4. Recent Developments
- 11.2.10.5. Financials (Based on Availability)
- 11.2.11 Danisco
- 11.2.11.1. Overview
- 11.2.11.2. Products
- 11.2.11.3. SWOT Analysis
- 11.2.11.4. Recent Developments
- 11.2.11.5. Financials (Based on Availability)
- 11.2.12 Ningbo Weilong Flavor & Fragrance Co.
- 11.2.12.1. Overview
- 11.2.12.2. Products
- 11.2.12.3. SWOT Analysis
- 11.2.12.4. Recent Developments
- 11.2.12.5. Financials (Based on Availability)
- 11.2.13 Ltd.
- 11.2.13.1. Overview
- 11.2.13.2. Products
- 11.2.13.3. SWOT Analysis
- 11.2.13.4. Recent Developments
- 11.2.13.5. Financials (Based on Availability)
- 11.2.1 IFF
List of Figures
- Figure 1: Global Synthetic Food Flavor Revenue Breakdown (billion, %) by Region 2025 & 2033
- Figure 2: Global Synthetic Food Flavor Volume Breakdown (K, %) by Region 2025 & 2033
- Figure 3: North America Synthetic Food Flavor Revenue (billion), by Application 2025 & 2033
- Figure 4: North America Synthetic Food Flavor Volume (K), by Application 2025 & 2033
- Figure 5: North America Synthetic Food Flavor Revenue Share (%), by Application 2025 & 2033
- Figure 6: North America Synthetic Food Flavor Volume Share (%), by Application 2025 & 2033
- Figure 7: North America Synthetic Food Flavor Revenue (billion), by Type 2025 & 2033
- Figure 8: North America Synthetic Food Flavor Volume (K), by Type 2025 & 2033
- Figure 9: North America Synthetic Food Flavor Revenue Share (%), by Type 2025 & 2033
- Figure 10: North America Synthetic Food Flavor Volume Share (%), by Type 2025 & 2033
- Figure 11: North America Synthetic Food Flavor Revenue (billion), by Country 2025 & 2033
- Figure 12: North America Synthetic Food Flavor Volume (K), by Country 2025 & 2033
- Figure 13: North America Synthetic Food Flavor Revenue Share (%), by Country 2025 & 2033
- Figure 14: North America Synthetic Food Flavor Volume Share (%), by Country 2025 & 2033
- Figure 15: South America Synthetic Food Flavor Revenue (billion), by Application 2025 & 2033
- Figure 16: South America Synthetic Food Flavor Volume (K), by Application 2025 & 2033
- Figure 17: South America Synthetic Food Flavor Revenue Share (%), by Application 2025 & 2033
- Figure 18: South America Synthetic Food Flavor Volume Share (%), by Application 2025 & 2033
- Figure 19: South America Synthetic Food Flavor Revenue (billion), by Type 2025 & 2033
- Figure 20: South America Synthetic Food Flavor Volume (K), by Type 2025 & 2033
- Figure 21: South America Synthetic Food Flavor Revenue Share (%), by Type 2025 & 2033
- Figure 22: South America Synthetic Food Flavor Volume Share (%), by Type 2025 & 2033
- Figure 23: South America Synthetic Food Flavor Revenue (billion), by Country 2025 & 2033
- Figure 24: South America Synthetic Food Flavor Volume (K), by Country 2025 & 2033
- Figure 25: South America Synthetic Food Flavor Revenue Share (%), by Country 2025 & 2033
- Figure 26: South America Synthetic Food Flavor Volume Share (%), by Country 2025 & 2033
- Figure 27: Europe Synthetic Food Flavor Revenue (billion), by Application 2025 & 2033
- Figure 28: Europe Synthetic Food Flavor Volume (K), by Application 2025 & 2033
- Figure 29: Europe Synthetic Food Flavor Revenue Share (%), by Application 2025 & 2033
- Figure 30: Europe Synthetic Food Flavor Volume Share (%), by Application 2025 & 2033
- Figure 31: Europe Synthetic Food Flavor Revenue (billion), by Type 2025 & 2033
- Figure 32: Europe Synthetic Food Flavor Volume (K), by Type 2025 & 2033
- Figure 33: Europe Synthetic Food Flavor Revenue Share (%), by Type 2025 & 2033
- Figure 34: Europe Synthetic Food Flavor Volume Share (%), by Type 2025 & 2033
- Figure 35: Europe Synthetic Food Flavor Revenue (billion), by Country 2025 & 2033
- Figure 36: Europe Synthetic Food Flavor Volume (K), by Country 2025 & 2033
- Figure 37: Europe Synthetic Food Flavor Revenue Share (%), by Country 2025 & 2033
- Figure 38: Europe Synthetic Food Flavor Volume Share (%), by Country 2025 & 2033
- Figure 39: Middle East & Africa Synthetic Food Flavor Revenue (billion), by Application 2025 & 2033
- Figure 40: Middle East & Africa Synthetic Food Flavor Volume (K), by Application 2025 & 2033
- Figure 41: Middle East & Africa Synthetic Food Flavor Revenue Share (%), by Application 2025 & 2033
- Figure 42: Middle East & Africa Synthetic Food Flavor Volume Share (%), by Application 2025 & 2033
- Figure 43: Middle East & Africa Synthetic Food Flavor Revenue (billion), by Type 2025 & 2033
- Figure 44: Middle East & Africa Synthetic Food Flavor Volume (K), by Type 2025 & 2033
- Figure 45: Middle East & Africa Synthetic Food Flavor Revenue Share (%), by Type 2025 & 2033
- Figure 46: Middle East & Africa Synthetic Food Flavor Volume Share (%), by Type 2025 & 2033
- Figure 47: Middle East & Africa Synthetic Food Flavor Revenue (billion), by Country 2025 & 2033
- Figure 48: Middle East & Africa Synthetic Food Flavor Volume (K), by Country 2025 & 2033
- Figure 49: Middle East & Africa Synthetic Food Flavor Revenue Share (%), by Country 2025 & 2033
- Figure 50: Middle East & Africa Synthetic Food Flavor Volume Share (%), by Country 2025 & 2033
- Figure 51: Asia Pacific Synthetic Food Flavor Revenue (billion), by Application 2025 & 2033
- Figure 52: Asia Pacific Synthetic Food Flavor Volume (K), by Application 2025 & 2033
- Figure 53: Asia Pacific Synthetic Food Flavor Revenue Share (%), by Application 2025 & 2033
- Figure 54: Asia Pacific Synthetic Food Flavor Volume Share (%), by Application 2025 & 2033
- Figure 55: Asia Pacific Synthetic Food Flavor Revenue (billion), by Type 2025 & 2033
- Figure 56: Asia Pacific Synthetic Food Flavor Volume (K), by Type 2025 & 2033
- Figure 57: Asia Pacific Synthetic Food Flavor Revenue Share (%), by Type 2025 & 2033
- Figure 58: Asia Pacific Synthetic Food Flavor Volume Share (%), by Type 2025 & 2033
- Figure 59: Asia Pacific Synthetic Food Flavor Revenue (billion), by Country 2025 & 2033
- Figure 60: Asia Pacific Synthetic Food Flavor Volume (K), by Country 2025 & 2033
- Figure 61: Asia Pacific Synthetic Food Flavor Revenue Share (%), by Country 2025 & 2033
- Figure 62: Asia Pacific Synthetic Food Flavor Volume Share (%), by Country 2025 & 2033
List of Tables
- Table 1: Global Synthetic Food Flavor Revenue billion Forecast, by Application 2020 & 2033
- Table 2: Global Synthetic Food Flavor Volume K Forecast, by Application 2020 & 2033
- Table 3: Global Synthetic Food Flavor Revenue billion Forecast, by Type 2020 & 2033
- Table 4: Global Synthetic Food Flavor Volume K Forecast, by Type 2020 & 2033
- Table 5: Global Synthetic Food Flavor Revenue billion Forecast, by Region 2020 & 2033
- Table 6: Global Synthetic Food Flavor Volume K Forecast, by Region 2020 & 2033
- Table 7: Global Synthetic Food Flavor Revenue billion Forecast, by Application 2020 & 2033
- Table 8: Global Synthetic Food Flavor Volume K Forecast, by Application 2020 & 2033
- Table 9: Global Synthetic Food Flavor Revenue billion Forecast, by Type 2020 & 2033
- Table 10: Global Synthetic Food Flavor Volume K Forecast, by Type 2020 & 2033
- Table 11: Global Synthetic Food Flavor Revenue billion Forecast, by Country 2020 & 2033
- Table 12: Global Synthetic Food Flavor Volume K Forecast, by Country 2020 & 2033
- Table 13: United States Synthetic Food Flavor Revenue (billion) Forecast, by Application 2020 & 2033
- Table 14: United States Synthetic Food Flavor Volume (K) Forecast, by Application 2020 & 2033
- Table 15: Canada Synthetic Food Flavor Revenue (billion) Forecast, by Application 2020 & 2033
- Table 16: Canada Synthetic Food Flavor Volume (K) Forecast, by Application 2020 & 2033
- Table 17: Mexico Synthetic Food Flavor Revenue (billion) Forecast, by Application 2020 & 2033
- Table 18: Mexico Synthetic Food Flavor Volume (K) Forecast, by Application 2020 & 2033
- Table 19: Global Synthetic Food Flavor Revenue billion Forecast, by Application 2020 & 2033
- Table 20: Global Synthetic Food Flavor Volume K Forecast, by Application 2020 & 2033
- Table 21: Global Synthetic Food Flavor Revenue billion Forecast, by Type 2020 & 2033
- Table 22: Global Synthetic Food Flavor Volume K Forecast, by Type 2020 & 2033
- Table 23: Global Synthetic Food Flavor Revenue billion Forecast, by Country 2020 & 2033
- Table 24: Global Synthetic Food Flavor Volume K Forecast, by Country 2020 & 2033
- Table 25: Brazil Synthetic Food Flavor Revenue (billion) Forecast, by Application 2020 & 2033
- Table 26: Brazil Synthetic Food Flavor Volume (K) Forecast, by Application 2020 & 2033
- Table 27: Argentina Synthetic Food Flavor Revenue (billion) Forecast, by Application 2020 & 2033
- Table 28: Argentina Synthetic Food Flavor Volume (K) Forecast, by Application 2020 & 2033
- Table 29: Rest of South America Synthetic Food Flavor Revenue (billion) Forecast, by Application 2020 & 2033
- Table 30: Rest of South America Synthetic Food Flavor Volume (K) Forecast, by Application 2020 & 2033
- Table 31: Global Synthetic Food Flavor Revenue billion Forecast, by Application 2020 & 2033
- Table 32: Global Synthetic Food Flavor Volume K Forecast, by Application 2020 & 2033
- Table 33: Global Synthetic Food Flavor Revenue billion Forecast, by Type 2020 & 2033
- Table 34: Global Synthetic Food Flavor Volume K Forecast, by Type 2020 & 2033
- Table 35: Global Synthetic Food Flavor Revenue billion Forecast, by Country 2020 & 2033
- Table 36: Global Synthetic Food Flavor Volume K Forecast, by Country 2020 & 2033
- Table 37: United Kingdom Synthetic Food Flavor Revenue (billion) Forecast, by Application 2020 & 2033
- Table 38: United Kingdom Synthetic Food Flavor Volume (K) Forecast, by Application 2020 & 2033
- Table 39: Germany Synthetic Food Flavor Revenue (billion) Forecast, by Application 2020 & 2033
- Table 40: Germany Synthetic Food Flavor Volume (K) Forecast, by Application 2020 & 2033
- Table 41: France Synthetic Food Flavor Revenue (billion) Forecast, by Application 2020 & 2033
- Table 42: France Synthetic Food Flavor Volume (K) Forecast, by Application 2020 & 2033
- Table 43: Italy Synthetic Food Flavor Revenue (billion) Forecast, by Application 2020 & 2033
- Table 44: Italy Synthetic Food Flavor Volume (K) Forecast, by Application 2020 & 2033
- Table 45: Spain Synthetic Food Flavor Revenue (billion) Forecast, by Application 2020 & 2033
- Table 46: Spain Synthetic Food Flavor Volume (K) Forecast, by Application 2020 & 2033
- Table 47: Russia Synthetic Food Flavor Revenue (billion) Forecast, by Application 2020 & 2033
- Table 48: Russia Synthetic Food Flavor Volume (K) Forecast, by Application 2020 & 2033
- Table 49: Benelux Synthetic Food Flavor Revenue (billion) Forecast, by Application 2020 & 2033
- Table 50: Benelux Synthetic Food Flavor Volume (K) Forecast, by Application 2020 & 2033
- Table 51: Nordics Synthetic Food Flavor Revenue (billion) Forecast, by Application 2020 & 2033
- Table 52: Nordics Synthetic Food Flavor Volume (K) Forecast, by Application 2020 & 2033
- Table 53: Rest of Europe Synthetic Food Flavor Revenue (billion) Forecast, by Application 2020 & 2033
- Table 54: Rest of Europe Synthetic Food Flavor Volume (K) Forecast, by Application 2020 & 2033
- Table 55: Global Synthetic Food Flavor Revenue billion Forecast, by Application 2020 & 2033
- Table 56: Global Synthetic Food Flavor Volume K Forecast, by Application 2020 & 2033
- Table 57: Global Synthetic Food Flavor Revenue billion Forecast, by Type 2020 & 2033
- Table 58: Global Synthetic Food Flavor Volume K Forecast, by Type 2020 & 2033
- Table 59: Global Synthetic Food Flavor Revenue billion Forecast, by Country 2020 & 2033
- Table 60: Global Synthetic Food Flavor Volume K Forecast, by Country 2020 & 2033
- Table 61: Turkey Synthetic Food Flavor Revenue (billion) Forecast, by Application 2020 & 2033
- Table 62: Turkey Synthetic Food Flavor Volume (K) Forecast, by Application 2020 & 2033
- Table 63: Israel Synthetic Food Flavor Revenue (billion) Forecast, by Application 2020 & 2033
- Table 64: Israel Synthetic Food Flavor Volume (K) Forecast, by Application 2020 & 2033
- Table 65: GCC Synthetic Food Flavor Revenue (billion) Forecast, by Application 2020 & 2033
- Table 66: GCC Synthetic Food Flavor Volume (K) Forecast, by Application 2020 & 2033
- Table 67: North Africa Synthetic Food Flavor Revenue (billion) Forecast, by Application 2020 & 2033
- Table 68: North Africa Synthetic Food Flavor Volume (K) Forecast, by Application 2020 & 2033
- Table 69: South Africa Synthetic Food Flavor Revenue (billion) Forecast, by Application 2020 & 2033
- Table 70: South Africa Synthetic Food Flavor Volume (K) Forecast, by Application 2020 & 2033
- Table 71: Rest of Middle East & Africa Synthetic Food Flavor Revenue (billion) Forecast, by Application 2020 & 2033
- Table 72: Rest of Middle East & Africa Synthetic Food Flavor Volume (K) Forecast, by Application 2020 & 2033
- Table 73: Global Synthetic Food Flavor Revenue billion Forecast, by Application 2020 & 2033
- Table 74: Global Synthetic Food Flavor Volume K Forecast, by Application 2020 & 2033
- Table 75: Global Synthetic Food Flavor Revenue billion Forecast, by Type 2020 & 2033
- Table 76: Global Synthetic Food Flavor Volume K Forecast, by Type 2020 & 2033
- Table 77: Global Synthetic Food Flavor Revenue billion Forecast, by Country 2020 & 2033
- Table 78: Global Synthetic Food Flavor Volume K Forecast, by Country 2020 & 2033
- Table 79: China Synthetic Food Flavor Revenue (billion) Forecast, by Application 2020 & 2033
- Table 80: China Synthetic Food Flavor Volume (K) Forecast, by Application 2020 & 2033
- Table 81: India Synthetic Food Flavor Revenue (billion) Forecast, by Application 2020 & 2033
- Table 82: India Synthetic Food Flavor Volume (K) Forecast, by Application 2020 & 2033
- Table 83: Japan Synthetic Food Flavor Revenue (billion) Forecast, by Application 2020 & 2033
- Table 84: Japan Synthetic Food Flavor Volume (K) Forecast, by Application 2020 & 2033
- Table 85: South Korea Synthetic Food Flavor Revenue (billion) Forecast, by Application 2020 & 2033
- Table 86: South Korea Synthetic Food Flavor Volume (K) Forecast, by Application 2020 & 2033
- Table 87: ASEAN Synthetic Food Flavor Revenue (billion) Forecast, by Application 2020 & 2033
- Table 88: ASEAN Synthetic Food Flavor Volume (K) Forecast, by Application 2020 & 2033
- Table 89: Oceania Synthetic Food Flavor Revenue (billion) Forecast, by Application 2020 & 2033
- Table 90: Oceania Synthetic Food Flavor Volume (K) Forecast, by Application 2020 & 2033
- Table 91: Rest of Asia Pacific Synthetic Food Flavor Revenue (billion) Forecast, by Application 2020 & 2033
- Table 92: Rest of Asia Pacific Synthetic Food Flavor Volume (K) Forecast, by Application 2020 & 2033
Frequently Asked Questions
1. What is the projected Compound Annual Growth Rate (CAGR) of the Synthetic Food Flavor?
The projected CAGR is approximately 5.5%.
2. Which companies are prominent players in the Synthetic Food Flavor?
Key companies in the market include IFF, Givaudan, Firmenich, Symrise, Apple Flavor and Fragrance Group Co., Ltd., Takasago, Hasegawa, MAY CHEN AROMATIC CO., LTD., Danisco, Ningbo Weilong Flavor & Fragrance Co., Ltd..
3. What are the main segments of the Synthetic Food Flavor?
The market segments include Application, Type.
4. Can you provide details about the market size?
The market size is estimated to be USD 21.42 billion as of 2022.
5. What are some drivers contributing to market growth?
N/A
6. What are the notable trends driving market growth?
N/A
7. Are there any restraints impacting market growth?
N/A
8. Can you provide examples of recent developments in the market?
N/A
9. What pricing options are available for accessing the report?
Pricing options include single-user, multi-user, and enterprise licenses priced at USD 3950.00, USD 5925.00, and USD 7900.00 respectively.
10. Is the market size provided in terms of value or volume?
The market size is provided in terms of value, measured in billion and volume, measured in K.
11. Are there any specific market keywords associated with the report?
Yes, the market keyword associated with the report is "Synthetic Food Flavor," which aids in identifying and referencing the specific market segment covered.
12. How do I determine which pricing option suits my needs best?
The pricing options vary based on user requirements and access needs. Individual users may opt for single-user licenses, while businesses requiring broader access may choose multi-user or enterprise licenses for cost-effective access to the report.
13. Are there any additional resources or data provided in the Synthetic Food Flavor report?
While the report offers comprehensive insights, it's advisable to review the specific contents or supplementary materials provided to ascertain if additional resources or data are available.
14. How can I stay updated on further developments or reports in the Synthetic Food Flavor?
To stay informed about further developments, trends, and reports in the Synthetic Food Flavor, consider subscribing to industry newsletters, following relevant companies and organizations, or regularly checking reputable industry news sources and publications.
Methodology
Step 1 - Identification of Relevant Samples Size from Population Database


Step 2 - Approaches for Defining Global Market Size (Value, Volume* & Price*)

Note*: In applicable scenarios
Step 3 - Data Sources
Primary Research
- Web Analytics
- Survey Reports
- Research Institute
- Latest Research Reports
- Opinion Leaders
Secondary Research
- Annual Reports
- White Paper
- Latest Press Release
- Industry Association
- Paid Database
- Investor Presentations

Step 4 - Data Triangulation
Involves using different sources of information in order to increase the validity of a study
These sources are likely to be stakeholders in a program - participants, other researchers, program staff, other community members, and so on.
Then we put all data in single framework & apply various statistical tools to find out the dynamic on the market.
During the analysis stage, feedback from the stakeholder groups would be compared to determine areas of agreement as well as areas of divergence