

Key Insights
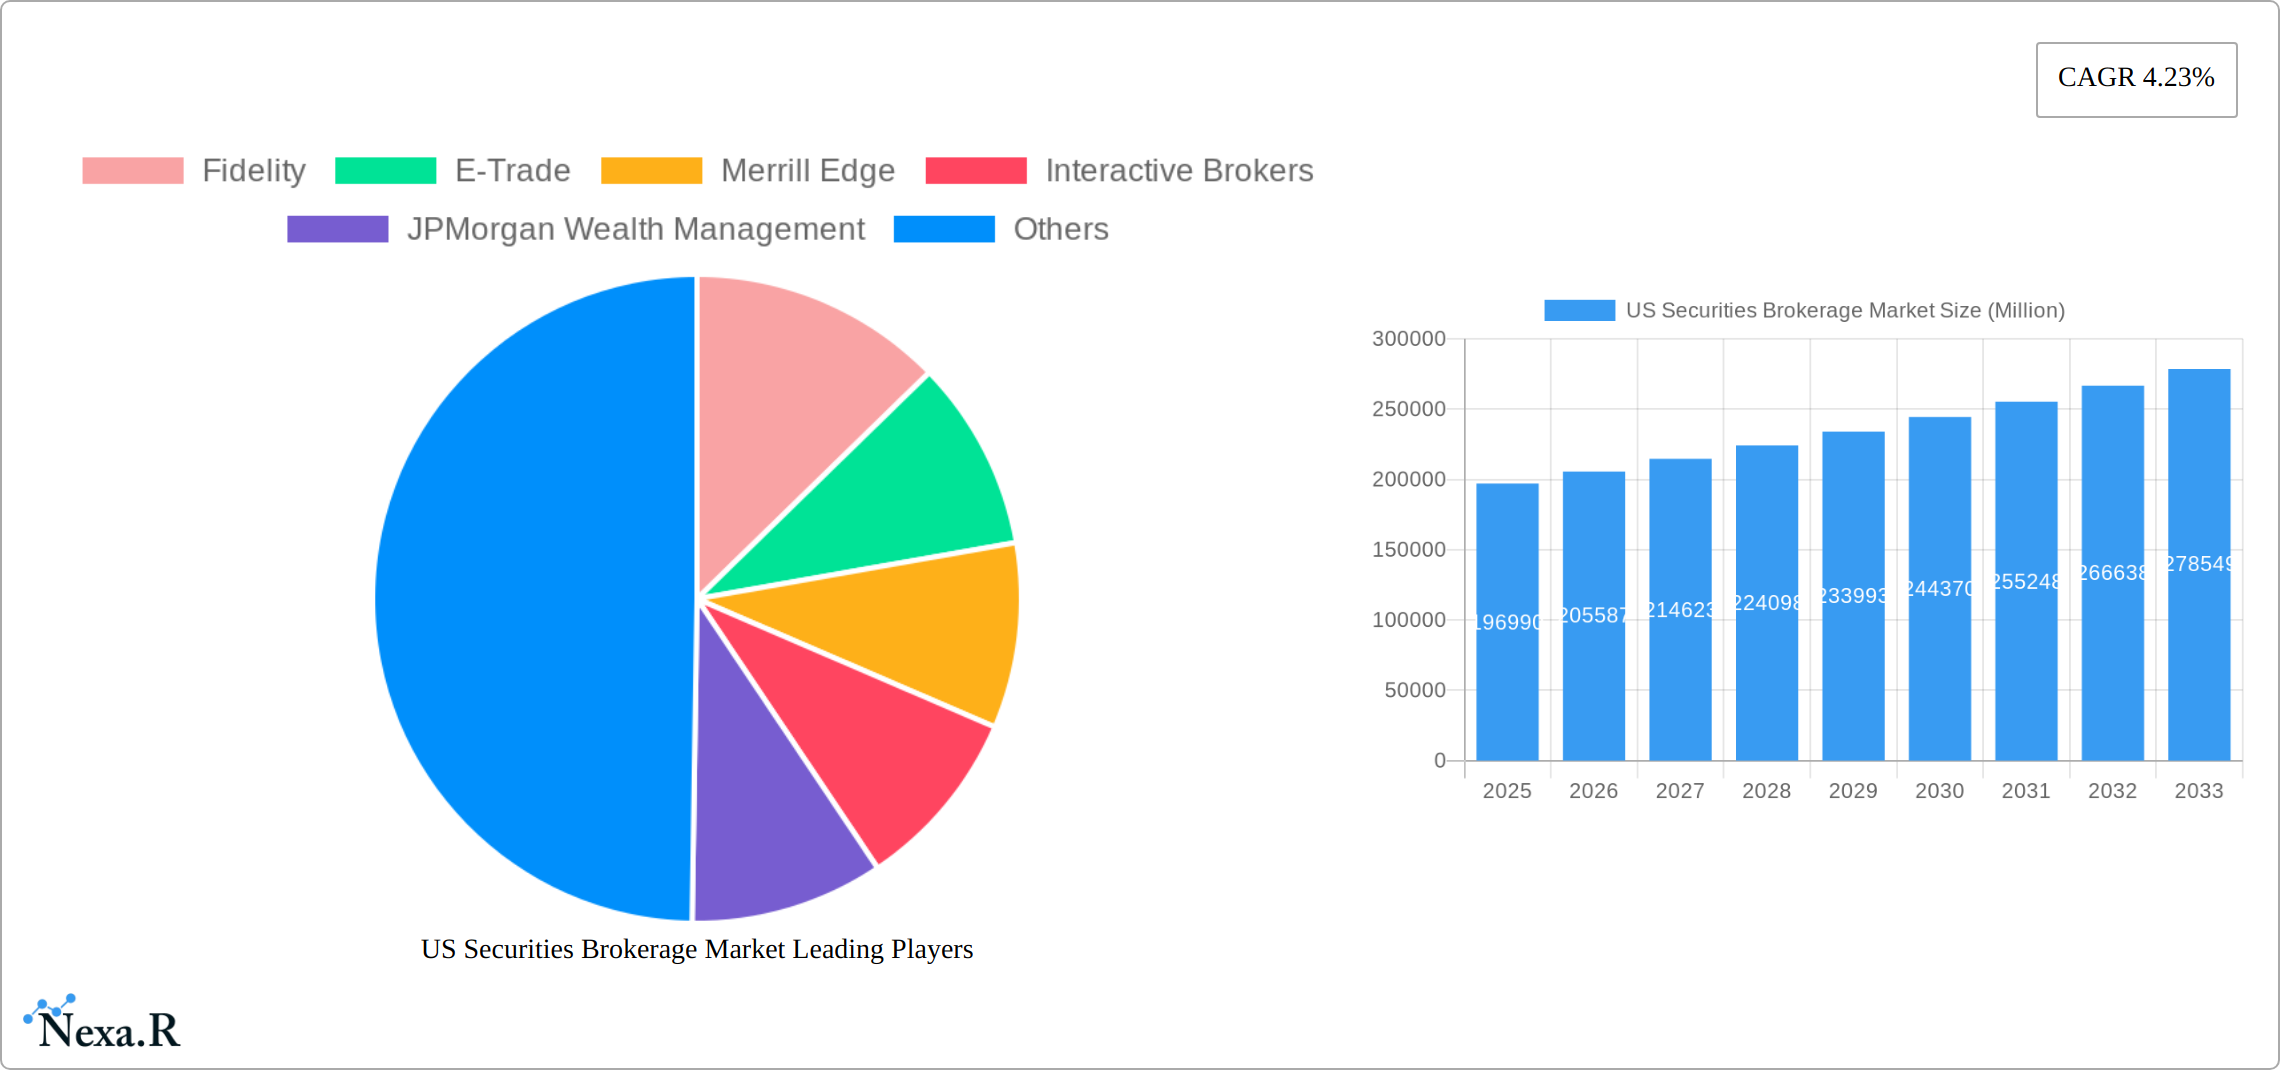
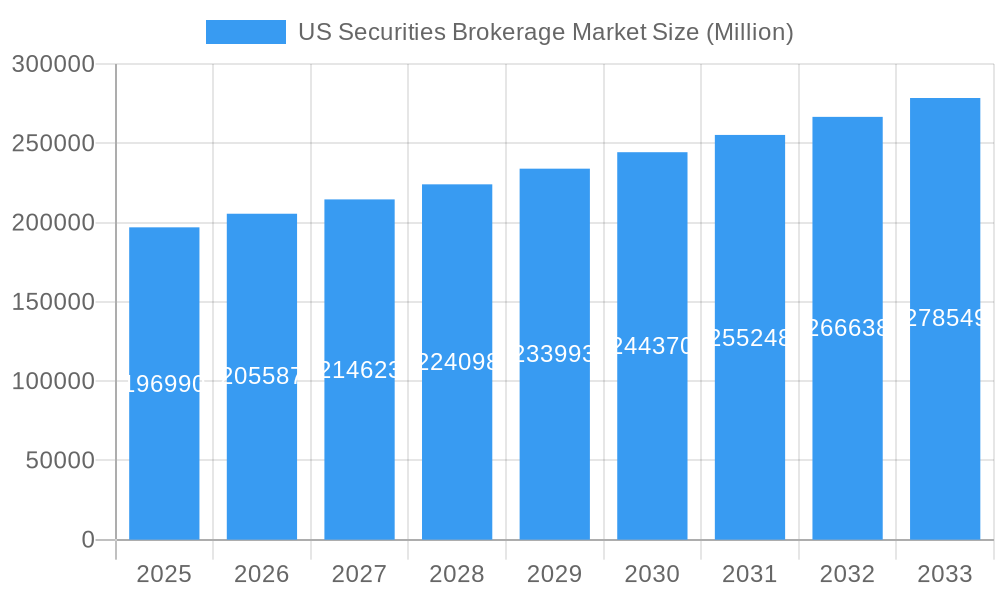
The US Securities Brokerage market, valued at $196.99 billion in 2025, is projected to experience steady growth, with a Compound Annual Growth Rate (CAGR) of 4.23% from 2025 to 2033. This growth is driven by several key factors. Increased retail investor participation, fueled by technological advancements and easier access to trading platforms, contributes significantly. The rise of mobile trading apps and commission-free brokerage services has democratized investing, attracting a wider range of demographics. Furthermore, the growing popularity of robo-advisors and algorithmic trading strategies appeals to both novice and experienced investors seeking streamlined portfolio management. While regulatory changes and market volatility pose potential challenges, the overall market outlook remains positive. The continued innovation in financial technology and the expansion of investment products are expected to fuel further growth in the coming years. Major players like Fidelity, Charles Schwab, and E-Trade continue to dominate the market, but the emergence of new fintech companies offering niche services and competitive pricing creates a dynamic landscape.
US Securities Brokerage Market Market Size (In Billion)
The competitive landscape is characterized by both established financial institutions and innovative fintech startups. Established players leverage their extensive brand recognition, robust infrastructure, and comprehensive service offerings to maintain a strong market presence. However, fintech disruptors are gaining traction by offering user-friendly interfaces, low or no fees, and specialized investment tools tailored to specific investor segments. This competition fosters innovation and enhances the overall investor experience. The market segmentation is likely to evolve further, with increased specialization in areas such as robo-advisory services, fractional share trading, and alternative investment platforms. The ongoing expansion of the market is anticipated to attract further investment and innovation within the sector, leading to even more competitive pricing and sophisticated investment tools in the coming decade.
US Securities Brokerage Market Company Market Share
US Securities Brokerage Market: A Comprehensive Market Report (2019-2033)
This in-depth report provides a comprehensive analysis of the US Securities Brokerage Market, covering market dynamics, growth trends, key players, and future outlook. The report analyzes the parent market of Financial Services and the child market of Securities Brokerage, offering invaluable insights for investors, industry professionals, and strategic decision-makers. The study period spans from 2019 to 2033, with 2025 as the base and estimated year. The forecast period is 2025-2033, and the historical period covers 2019-2024. The market size is presented in millions of units.
US Securities Brokerage Market Dynamics & Structure
This section delves into the intricate structure of the US Securities Brokerage market, examining market concentration, technological advancements, regulatory landscapes, competitive dynamics, and evolving user demographics. We analyze the impact of mergers and acquisitions (M&A) activity on market consolidation. The analysis includes quantitative data such as market share percentages and M&A deal volumes, alongside qualitative assessments of innovation barriers and competitive landscapes.
- Market Concentration: The US securities brokerage market exhibits a moderately concentrated structure, with major players like Charles Schwab and Fidelity holding significant market share. However, the rise of online brokerages like Robinhood and Webull is increasing competition. xx% of the market is controlled by the top 5 players in 2024.
- Technological Innovation: Technological advancements, including mobile trading apps, algorithmic trading, and robo-advisors, are reshaping the industry, driving efficiency and accessibility. However, cybersecurity threats and the need for robust data infrastructure present challenges.
- Regulatory Framework: Stringent regulatory frameworks, including those from the SEC and FINRA, aim to protect investors and ensure market integrity. These regulations influence operational costs and compliance requirements for brokerage firms.
- Competitive Landscape: The market is characterized by intense competition, with traditional full-service brokerages competing with discount brokerages and online platforms. The entry of fintech companies further intensifies this competition.
- End-User Demographics: The user base is diversifying, with younger generations increasingly engaging in online trading. This demographic shift necessitates adapting service offerings and technological platforms.
- M&A Trends: The market has witnessed significant M&A activity in recent years, driven by the pursuit of scale, technological capabilities, and diversification. The number of deals increased by xx% from 2020 to 2024.
US Securities Brokerage Market Growth Trends & Insights
This section provides a comprehensive overview of market size evolution, adoption rates, technological disruptions, and shifts in consumer behavior within the US Securities Brokerage market. The analysis utilizes extensive data to present detailed insights into market growth trajectories and contributing factors. Specific metrics, including the Compound Annual Growth Rate (CAGR) and market penetration rates, are provided to illustrate growth dynamics.
This section will explore market size evolution (from xx million in 2019 to xx million in 2024), adoption rates of new technologies, the impact of technological disruptions like robo-advisors and mobile trading, and the shifting preferences of investors regarding investment strategies and platforms. The analysis will include the calculation and interpretation of the CAGR for the historical and forecast periods, as well as the market penetration rate of various technologies and services.
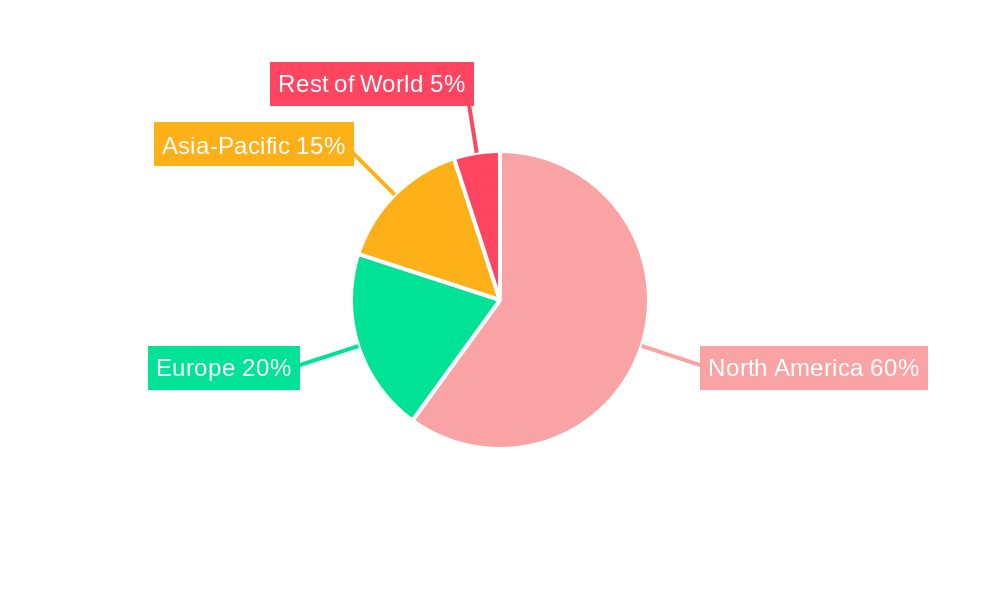
Dominant Regions, Countries, or Segments in US Securities Brokerage Market
This section identifies the leading regions, countries, or segments driving market growth. Key drivers such as economic policies, technological infrastructure, and investor sentiment are highlighted through bullet points. The analysis explores dominance factors, including market share and growth potential, providing a detailed understanding of regional variations.
- Dominant Region: The analysis indicates that the most dominant region is the Northeast, owing to higher concentrations of financial institutions and a high concentration of affluent investors.
- Key Growth Drivers:
- Favorable regulatory environment
- Strong economic growth
- High investor confidence
- Increased technological adoption
- Market Share and Growth Potential: The Northeast holds approximately xx% of the market share in 2024, with a projected growth rate of xx% during the forecast period.
US Securities Brokerage Market Product Landscape
This section provides a concise overview of product innovations, applications, and performance metrics within the US Securities Brokerage market. It focuses on unique selling propositions (USPs) and technological advancements shaping the product landscape. The analysis also includes a discussion of the performance metrics used to evaluate the effectiveness of various brokerage products and services.
The market offers a range of products catering to diverse investor needs, from basic brokerage accounts to sophisticated investment platforms with advanced analytics and research tools. Mobile trading apps have significantly increased accessibility, while robo-advisors offer automated investment management solutions. The emphasis is shifting towards personalized financial planning and wealth management services integrated within brokerage platforms.
Key Drivers, Barriers & Challenges in US Securities Brokerage Market
This section delves into the fundamental forces shaping the US Securities Brokerage Market, meticulously dissecting the key growth drivers, significant hurdles, and inherent challenges. We provide quantifiable impacts to foster a comprehensive understanding of the market's dynamic evolution and future trajectory.
Key Drivers:
- Technological Advancements: The pervasive adoption of sophisticated mobile trading platforms, the increasing implementation of algorithmic trading strategies, and the burgeoning influence of robo-advisory services are fundamentally transforming how individuals access and manage their investments.
- Evolving Regulatory Landscape: Continuous adjustments and new implementations within the regulatory framework significantly influence operational strategies, product development, and overall market accessibility for both brokers and investors.
- Expanding Investor Base: A notable surge in participation from retail investors, driven by increased financial literacy and accessible investment tools, is a primary catalyst for market expansion.
- Demand for Digital Services: The growing preference for seamless, digital-first brokerage experiences, encompassing account opening, trading execution, and customer support, is a crucial growth engine.
Challenges and Restraints:
- Escalating Cybersecurity Threats: The persistent and evolving nature of cyber threats, including sophisticated data breaches, identity theft, and fraudulent activities, poses a significant risk to client trust and operational integrity.
- Navigating Complex Regulatory Compliance: The stringent and ever-changing regulatory environment necessitates substantial investments in compliance infrastructure and expertise, thereby increasing operational costs and complexity.
- Intensifying Competitive Pressures: The market is characterized by fierce competition, not only among well-established financial institutions but also from agile fintech startups, demanding continuous innovation and differentiation.
- Market Volatility and Economic Uncertainty: Fluctuations in the broader economic climate and unpredictable market volatility can impact investor confidence and trading volumes, posing a challenge to consistent growth.
Emerging Opportunities in US Securities Brokerage Market
This section illuminates nascent trends and promising opportunities poised to redefine the US Securities Brokerage market. Our analysis zeroes in on previously untapped market segments, the innovative integration of cutting-edge applications, and the evolving preferences of the modern consumer.
- Inclusion of Underserved Populations: Strategic initiatives focused on expanding services to underbanked and unbanked demographics represent a significant growth frontier, fostering financial inclusion.
- Development of Hyper-Personalized Financial Planning Tools: The creation and deployment of advanced tools offering bespoke financial guidance, investment strategies, and retirement planning are meeting the demand for tailored client experiences.
- Leveraging Blockchain Technology: Exploring and implementing the potential of blockchain technology for enhanced security, transparency, and efficiency in transaction processing and asset management.
- Growth in ESG Investing: The increasing investor interest in Environmental, Social, and Governance (ESG) factors presents a substantial opportunity for brokerage firms to offer specialized investment products and advisory services.
- Democratization of Alternative Investments: Providing broader access to alternative asset classes like private equity, real estate, and cryptocurrencies through fractional ownership or specialized platforms.
Growth Accelerators in the US Securities Brokerage Market Industry
This section meticulously identifies the pivotal catalysts propelling sustained long-term growth within the US Securities Brokerage market. Our analysis underscores the transformative impact of technological advancements, the strategic significance of partnerships, and the vital role of market expansion initiatives in accelerating industry development.
Cutting-edge technological breakthroughs, particularly in the realms of artificial intelligence (AI) and machine learning, are fundamentally reshaping operational efficiencies, customer engagement, and investment decision-making, thereby acting as powerful growth accelerators. Strategic alliances and collaborations forged between established brokerage firms and innovative fintech companies are instrumental in fostering new product development, enhancing service delivery, and expanding market reach. Furthermore, proactive expansion into previously underserved geographical regions and the continuous conceptualization and launch of novel, client-centric products and services are critically enhancing the long-term growth prospects of the industry.
Key Players Shaping the US Securities Brokerage Market Market
- Fidelity
- E-Trade
- Merrill Edge
- Interactive Brokers
- JPMorgan Wealth Management
- Webull
- Robinhood
- Ally Invest
- Firstrade
- Charles Schwab
- List Not Exhaustive
Notable Milestones in US Securities Brokerage Market Sector
- February 2023: Fidelity Investments strategically expanded its comprehensive fixed-income offerings with the introduction of the Fidelity Municipal Core Plus Bond Fund (FMBAX), catering to a growing investor demand for diversified bond strategies.
- February 2023: Robinhood announced a significant strategic move by planning to repurchase Sam Bankman-Fried's substantial 7% stake in the company, aiming to consolidate ownership and influence investor perception.
- March 2023: Charles Schwab introduced a new suite of digital tools aimed at enhancing financial planning for young investors, acknowledging the growing importance of this demographic.
- April 2023: E*TRADE by Morgan Stanley launched an educational initiative focused on empowering retail investors with advanced trading strategies and market insights, further solidifying its commitment to investor education.
In-Depth US Securities Brokerage Market Market Outlook
The US Securities Brokerage market is poised for sustained growth driven by technological innovation, evolving investor preferences, and the expansion into new market segments. Strategic partnerships and product diversification will play a crucial role in shaping the future landscape. The continued adoption of mobile trading, robo-advisors, and personalized financial planning tools will drive market expansion and enhance investor engagement. The market is expected to witness significant growth, with numerous opportunities for established and emerging players.
US Securities Brokerage Market Segmentation
-
1. Type
- 1.1. Derivatives & Commodities Brokerage
- 1.2. Stock Exchanges
- 1.3. Bonds Brokerage
- 1.4. Equities Brokerage
- 1.5. Other Types
-
2. Mode
- 2.1. Online
- 2.2. Offline
-
3. Type of Establishment
- 3.1. Exclusive Brokers
- 3.2. Banks
- 3.3. Investment Firms
- 3.4. Other Types of Establishments
US Securities Brokerage Market Segmentation By Geography
-
1. North America
- 1.1. United States
- 1.2. Canada
- 1.3. Mexico
-
2. South America
- 2.1. Brazil
- 2.2. Argentina
- 2.3. Rest of South America
-
3. Europe
- 3.1. United Kingdom
- 3.2. Germany
- 3.3. France
- 3.4. Italy
- 3.5. Spain
- 3.6. Russia
- 3.7. Benelux
- 3.8. Nordics
- 3.9. Rest of Europe
-
4. Middle East & Africa
- 4.1. Turkey
- 4.2. Israel
- 4.3. GCC
- 4.4. North Africa
- 4.5. South Africa
- 4.6. Rest of Middle East & Africa
-
5. Asia Pacific
- 5.1. China
- 5.2. India
- 5.3. Japan
- 5.4. South Korea
- 5.5. ASEAN
- 5.6. Oceania
- 5.7. Rest of Asia Pacific
US Securities Brokerage Market Regional Market Share
Geographic Coverage of US Securities Brokerage Market
US Securities Brokerage Market REPORT HIGHLIGHTS
| Aspects | Details |
|---|---|
| Study Period | 2020-2034 |
| Base Year | 2025 |
| Estimated Year | 2026 |
| Forecast Period | 2026-2034 |
| Historical Period | 2020-2025 |
| Growth Rate | CAGR of 4.23% from 2020-2034 |
| Segmentation |
|
Table of Contents
- 1. Introduction
- 1.1. Research Scope
- 1.2. Market Segmentation
- 1.3. Research Objective
- 1.4. Definitions and Assumptions
- 2. Executive Summary
- 2.1. Market Snapshot
- 3. Market Dynamics
- 3.1. Market Drivers
- 3.2. Market Restrains
- 3.3. Market Trends
- 3.4. Market Opportunities
- 4. Market Factor Analysis
- 4.1. Porters Five Forces
- 4.1.1. Bargaining Power of Suppliers
- 4.1.2. Bargaining Power of Buyers
- 4.1.3. Threat of New Entrants
- 4.1.4. Threat of Substitutes
- 4.1.5. Competitive Rivalry
- 4.2. PESTEL analysis
- 4.3. BCG Analysis
- 4.3.1. Stars (High Growth, High Market Share)
- 4.3.2. Cash Cows (Low Growth, High Market Share)
- 4.3.3. Question Mark (High Growth, Low Market Share)
- 4.3.4. Dogs (Low Growth, Low Market Share)
- 4.4. Ansoff Matrix Analysis
- 4.5. Supply Chain Analysis
- 4.6. Regulatory Landscape
- 4.7. Current Market Potential and Opportunity Assessment (TAM–SAM–SOM Framework)
- 4.8. NRP Analyst Note
- 4.1. Porters Five Forces
- 5. Market Analysis, Insights and Forecast 2021-2033
- 5.1. Market Analysis, Insights and Forecast - by Type
- 5.1.1. Derivatives & Commodities Brokerage
- 5.1.2. Stock Exchanges
- 5.1.3. Bonds Brokerage
- 5.1.4. Equities Brokerage
- 5.1.5. Other Types
- 5.2. Market Analysis, Insights and Forecast - by Mode
- 5.2.1. Online
- 5.2.2. Offline
- 5.3. Market Analysis, Insights and Forecast - by Type of Establishment
- 5.3.1. Exclusive Brokers
- 5.3.2. Banks
- 5.3.3. Investment Firms
- 5.3.4. Other Types of Establishments
- 5.4. Market Analysis, Insights and Forecast - by Region
- 5.4.1. North America
- 5.4.2. South America
- 5.4.3. Europe
- 5.4.4. Middle East & Africa
- 5.4.5. Asia Pacific
- 5.1. Market Analysis, Insights and Forecast - by Type
- 6. Global US Securities Brokerage Market Analysis, Insights and Forecast, 2021-2033
- 6.1. Market Analysis, Insights and Forecast - by Type
- 6.1.1. Derivatives & Commodities Brokerage
- 6.1.2. Stock Exchanges
- 6.1.3. Bonds Brokerage
- 6.1.4. Equities Brokerage
- 6.1.5. Other Types
- 6.2. Market Analysis, Insights and Forecast - by Mode
- 6.2.1. Online
- 6.2.2. Offline
- 6.3. Market Analysis, Insights and Forecast - by Type of Establishment
- 6.3.1. Exclusive Brokers
- 6.3.2. Banks
- 6.3.3. Investment Firms
- 6.3.4. Other Types of Establishments
- 6.1. Market Analysis, Insights and Forecast - by Type
- 7. North America US Securities Brokerage Market Analysis, Insights and Forecast, 2020-2032
- 7.1. Market Analysis, Insights and Forecast - by Type
- 7.1.1. Derivatives & Commodities Brokerage
- 7.1.2. Stock Exchanges
- 7.1.3. Bonds Brokerage
- 7.1.4. Equities Brokerage
- 7.1.5. Other Types
- 7.2. Market Analysis, Insights and Forecast - by Mode
- 7.2.1. Online
- 7.2.2. Offline
- 7.3. Market Analysis, Insights and Forecast - by Type of Establishment
- 7.3.1. Exclusive Brokers
- 7.3.2. Banks
- 7.3.3. Investment Firms
- 7.3.4. Other Types of Establishments
- 7.1. Market Analysis, Insights and Forecast - by Type
- 8. South America US Securities Brokerage Market Analysis, Insights and Forecast, 2020-2032
- 8.1. Market Analysis, Insights and Forecast - by Type
- 8.1.1. Derivatives & Commodities Brokerage
- 8.1.2. Stock Exchanges
- 8.1.3. Bonds Brokerage
- 8.1.4. Equities Brokerage
- 8.1.5. Other Types
- 8.2. Market Analysis, Insights and Forecast - by Mode
- 8.2.1. Online
- 8.2.2. Offline
- 8.3. Market Analysis, Insights and Forecast - by Type of Establishment
- 8.3.1. Exclusive Brokers
- 8.3.2. Banks
- 8.3.3. Investment Firms
- 8.3.4. Other Types of Establishments
- 8.1. Market Analysis, Insights and Forecast - by Type
- 9. Europe US Securities Brokerage Market Analysis, Insights and Forecast, 2020-2032
- 9.1. Market Analysis, Insights and Forecast - by Type
- 9.1.1. Derivatives & Commodities Brokerage
- 9.1.2. Stock Exchanges
- 9.1.3. Bonds Brokerage
- 9.1.4. Equities Brokerage
- 9.1.5. Other Types
- 9.2. Market Analysis, Insights and Forecast - by Mode
- 9.2.1. Online
- 9.2.2. Offline
- 9.3. Market Analysis, Insights and Forecast - by Type of Establishment
- 9.3.1. Exclusive Brokers
- 9.3.2. Banks
- 9.3.3. Investment Firms
- 9.3.4. Other Types of Establishments
- 9.1. Market Analysis, Insights and Forecast - by Type
- 10. Middle East & Africa US Securities Brokerage Market Analysis, Insights and Forecast, 2020-2032
- 10.1. Market Analysis, Insights and Forecast - by Type
- 10.1.1. Derivatives & Commodities Brokerage
- 10.1.2. Stock Exchanges
- 10.1.3. Bonds Brokerage
- 10.1.4. Equities Brokerage
- 10.1.5. Other Types
- 10.2. Market Analysis, Insights and Forecast - by Mode
- 10.2.1. Online
- 10.2.2. Offline
- 10.3. Market Analysis, Insights and Forecast - by Type of Establishment
- 10.3.1. Exclusive Brokers
- 10.3.2. Banks
- 10.3.3. Investment Firms
- 10.3.4. Other Types of Establishments
- 10.1. Market Analysis, Insights and Forecast - by Type
- 11. Asia Pacific US Securities Brokerage Market Analysis, Insights and Forecast, 2020-2032
- 11.1. Market Analysis, Insights and Forecast - by Type
- 11.1.1. Derivatives & Commodities Brokerage
- 11.1.2. Stock Exchanges
- 11.1.3. Bonds Brokerage
- 11.1.4. Equities Brokerage
- 11.1.5. Other Types
- 11.2. Market Analysis, Insights and Forecast - by Mode
- 11.2.1. Online
- 11.2.2. Offline
- 11.3. Market Analysis, Insights and Forecast - by Type of Establishment
- 11.3.1. Exclusive Brokers
- 11.3.2. Banks
- 11.3.3. Investment Firms
- 11.3.4. Other Types of Establishments
- 11.1. Market Analysis, Insights and Forecast - by Type
- 12. Competitive Analysis
- 12.1. Company Profiles
- 12.1.1 Fidelity
- 12.1.1.1. Company Overview
- 12.1.1.2. Products
- 12.1.1.3. Company Financials
- 12.1.1.4. SWOT Analysis
- 12.1.2 E-Trade
- 12.1.2.1. Company Overview
- 12.1.2.2. Products
- 12.1.2.3. Company Financials
- 12.1.2.4. SWOT Analysis
- 12.1.3 Merrill Edge
- 12.1.3.1. Company Overview
- 12.1.3.2. Products
- 12.1.3.3. Company Financials
- 12.1.3.4. SWOT Analysis
- 12.1.4 Interactive Brokers
- 12.1.4.1. Company Overview
- 12.1.4.2. Products
- 12.1.4.3. Company Financials
- 12.1.4.4. SWOT Analysis
- 12.1.5 JPMorgan Wealth Management
- 12.1.5.1. Company Overview
- 12.1.5.2. Products
- 12.1.5.3. Company Financials
- 12.1.5.4. SWOT Analysis
- 12.1.6 Webull
- 12.1.6.1. Company Overview
- 12.1.6.2. Products
- 12.1.6.3. Company Financials
- 12.1.6.4. SWOT Analysis
- 12.1.7 Robinhood
- 12.1.7.1. Company Overview
- 12.1.7.2. Products
- 12.1.7.3. Company Financials
- 12.1.7.4. SWOT Analysis
- 12.1.8 Ally Invest
- 12.1.8.1. Company Overview
- 12.1.8.2. Products
- 12.1.8.3. Company Financials
- 12.1.8.4. SWOT Analysis
- 12.1.9 Firstrade
- 12.1.9.1. Company Overview
- 12.1.9.2. Products
- 12.1.9.3. Company Financials
- 12.1.9.4. SWOT Analysis
- 12.1.10 Charles Schwab**List Not Exhaustive
- 12.1.10.1. Company Overview
- 12.1.10.2. Products
- 12.1.10.3. Company Financials
- 12.1.10.4. SWOT Analysis
- 12.1.1 Fidelity
- 12.2. Market Entropy
- 12.2.1 Company's Key Areas Served
- 12.2.2 Recent Developments
- 12.3. Company Market Share Analysis 2025
- 12.3.1 Top 5 Companies Market Share Analysis
- 12.3.2 Top 3 Companies Market Share Analysis
- 12.4. List of Potential Customers
- 13. Research Methodology
List of Figures
- Figure 1: Global US Securities Brokerage Market Revenue Breakdown (Million, %) by Region 2025 & 2033
- Figure 2: Global US Securities Brokerage Market Volume Breakdown (Billion, %) by Region 2025 & 2033
- Figure 3: North America US Securities Brokerage Market Revenue (Million), by Type 2025 & 2033
- Figure 4: North America US Securities Brokerage Market Volume (Billion), by Type 2025 & 2033
- Figure 5: North America US Securities Brokerage Market Revenue Share (%), by Type 2025 & 2033
- Figure 6: North America US Securities Brokerage Market Volume Share (%), by Type 2025 & 2033
- Figure 7: North America US Securities Brokerage Market Revenue (Million), by Mode 2025 & 2033
- Figure 8: North America US Securities Brokerage Market Volume (Billion), by Mode 2025 & 2033
- Figure 9: North America US Securities Brokerage Market Revenue Share (%), by Mode 2025 & 2033
- Figure 10: North America US Securities Brokerage Market Volume Share (%), by Mode 2025 & 2033
- Figure 11: North America US Securities Brokerage Market Revenue (Million), by Type of Establishment 2025 & 2033
- Figure 12: North America US Securities Brokerage Market Volume (Billion), by Type of Establishment 2025 & 2033
- Figure 13: North America US Securities Brokerage Market Revenue Share (%), by Type of Establishment 2025 & 2033
- Figure 14: North America US Securities Brokerage Market Volume Share (%), by Type of Establishment 2025 & 2033
- Figure 15: North America US Securities Brokerage Market Revenue (Million), by Country 2025 & 2033
- Figure 16: North America US Securities Brokerage Market Volume (Billion), by Country 2025 & 2033
- Figure 17: North America US Securities Brokerage Market Revenue Share (%), by Country 2025 & 2033
- Figure 18: North America US Securities Brokerage Market Volume Share (%), by Country 2025 & 2033
- Figure 19: South America US Securities Brokerage Market Revenue (Million), by Type 2025 & 2033
- Figure 20: South America US Securities Brokerage Market Volume (Billion), by Type 2025 & 2033
- Figure 21: South America US Securities Brokerage Market Revenue Share (%), by Type 2025 & 2033
- Figure 22: South America US Securities Brokerage Market Volume Share (%), by Type 2025 & 2033
- Figure 23: South America US Securities Brokerage Market Revenue (Million), by Mode 2025 & 2033
- Figure 24: South America US Securities Brokerage Market Volume (Billion), by Mode 2025 & 2033
- Figure 25: South America US Securities Brokerage Market Revenue Share (%), by Mode 2025 & 2033
- Figure 26: South America US Securities Brokerage Market Volume Share (%), by Mode 2025 & 2033
- Figure 27: South America US Securities Brokerage Market Revenue (Million), by Type of Establishment 2025 & 2033
- Figure 28: South America US Securities Brokerage Market Volume (Billion), by Type of Establishment 2025 & 2033
- Figure 29: South America US Securities Brokerage Market Revenue Share (%), by Type of Establishment 2025 & 2033
- Figure 30: South America US Securities Brokerage Market Volume Share (%), by Type of Establishment 2025 & 2033
- Figure 31: South America US Securities Brokerage Market Revenue (Million), by Country 2025 & 2033
- Figure 32: South America US Securities Brokerage Market Volume (Billion), by Country 2025 & 2033
- Figure 33: South America US Securities Brokerage Market Revenue Share (%), by Country 2025 & 2033
- Figure 34: South America US Securities Brokerage Market Volume Share (%), by Country 2025 & 2033
- Figure 35: Europe US Securities Brokerage Market Revenue (Million), by Type 2025 & 2033
- Figure 36: Europe US Securities Brokerage Market Volume (Billion), by Type 2025 & 2033
- Figure 37: Europe US Securities Brokerage Market Revenue Share (%), by Type 2025 & 2033
- Figure 38: Europe US Securities Brokerage Market Volume Share (%), by Type 2025 & 2033
- Figure 39: Europe US Securities Brokerage Market Revenue (Million), by Mode 2025 & 2033
- Figure 40: Europe US Securities Brokerage Market Volume (Billion), by Mode 2025 & 2033
- Figure 41: Europe US Securities Brokerage Market Revenue Share (%), by Mode 2025 & 2033
- Figure 42: Europe US Securities Brokerage Market Volume Share (%), by Mode 2025 & 2033
- Figure 43: Europe US Securities Brokerage Market Revenue (Million), by Type of Establishment 2025 & 2033
- Figure 44: Europe US Securities Brokerage Market Volume (Billion), by Type of Establishment 2025 & 2033
- Figure 45: Europe US Securities Brokerage Market Revenue Share (%), by Type of Establishment 2025 & 2033
- Figure 46: Europe US Securities Brokerage Market Volume Share (%), by Type of Establishment 2025 & 2033
- Figure 47: Europe US Securities Brokerage Market Revenue (Million), by Country 2025 & 2033
- Figure 48: Europe US Securities Brokerage Market Volume (Billion), by Country 2025 & 2033
- Figure 49: Europe US Securities Brokerage Market Revenue Share (%), by Country 2025 & 2033
- Figure 50: Europe US Securities Brokerage Market Volume Share (%), by Country 2025 & 2033
- Figure 51: Middle East & Africa US Securities Brokerage Market Revenue (Million), by Type 2025 & 2033
- Figure 52: Middle East & Africa US Securities Brokerage Market Volume (Billion), by Type 2025 & 2033
- Figure 53: Middle East & Africa US Securities Brokerage Market Revenue Share (%), by Type 2025 & 2033
- Figure 54: Middle East & Africa US Securities Brokerage Market Volume Share (%), by Type 2025 & 2033
- Figure 55: Middle East & Africa US Securities Brokerage Market Revenue (Million), by Mode 2025 & 2033
- Figure 56: Middle East & Africa US Securities Brokerage Market Volume (Billion), by Mode 2025 & 2033
- Figure 57: Middle East & Africa US Securities Brokerage Market Revenue Share (%), by Mode 2025 & 2033
- Figure 58: Middle East & Africa US Securities Brokerage Market Volume Share (%), by Mode 2025 & 2033
- Figure 59: Middle East & Africa US Securities Brokerage Market Revenue (Million), by Type of Establishment 2025 & 2033
- Figure 60: Middle East & Africa US Securities Brokerage Market Volume (Billion), by Type of Establishment 2025 & 2033
- Figure 61: Middle East & Africa US Securities Brokerage Market Revenue Share (%), by Type of Establishment 2025 & 2033
- Figure 62: Middle East & Africa US Securities Brokerage Market Volume Share (%), by Type of Establishment 2025 & 2033
- Figure 63: Middle East & Africa US Securities Brokerage Market Revenue (Million), by Country 2025 & 2033
- Figure 64: Middle East & Africa US Securities Brokerage Market Volume (Billion), by Country 2025 & 2033
- Figure 65: Middle East & Africa US Securities Brokerage Market Revenue Share (%), by Country 2025 & 2033
- Figure 66: Middle East & Africa US Securities Brokerage Market Volume Share (%), by Country 2025 & 2033
- Figure 67: Asia Pacific US Securities Brokerage Market Revenue (Million), by Type 2025 & 2033
- Figure 68: Asia Pacific US Securities Brokerage Market Volume (Billion), by Type 2025 & 2033
- Figure 69: Asia Pacific US Securities Brokerage Market Revenue Share (%), by Type 2025 & 2033
- Figure 70: Asia Pacific US Securities Brokerage Market Volume Share (%), by Type 2025 & 2033
- Figure 71: Asia Pacific US Securities Brokerage Market Revenue (Million), by Mode 2025 & 2033
- Figure 72: Asia Pacific US Securities Brokerage Market Volume (Billion), by Mode 2025 & 2033
- Figure 73: Asia Pacific US Securities Brokerage Market Revenue Share (%), by Mode 2025 & 2033
- Figure 74: Asia Pacific US Securities Brokerage Market Volume Share (%), by Mode 2025 & 2033
- Figure 75: Asia Pacific US Securities Brokerage Market Revenue (Million), by Type of Establishment 2025 & 2033
- Figure 76: Asia Pacific US Securities Brokerage Market Volume (Billion), by Type of Establishment 2025 & 2033
- Figure 77: Asia Pacific US Securities Brokerage Market Revenue Share (%), by Type of Establishment 2025 & 2033
- Figure 78: Asia Pacific US Securities Brokerage Market Volume Share (%), by Type of Establishment 2025 & 2033
- Figure 79: Asia Pacific US Securities Brokerage Market Revenue (Million), by Country 2025 & 2033
- Figure 80: Asia Pacific US Securities Brokerage Market Volume (Billion), by Country 2025 & 2033
- Figure 81: Asia Pacific US Securities Brokerage Market Revenue Share (%), by Country 2025 & 2033
- Figure 82: Asia Pacific US Securities Brokerage Market Volume Share (%), by Country 2025 & 2033
List of Tables
- Table 1: Global US Securities Brokerage Market Revenue Million Forecast, by Type 2020 & 2033
- Table 2: Global US Securities Brokerage Market Volume Billion Forecast, by Type 2020 & 2033
- Table 3: Global US Securities Brokerage Market Revenue Million Forecast, by Mode 2020 & 2033
- Table 4: Global US Securities Brokerage Market Volume Billion Forecast, by Mode 2020 & 2033
- Table 5: Global US Securities Brokerage Market Revenue Million Forecast, by Type of Establishment 2020 & 2033
- Table 6: Global US Securities Brokerage Market Volume Billion Forecast, by Type of Establishment 2020 & 2033
- Table 7: Global US Securities Brokerage Market Revenue Million Forecast, by Region 2020 & 2033
- Table 8: Global US Securities Brokerage Market Volume Billion Forecast, by Region 2020 & 2033
- Table 9: Global US Securities Brokerage Market Revenue Million Forecast, by Type 2020 & 2033
- Table 10: Global US Securities Brokerage Market Volume Billion Forecast, by Type 2020 & 2033
- Table 11: Global US Securities Brokerage Market Revenue Million Forecast, by Mode 2020 & 2033
- Table 12: Global US Securities Brokerage Market Volume Billion Forecast, by Mode 2020 & 2033
- Table 13: Global US Securities Brokerage Market Revenue Million Forecast, by Type of Establishment 2020 & 2033
- Table 14: Global US Securities Brokerage Market Volume Billion Forecast, by Type of Establishment 2020 & 2033
- Table 15: Global US Securities Brokerage Market Revenue Million Forecast, by Country 2020 & 2033
- Table 16: Global US Securities Brokerage Market Volume Billion Forecast, by Country 2020 & 2033
- Table 17: United States US Securities Brokerage Market Revenue (Million) Forecast, by Application 2020 & 2033
- Table 18: United States US Securities Brokerage Market Volume (Billion) Forecast, by Application 2020 & 2033
- Table 19: Canada US Securities Brokerage Market Revenue (Million) Forecast, by Application 2020 & 2033
- Table 20: Canada US Securities Brokerage Market Volume (Billion) Forecast, by Application 2020 & 2033
- Table 21: Mexico US Securities Brokerage Market Revenue (Million) Forecast, by Application 2020 & 2033
- Table 22: Mexico US Securities Brokerage Market Volume (Billion) Forecast, by Application 2020 & 2033
- Table 23: Global US Securities Brokerage Market Revenue Million Forecast, by Type 2020 & 2033
- Table 24: Global US Securities Brokerage Market Volume Billion Forecast, by Type 2020 & 2033
- Table 25: Global US Securities Brokerage Market Revenue Million Forecast, by Mode 2020 & 2033
- Table 26: Global US Securities Brokerage Market Volume Billion Forecast, by Mode 2020 & 2033
- Table 27: Global US Securities Brokerage Market Revenue Million Forecast, by Type of Establishment 2020 & 2033
- Table 28: Global US Securities Brokerage Market Volume Billion Forecast, by Type of Establishment 2020 & 2033
- Table 29: Global US Securities Brokerage Market Revenue Million Forecast, by Country 2020 & 2033
- Table 30: Global US Securities Brokerage Market Volume Billion Forecast, by Country 2020 & 2033
- Table 31: Brazil US Securities Brokerage Market Revenue (Million) Forecast, by Application 2020 & 2033
- Table 32: Brazil US Securities Brokerage Market Volume (Billion) Forecast, by Application 2020 & 2033
- Table 33: Argentina US Securities Brokerage Market Revenue (Million) Forecast, by Application 2020 & 2033
- Table 34: Argentina US Securities Brokerage Market Volume (Billion) Forecast, by Application 2020 & 2033
- Table 35: Rest of South America US Securities Brokerage Market Revenue (Million) Forecast, by Application 2020 & 2033
- Table 36: Rest of South America US Securities Brokerage Market Volume (Billion) Forecast, by Application 2020 & 2033
- Table 37: Global US Securities Brokerage Market Revenue Million Forecast, by Type 2020 & 2033
- Table 38: Global US Securities Brokerage Market Volume Billion Forecast, by Type 2020 & 2033
- Table 39: Global US Securities Brokerage Market Revenue Million Forecast, by Mode 2020 & 2033
- Table 40: Global US Securities Brokerage Market Volume Billion Forecast, by Mode 2020 & 2033
- Table 41: Global US Securities Brokerage Market Revenue Million Forecast, by Type of Establishment 2020 & 2033
- Table 42: Global US Securities Brokerage Market Volume Billion Forecast, by Type of Establishment 2020 & 2033
- Table 43: Global US Securities Brokerage Market Revenue Million Forecast, by Country 2020 & 2033
- Table 44: Global US Securities Brokerage Market Volume Billion Forecast, by Country 2020 & 2033
- Table 45: United Kingdom US Securities Brokerage Market Revenue (Million) Forecast, by Application 2020 & 2033
- Table 46: United Kingdom US Securities Brokerage Market Volume (Billion) Forecast, by Application 2020 & 2033
- Table 47: Germany US Securities Brokerage Market Revenue (Million) Forecast, by Application 2020 & 2033
- Table 48: Germany US Securities Brokerage Market Volume (Billion) Forecast, by Application 2020 & 2033
- Table 49: France US Securities Brokerage Market Revenue (Million) Forecast, by Application 2020 & 2033
- Table 50: France US Securities Brokerage Market Volume (Billion) Forecast, by Application 2020 & 2033
- Table 51: Italy US Securities Brokerage Market Revenue (Million) Forecast, by Application 2020 & 2033
- Table 52: Italy US Securities Brokerage Market Volume (Billion) Forecast, by Application 2020 & 2033
- Table 53: Spain US Securities Brokerage Market Revenue (Million) Forecast, by Application 2020 & 2033
- Table 54: Spain US Securities Brokerage Market Volume (Billion) Forecast, by Application 2020 & 2033
- Table 55: Russia US Securities Brokerage Market Revenue (Million) Forecast, by Application 2020 & 2033
- Table 56: Russia US Securities Brokerage Market Volume (Billion) Forecast, by Application 2020 & 2033
- Table 57: Benelux US Securities Brokerage Market Revenue (Million) Forecast, by Application 2020 & 2033
- Table 58: Benelux US Securities Brokerage Market Volume (Billion) Forecast, by Application 2020 & 2033
- Table 59: Nordics US Securities Brokerage Market Revenue (Million) Forecast, by Application 2020 & 2033
- Table 60: Nordics US Securities Brokerage Market Volume (Billion) Forecast, by Application 2020 & 2033
- Table 61: Rest of Europe US Securities Brokerage Market Revenue (Million) Forecast, by Application 2020 & 2033
- Table 62: Rest of Europe US Securities Brokerage Market Volume (Billion) Forecast, by Application 2020 & 2033
- Table 63: Global US Securities Brokerage Market Revenue Million Forecast, by Type 2020 & 2033
- Table 64: Global US Securities Brokerage Market Volume Billion Forecast, by Type 2020 & 2033
- Table 65: Global US Securities Brokerage Market Revenue Million Forecast, by Mode 2020 & 2033
- Table 66: Global US Securities Brokerage Market Volume Billion Forecast, by Mode 2020 & 2033
- Table 67: Global US Securities Brokerage Market Revenue Million Forecast, by Type of Establishment 2020 & 2033
- Table 68: Global US Securities Brokerage Market Volume Billion Forecast, by Type of Establishment 2020 & 2033
- Table 69: Global US Securities Brokerage Market Revenue Million Forecast, by Country 2020 & 2033
- Table 70: Global US Securities Brokerage Market Volume Billion Forecast, by Country 2020 & 2033
- Table 71: Turkey US Securities Brokerage Market Revenue (Million) Forecast, by Application 2020 & 2033
- Table 72: Turkey US Securities Brokerage Market Volume (Billion) Forecast, by Application 2020 & 2033
- Table 73: Israel US Securities Brokerage Market Revenue (Million) Forecast, by Application 2020 & 2033
- Table 74: Israel US Securities Brokerage Market Volume (Billion) Forecast, by Application 2020 & 2033
- Table 75: GCC US Securities Brokerage Market Revenue (Million) Forecast, by Application 2020 & 2033
- Table 76: GCC US Securities Brokerage Market Volume (Billion) Forecast, by Application 2020 & 2033
- Table 77: North Africa US Securities Brokerage Market Revenue (Million) Forecast, by Application 2020 & 2033
- Table 78: North Africa US Securities Brokerage Market Volume (Billion) Forecast, by Application 2020 & 2033
- Table 79: South Africa US Securities Brokerage Market Revenue (Million) Forecast, by Application 2020 & 2033
- Table 80: South Africa US Securities Brokerage Market Volume (Billion) Forecast, by Application 2020 & 2033
- Table 81: Rest of Middle East & Africa US Securities Brokerage Market Revenue (Million) Forecast, by Application 2020 & 2033
- Table 82: Rest of Middle East & Africa US Securities Brokerage Market Volume (Billion) Forecast, by Application 2020 & 2033
- Table 83: Global US Securities Brokerage Market Revenue Million Forecast, by Type 2020 & 2033
- Table 84: Global US Securities Brokerage Market Volume Billion Forecast, by Type 2020 & 2033
- Table 85: Global US Securities Brokerage Market Revenue Million Forecast, by Mode 2020 & 2033
- Table 86: Global US Securities Brokerage Market Volume Billion Forecast, by Mode 2020 & 2033
- Table 87: Global US Securities Brokerage Market Revenue Million Forecast, by Type of Establishment 2020 & 2033
- Table 88: Global US Securities Brokerage Market Volume Billion Forecast, by Type of Establishment 2020 & 2033
- Table 89: Global US Securities Brokerage Market Revenue Million Forecast, by Country 2020 & 2033
- Table 90: Global US Securities Brokerage Market Volume Billion Forecast, by Country 2020 & 2033
- Table 91: China US Securities Brokerage Market Revenue (Million) Forecast, by Application 2020 & 2033
- Table 92: China US Securities Brokerage Market Volume (Billion) Forecast, by Application 2020 & 2033
- Table 93: India US Securities Brokerage Market Revenue (Million) Forecast, by Application 2020 & 2033
- Table 94: India US Securities Brokerage Market Volume (Billion) Forecast, by Application 2020 & 2033
- Table 95: Japan US Securities Brokerage Market Revenue (Million) Forecast, by Application 2020 & 2033
- Table 96: Japan US Securities Brokerage Market Volume (Billion) Forecast, by Application 2020 & 2033
- Table 97: South Korea US Securities Brokerage Market Revenue (Million) Forecast, by Application 2020 & 2033
- Table 98: South Korea US Securities Brokerage Market Volume (Billion) Forecast, by Application 2020 & 2033
- Table 99: ASEAN US Securities Brokerage Market Revenue (Million) Forecast, by Application 2020 & 2033
- Table 100: ASEAN US Securities Brokerage Market Volume (Billion) Forecast, by Application 2020 & 2033
- Table 101: Oceania US Securities Brokerage Market Revenue (Million) Forecast, by Application 2020 & 2033
- Table 102: Oceania US Securities Brokerage Market Volume (Billion) Forecast, by Application 2020 & 2033
- Table 103: Rest of Asia Pacific US Securities Brokerage Market Revenue (Million) Forecast, by Application 2020 & 2033
- Table 104: Rest of Asia Pacific US Securities Brokerage Market Volume (Billion) Forecast, by Application 2020 & 2033
Frequently Asked Questions
1. What is the projected Compound Annual Growth Rate (CAGR) of the US Securities Brokerage Market?
The projected CAGR is approximately 4.23%.
2. Which companies are prominent players in the US Securities Brokerage Market?
Key companies in the market include Fidelity, E-Trade, Merrill Edge, Interactive Brokers, JPMorgan Wealth Management, Webull, Robinhood, Ally Invest, Firstrade, Charles Schwab**List Not Exhaustive.
3. What are the main segments of the US Securities Brokerage Market?
The market segments include Type, Mode, Type of Establishment.
4. Can you provide details about the market size?
The market size is estimated to be USD 196.99 Million as of 2022.
5. What are some drivers contributing to market growth?
N/A
6. What are the notable trends driving market growth?
Securities Brokerage is the leading Revenue generating in US Market.
7. Are there any restraints impacting market growth?
N/A
8. Can you provide examples of recent developments in the market?
February 2023: Fidelity Investments, one of the world's leading global fixed-income investment managers, announced the launch of the Fidelity Municipal Core Plus Bond Fund (FMBAX), adding to Fidelity's diverse lineup of active fixed-income strategies reaching across the risk spectrum. The fund, which allows Fidelity to participate in a fast-growing subset within the municipal bond space, is available commission-free and with no investment minimum to individual investors and financial advisors through Fidelity's online brokerage platforms.
9. What pricing options are available for accessing the report?
Pricing options include single-user, multi-user, and enterprise licenses priced at USD 3800, USD 4500, and USD 5800 respectively.
10. Is the market size provided in terms of value or volume?
The market size is provided in terms of value, measured in Million and volume, measured in Billion.
11. Are there any specific market keywords associated with the report?
Yes, the market keyword associated with the report is "US Securities Brokerage Market," which aids in identifying and referencing the specific market segment covered.
12. How do I determine which pricing option suits my needs best?
The pricing options vary based on user requirements and access needs. Individual users may opt for single-user licenses, while businesses requiring broader access may choose multi-user or enterprise licenses for cost-effective access to the report.
13. Are there any additional resources or data provided in the US Securities Brokerage Market report?
While the report offers comprehensive insights, it's advisable to review the specific contents or supplementary materials provided to ascertain if additional resources or data are available.
14. How can I stay updated on further developments or reports in the US Securities Brokerage Market?
To stay informed about further developments, trends, and reports in the US Securities Brokerage Market, consider subscribing to industry newsletters, following relevant companies and organizations, or regularly checking reputable industry news sources and publications.
Methodology
Step 1 - Identification of Relevant Samples Size from Population Database


Step 2 - Approaches for Defining Global Market Size (Value, Volume* & Price*)

Note*: In applicable scenarios
Step 3 - Data Sources
Primary Research
- Web Analytics
- Survey Reports
- Research Institute
- Latest Research Reports
- Opinion Leaders
Secondary Research
- Annual Reports
- White Paper
- Latest Press Release
- Industry Association
- Paid Database
- Investor Presentations

Step 4 - Data Triangulation
Involves using different sources of information in order to increase the validity of a study
These sources are likely to be stakeholders in a program - participants, other researchers, program staff, other community members, and so on.
Then we put all data in single framework & apply various statistical tools to find out the dynamic on the market.
During the analysis stage, feedback from the stakeholder groups would be compared to determine areas of agreement as well as areas of divergence